Fermi surface topology of Ca1.5Sr0.5RuO4 determined by ARPES
Abstract
We report ARPES results of the Fermi surface of Ca1.5Sr0.5RuO4, which is at the boundary of magnetic/orbital instability in the phase diagram of the Ca-substituted Sr ruthenates. Three energy bands and the corresponding Fermi surface sheets are observed, which are also present in the Ca-free Sr2RuO4. We find that while the Fermi surface topology of the , () sheets remains almost the same in these two materials, the () sheet exhibits a hole-like Fermi surface in Ca1.5Sr0.5RuO4 in contrast to being electron-like in Sr2RuO4. Our observation of all three volume conserving Fermi surface sheets clearly demonstrates the absence of orbital-selective Mott transition, which was proposed theoretically to explain the unusual transport and magnetic properties in Ca1.5Sr0.5RuO4.
The discovery of unconventional superconductivity in Sr2RuO4 has generated considerable interests in studying the electronic structure of the ruthenates Maeno_Nature . Sr2RuO4, as the only layered perovskite superconductor without copper, has the same crystal structure as the high- cuprate, La(Sr)2CuO4. As in the case of cuprates, Sr2RuO4 can be regarded as being in proximity to a Mott insulator since a complete replacement of Sr by isovalent Ca leads to an antiferromagnetic (AF) insulator state with a moment corresponding to spin S=1 Cao . It is recently discovered that partial substitution of Sr by isoelectronic Ca generates a complex phase diagram for Ca2-xSrxRuO4 Nakatsuji_PRL00 . At low Sr concentrations (), the system is an AF Mott insulator at low temperatures (), a metal-insulator transition occurs at a higher . At higher Sr concentrations (), the system becomes metallic at all with AF correlations at low . Upon further increasing Sr (), the system becomes a paramagnetic metal, and superconductivity emerges at = 2. The Sr concentration = 0.5 is believed to be at a quantum critical point, separating a metallic and orbitally ordered phase () from the paramagnetic metal () Anisimov . The spin susceptibility, at the zero temperature limit, is critically enhanced at = 0.5, indicating a nearly ferromagnetic (FM) instability at this composition Nakatsuji_PRL00 . It should be emphasized that since Sr and Ca are isoelectronic, Ca-substitution does not change the valence electron numbers in contrast to carrier doping in the cuprate high-Tc superconductors. The rich physical phenomena in this series result rather from the changes in the interplay between electronic correlations and the band structures induced by the crystal structure changes, and the intriguing possibility of “internal doping” of selected bands due to the transfer of valence electrons among the orbitals.
The low-energy excitations of Ca2-xSrxRuO4 are believed to originate from the hybridization between Ru-4 and O-2 orbitals. It is generally accepted that, at the one end of the phase diagram, Sr2RuO4 has four valence electrons evenly distributed in the three orbitals, forming three energy bands , (due to the mixing of and states) and (). The electron occupancy has the fractions (, )=(, ). At the other end, Ca2RuO4’s electron distribution is believed to be (2,2), creating a Mott localized AF ground state at low Anisimov . However, the evolution of the electron distribution and band structure in partially substituted Ca2-xSrxRuO4 is not fully understood yet. In particular, the knowledge of the electronic structure of Ca1.5Sr0.5RuO4 is important in understanding the alleged critical behavior and the transition to the Mott insulator.
It is proposed by Anisimov et al. Anisimov , based on a Non-Crossing Approximation (NCA) calculation within Dynamical Mean Field Theory (DMFT), that the valence electron distribution becomes (3,1) at . They further proposed that one of the and bands hosts 2 of the 3 electrons and is thus completely filled and band-insulating while the other, half-filled band becomes Mott-localized with spin- local moment due to the narrow bandwidth relative to the Coulomb energy (Hubbard-U). The half-filled band, however, remains itinerant due to its wider bandwidth, resulting in a metallic phase consistent with the experiments Nakatsuji_PRL00 ; Nakatsuji_PRB . This proposal of an apparent orbital-selective Mott transition (OSMT) is of general interests to multi-band correlated systems such as transition metal oxides and the heavy fermion compounds. However, the (non)existence of OSMT, particularly in real materials, has been a much debated issue Liebsch ; Koga ; Liebsch_new . From a quantum mechanical point of view, localized and extended states cannot coexist at the same energy unless quantum tunneling (mixing) between these states are strictly forbidden by symmetry considerations. Indeed, a different Quantum Monte Carlo (QMC) calculation within the DMFT by Liebsch Liebsch suggests a common metal-insulator transition for all three bands at a same critical correlation . The debate on this issue continues with two recent theoretical papers reaching opposite conclusions Koga ; Liebsch_new . However, there has been no experimental test that such OSMT exists in degenerate -electron systems with small bandwidth difference among orbitals.
Angle-resolved photoelectron spectroscopy (ARPES) is a suitable experimental technique to study this problem because of its ability to determine band dispersion and the Fermi surface in the momentum space. The technique of de Hass-van Alphen (dHvA) is another commonly used method for measuring the Fermi surface. It has played a crucial role in mapping the three Fermi sheets in the undoped Sr2RuO4. However, it is difficult to use dHvA to probe Ca-doped ruthenate due to disorders in the doped materials. Therefore ARPES is perhaps a unique experimental tool to resolve this controversy, as suggested originally by Anisimov et al Anisimov . We have measured extensively Ca1.5Sr0.5RuO4 single crystals and performed a comparative study to Sr2RuO4, as reported below.
High-quality Ca2-xSrxRuO4 single crystals are prepared by the floating zone method Jin . ARPES experiments are performed at the Synchrotron Radiation Center, Wisconsin using undulator beamlines (U1 NIM and PGM) at different photon energies (10 to 32 ). Samples are cleaved in situ and measured at = 40 in a vacuum better than . A Scienta analyzer capable of multi-angle detection is used with energy resolution of 10 - 20 , and momentum resolution of Å-1. Samples are stable and show no sign of degradation during a typical measurement period of 12 hours.
Similar to Sr2RuO4, Ca1.5Sr0.5RuO4 is easy to cleave and usually has a good (001) surface. Both materials exhibit clear LEED patterns for their cleaved surfaces, as shown in Figs. 1(a)-(b). The brighter LEED spots form a square lattice, corresponding to the 2D RuO2 lattice. The additional faint spots, which appear in the middle of four bright spots, is caused by the rotation of RuO6-octahedra along the -axis. In Sr2RuO4, this rotation is caused by a surface reconstruction driven by a soft phonon mode Matzdorf . However, this rotation is observed to exist in the bulk of Ca2-xSrxRuO4 when Friedt . For Ca1.5Sr0.5RuO4, the rotation angle in the bulk is about 12∘ Friedt . In comparison, the rotation angle on the surface obtained by LEED analysis is about 11∘, indicating similar crystal structures between the bulk and surface. Therefore we expect ARPES results on Ca1.5Sr0.5RuO4 are bulk representative.
Due to the rotation of RuO6-octahedra, the 2D Brillouin zone (BZ) becomes a x lattice rotated 45∘ with respect to the original 1x1 square lattice. Nevertheless, in this paper, we still use the 1x1 square lattice to discuss the band structure for convenience in comparison. The main effect of this rotation on the band structure is a band folding with respect to the new zone boundaries. In Sr2RuO4, the surface states due to the lattice rotation can be greatly suppressed by varying photon energy or aging the surface in ARPES experiments. Thus bulk-representative band structure and Fermi surface topology, similar to the ones predicted by band calculations Oguchi ; Singh and observed by dHvA measurement Mackenzie , have been observed by ARPES on Sr2RuO4 Damascelli ; Ding_PhysicaC ; KMShen .
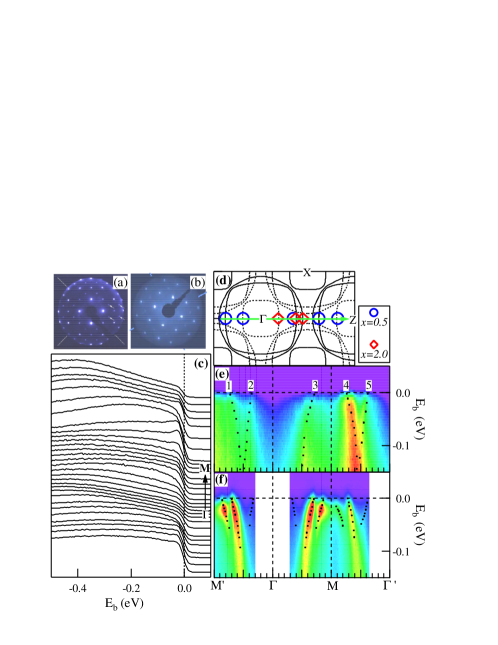
In the following we focus on the electronic structure near , which determines the low energy properties of this material. In Fig. 1(c) we plot the energy distribution curves (EDCs) of Ca1.5Sr0.5RuO4 along the (0,0)-(,0) (-, the Ru-O bond) direction over several BZs. One can clearly observe band dispersion and Fermi surface crossings (FSCs). To see the dispersion and FSCs more clearly, we display the corresponding - intensity plot in Fig. 1(e). We can identify five dispersive bands, as marked in Fig. 1(e). The strongest feature is #4 in the 2nd BZ, which has equivalent bands in other BZs, such as #1 and #3 whose -locations are shifted by a reciprocal lattice vector . In comparison to band calculations Oguchi ; Singh , dHvA measurements Mackenzie , and ARPES results Damascelli ; Ding_PhysicaC ; KMShen on Sr2RuO4, we find that these bands (#1, 3, and 4) match almost perfectly to the band. As an illustration, we plot the extracted FSCs of Ca1.5Sr0.5RuO4 in Fig. 1(d) where the calculated Sr2RuO4 FS sheets (solid lines) are shown. In Fig. 1(d) we also plot the FSCs of Sr2RuO4 extracted from Fig. 1(f).
Fig. 1(f) displays an - intensity plot along - for Sr2RuO4. In addition to the band, the band is observed near . However, no such a band is visible along - in Ca1.5Sr0.5RuO4, as shown in Fig. 1(e). One may argue that the observed bands (#1, 3, and 4) belong to the band that shrinks its FS area upon Ca substitution. This scenario is unlikely due to the observation of a reversed band dispersion, such as #5 and #2 in Fig. 1(e). We attribute this reversed band dispersion to a folded band caused by the rotation of RuO6-octahedra in the bulk of Ca1.5Sr0.5RuO4 Friedt . This band folding introduces the so-called “image” FS, as shown in Fig. 1(d) (dashed lines). The FSCs of the reversed bands #5 and #2 match well with the predicted “image” of FS. Note a similar band folding is also observed in Sr2RuO4, which is due to the rotation of RuO6-octahedra on the surface, as discussed before.
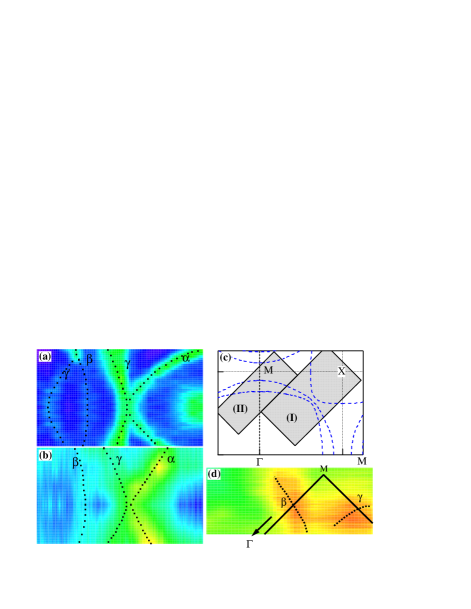
As seen in the band calculation, the three Fermi surfaces are adjacent in the vicinity of (2/3, 2/3). Thus this location is a good place to observe all the three FS and their relative positions. This is clearly demonstrated in the case of Sr2RuO4, as shown in Fig. 2(a), where the near- ( 20 meV) intensity is plotted in a 2D -region indicated by the shaded rectangular area (I) in the BZ shown in Fig. 2(c). One can clearly observe the three (, , ) FS sheets in Fig. 2(a), although the intensity of the FS is much weaker along -. This is most likely due to the selection rule of ARPES. While the and FS sheets are well separated due to orbital hybridization between them, the FS “touches” the FS along -, reflecting the non-mixing nature between the and -orbitals, as predicted based on a symmetry argument Rice . In addition, we observe the folded FS and a small FS pocket at the point, which is believed to be a result of the rotation of RuO6-octahedra on the surface of Sr2RuO4 KMShen .
For Ca1.5Sr0.5RuO4, as shown in Fig. 2(b), one can still observe the three FS sheets, although their intensity is weaker than in Sr2RuO4. The reduction in spectral intensity at is commonly observed in doped correlated systems. This decoherence phenomenon is believed to be caused by correlation and disorder effects. Among the three FSs, the FS is the most visible. A “faint” FS, which “touches” the FS along -, should belong to the band due to its non- or weak-mixing with the band. Another less visible FS, which is further separated from the FS, is naturally assigned to the band.
As discussed above, we do not observe the FS crossing along -. It is possible that the FS changes its topology from electron-like centered at to hole-like centered at . To check this, we measured the ARPES spectra in the vicinity of , indicated by the rectangular box (II) in the BZ shown in Fig. 2(c). From the plot of the near- intensity in Fig. 2(d), one can observe two FS sections: the one intersecting with - belongs to the FS, and the other intersecting with - should be the FS which becomes hole-like by enclosing the point.
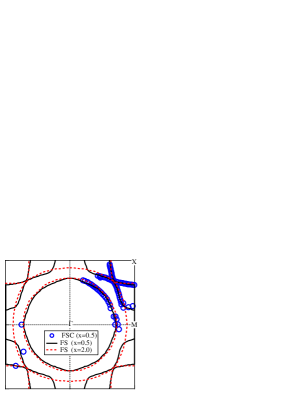
We summarize our ARPES results of Ca1.5Sr0.5RuO4 by plotting its measured Fermi surface in Fig. 3. The blue circles are the FS crossing points directly obtained from ARPES spectra. The black solid lines are derived Fermi surfaces based on the measurement and trivial symmetry operations. For the purpose of comparison, we also plot in Fig. 3 the Fermi surfaces (red dashed lines) of Sr2RuO4 determined from our ARPES experiment. It is clear from Fig. 3 that all the three FS sheets, with similar topology, are observed in both Ca1.5Sr0.5RuO4 and Sr2RuO4 with the significant difference that the FS changes from electron-like in Sr2RuO4 to hole-like in Ca1.5Sr0.5RuO4. This change is consistent with the LDA band calculations Singh ; Fang ; Fang_new for the rotated crystal structure. A similar change of the FS topology is also observed for the surface state in Sr2RuO4, which has the similar structure rotation on the surface KMShen .
From the determined FS topology in Fig. 3, we can extract the values of the Fermi vector () for the three Fermi surface sheets along the high symmetry lines, as listed in Table 1. We note that the values are similar to the ones obtained from dHvA measurement Mackenzie for Sr2RuO4. We also determined the occupied area for the three FS sheets, and find no appreciable differences between the two materials. These observations suggest that there is no significant electron transfer among the three orbitals at this Ca doping level, in contrast to the scenario proposed by Anisimov et al Anisimov . The total occupied area of the two materials are close to 2, indicative of 4 electrons per unit cell, satisfying Luttinger theorem.
| Ca1.5Sr0.5RuO4 | Sr2RuO4 | |
| (-M) | (0.72) | (0.72), (0.88) |
| (-X) | (0.67), (0.50) | (0.67), (0.51) |
| (M-X) | (0.62), (0.22) | (0.64) |
| FS Area | (0.86), (0.38), | (0.86),(0.41), |
| (0.68) | (0.64) | |
| Total Area | 1.92 | 1.91 |
The observation of all the three Fermi surface sheets in Ca1.5Sr0.5RuO4 and the lack of significant inter-orbital electron transfer clearly demonstrate the absence of OSMT in this material. The proposal of OSMT at = 0.5 was originally motivated by the experimental observation of spin- local moment Anisimov . The evidence for the local moment comes from fitting the magnetic susceptibility in Ca1.5Sr0.5RuO4 with the Curie-Weiss form. Our observation of three itinerant orbitals appears to be inconsistent with the existence of such localized moments, although more exotic mechanisms may account for (to a certain degree) the coexistence of the local moment and itinerant electrons. We note a recent polarized neutron diffraction experiment for = 0.5 Gukasov suggesting that the dominant magnetization distribution originates from the orbital rather than the / orbitals predicted by the OSMT theory. Nevertheless, the question of what type of Mott transition takes place upon further Ca doping remains. Whether or not it goes through OSMT is still an open issue, and requires more experimental efforts. A recent high-filed study Nakatsuji_PRL03 reports the saturation magnetic moment in Ca1.8Sr0.5RuO4 ( = 0.2) is close to the effective magneton of 1 that is expected from a system with a local moment of = 1/2, indicating a possible OSMT at = 0.2.
In summary, we observe all the three bands and the corresponding Fermi surface sheets in both Ca1.5Sr0.5RuO4 and Sr2RuO4 by ARPES experiment. The most significant change of the Fermi surface topology is the Fermi surface which becomes hole-like in Ca1.5Sr0.5RuO4 near the point, while being electron-like in Sr2RuO4. This is likely caused by the rotation of RuO6-octahedra along the -axis in the bulk upon the Ca substitution. Together with our observation that the electron filling fractions are conserved approximately within each of the orbitals when compared to Sr2RuO4, we conclude that the orbital-selective Mott transition is absent at and call for further understanding of the electronic structure, correlation effects, transport and magnetic properties in Ca-doped ruthenates.
We thank S. Gorovikov, C. Gundelach, and H. Hochst for technical support in synchrotron experiments, Z. Fang, A. Liebsch, A. Millis, T.M. Rice, and D. Xi for useful discussions and suggestions. This work is supported by NSF DMR-0072205, NSF DMR-0072998, DOE DE-FG02-99ER45747, Petroleum Research Fund, Sloan Foundation, and the MEXT of Japan. The Synchrotron Radiation Center is supported by NSF DMR-0084402. Oak Ridge National laboratory is managed by UT-Battelle, LLC, for the U.S. Department of Energy under contract DE-AC05-00OR22725.
References
- (1) Y. Maeno et al., Nature 372 532 (1994).
- (2) G. Cao et al., Phys. Rev. B 56 R2916 (1997).
- (3) S. Nakatsuji and Y. Maeno, Phys. Rev. Lett. 84, 2666 (2000).
- (4) V.I. Anisimov et al., Eur. Phys. J. B 25, 191 (2002).
- (5) S. Nakatsuji and Y. Maeno, Phys. Rev. B 62 6458 (2000).
- (6) A. Liebsch, Europhys. Lett. 63, 97 (2003), and Phys. Rev. Lett. 91, 226401 (2003).
- (7) A. Koga et al., cond-mat/0401223 (2004).
- (8) A. Liebsch, cond-mat/0405410 (2004).
- (9) R. Jin et al., cond-mat/0112405 (2001).
- (10) R. Matzdorf et al., Science 289, 746 (2000).
- (11) O. Friedt et al., Phys. Rev. B 63, 174432 (2001).
- (12) T. Oguchi et al., Phys. Rev. B 51, 1385 (1995).
- (13) D.J. Singh et al., Phys. Rev. B 52, 13358 (1995).
- (14) A.P. Mackenzie et al., Phys. Rev. Lett. 76, 3786 (1996).
- (15) A. Damascelli et al., Phys. Rev. Lett. 85, 5194 (2000).
- (16) H. Ding et al., Physica C 364, 594 (2001).
- (17) K.M. Shen et al., Phys. Rev. B 64, 180502 (2001).
- (18) D.F. Agterberg, T.M. Rice, and M. Sigrist, Phys. Rev. Lett. 78, 3374 (1997).
- (19) Z. Fang and K. Terakura, Phys. Rev. B 64, 020509 (2001).
- (20) Z. Fang, N. Nagaosa, and K. Terakura, Phys. Rev. B 69, 045116 (2004).
- (21) A. Gukasov et al., Phys. Rev. Lett. 89, 87202 (2002).
- (22) S. Nakatsuji et al., Phys. Rev. Lett. 90, 137202 (2003).