A universal relationship between magnetization and local structure changes below the ferromagnetic transition in La1-xCaxMnO3; evidence for magnetic dimers.
Abstract
We present extensive X-ray Absorption Fine Structure (XAFS) measurements on La1-xCaxMnO3 as a function of B-field (to 11T) and Ca concentration, (21-45%). These results reveal local structure changes (associated with polaron formation) that depend only on the magnetization for a given sample, irrespective of whether the magnetization is achieved through a decrease in temperature or an applied magnetic field. Furthermore, the relationship between local structure and magnetization depends on the hole doping. A model is proposed in which a filamentary magnetization initially develops via the aggregation of pairs of Mn atoms involving a hole and an electron site. These pairs have little distortion and it is likely that they pre-form at temperatures above Tc.
pacs:
61.10.Ht, 75.47.Lx, 71.38.-k, 75.47.GkIn recent years, the interest in manganites has grown significantly. They belong to a broader class of materials where charge-spin-lattice interactions play a crucial role in the observed properties. An understanding of these interactions in the manganites may provide insight into other strongly correlated electron systems, such as the high-Tc superconductors.
The quasicubic manganites (La1-xCaxMnO3) exhibit colossal magnetoresistance (CMR) for Ca concentrations 0.2-0.5. Within this range, there are significant structural changes as a function of temperature observed at the local atomic level (changes in the Mn-O pair distribution function (PDF)) and macroscopically (magnetostriction). The local distortions are associated with polarons and decrease rapidly through and below the ferromagnetic transition as observed using XAFS XAFS ; Booth98b ; Lanzara98 ; Cao00 and neutron PDF analysis PDF at B = 0T. A tiny B-induced effect at 1T has also been observed Field , but the effect is too small at 1T to explore the field dependence.
Many have argued for phase separation Phase_Sep or two fluid Sarker96 ; Booth98b models formed of conducting, ferromagnetic clusters/regions interspersed with poorly conducting regions. Recently, Ramakrishnan et. al. Ramakrishnan04 have proposed a two band model of coexisting localized Jahn-Teller (JT) polaron and broad band states. The idea of phase separation in these materials is generally accepted; however, the microscopic details of how nanoscale clusters develop into a fully magnetized state is still poorly understood. Here we propose a mechanism in which Mn pairs form filamentary clusters which are interspersed with Jahn-Teller-distorted, non-magnetic regions. This is consistent with Kumar et. al. Kumar98 , who have shown evidence for small clusters above Tc, where the magnetic susceptibility fits a Curie-Weiss law with a Curie constant nearly twice the expected value, suggesting Mn dimers. In addition, recent neutron scattering data Lynn_priv show a glass-like phase with short range order above Tc, which is also consistent with the Mn-dimer model presented here.
Previously, we have shown for a few samples Booth98b ; Downward03 that the decrease in average local distortion, , as T is decreased below Tc, is a simple function of the sample magnetization, M. Here is the width of the Mn-O PDF obtained from EXAFS, and is the T- or B-induced change in . By extending those measurements to high fields (9-11T) for some samples, and to a range of Ca concentrations, , we find that the plots of versus M (each normalized to their value at low T) depend primarily on hole concentration.
We find three important results for each sample: (1) little distortion is removed until the fraction of magnetized sites (M/M0) reaches , where is the hole concentration (2) above , distortions are removed more rapidly as the sample becomes fully magnetized, and (3) the point of change between these two behaviors occurs at . In addition, for the samples measured in an applied B-Field, the above three results hold regardless of field, indicating that the change in local structure depends only on magnetization.

Transmission XAFS Mn K-edge data were collected on powdered samples at the Stanford Synchrotron Radiation Laboratory (SSRL) on beam lines 7-2, 10-2 and 6-2, using a Si(111) monochromator. The sample preparation has been described earlier Booth98b and accurate hole concentrations, , were determined by iodometric titration with an uncertainty of 0.005. For the XAFS samples, the pressed pellets were reground, passed through a 400-mesh sieve, and then brushed onto scotch tape which preferentially holds the smaller grains ( 5 m) in a thin layer. Layers of tape were stacked to obtain a Mn K-edge absorption step height ( for each sample. Generally, four scans were collected at each T (and B-field) for each sample. For the B-field measurements, the field was aligned parallel to the tape layers such that the demagnetization factor is negligible. The magnetization data were collected on long rods with the B-field parallel to the axis; the demagnetization factor for this orientation is also negligible. The upper panel of Fig. 1 displays the magnetization at various magnetic fields for the 30% Ca sample; an applied B-field broadens the curve and shifts it to higher temperature.
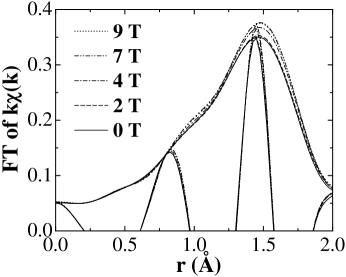
In EXAFS analysis, the absorption from other atoms (pre-edge absorption) is removed first, then a sum of splines is used to obtain the background absorption above the edge Li95b ; Boothweb . Next the XAFS function, , is obtained as a function of photoelectron wave vector from (where ). See Fig. 2 of ref. Booth98b for an example of the data quality. The data are then Fourier transformed (FT) to r-space. An expanded view of the first Mn-O r-space peak for La0.7Ca0.3MnO3 for T near Tc at several fields is plotted in Fig. 1: bottom. As B increases, the amplitude of the Mn-O peak increases; thus the average value of must decrease, as observed (see Fig. 2: bottom). In contrast, for T Tc or T Tc, no significant B-field induced change in is observed. Similar B-field induced changes were observed for the 21% sample for T near Tc. Changes in the Mn-O peak as a function of temperature also correlate with Tc for all samples.
The r-space data were fit Boothweb to similarly transformed standard functions, calculated using the FEFF6 code FEFF6 . We used E0 and S determined in earlier studies Booth98b , constrained the number of neighbors to 6, and fit the first Mn-O peak using an average bond length and a single broadening parameter TwoPeakFit . This method of fitting provides a single-parameter-measure of the local disorder for comparisons with M. For each temperature, separate fits were made to each of four traces and the average value of calculated; the rms fluctuation about the average, gives the relative errors, which are comparable to the symbol size in most cases (See Fig. 2). The absolute error for depends on the errors in S and in the FEFF calculation (both systematic errors), and may be of order 10-15%. This error primarily changes the static component of , and shifts the versus T plot vertically.

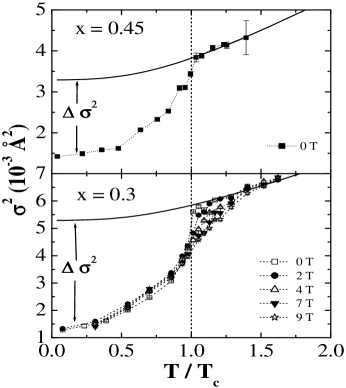
(T/Tc) for the Mn-O peak is plotted in Fig. 2 for 30% and 45% Ca. For the 30% sample, the curves shift to higher T and broaden as B increases, as is also observed in the magnetization measurements (see Fig. 1: top).
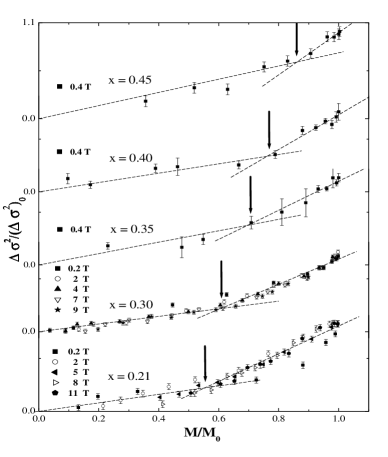
The contributions to (T) add up in quadrature when different broadening mechanisms are uncorrelated, i.e. , where (T) is the contribution from thermal phonons, arises from temperature independent static distortions, and (T) is the contribution from the presence of hopping polarons, at 300K (which we will argue below, are likely hopping “dimerons”). The latter becomes T-independent when M 0 - we refer to this as ; the remaining weak T dependence just above Tc is nearly identical to that for pure CaMnO3 Booth98b and arises from the thermal phonon contributions; the solid line in Fig. 2 is the sum of the phonon and RT-polaron distortion. The difference between this line and the data is (T)) and represents the amount of polaron distortion removed (Fig. 2). Using (T)) and M(T), we can plot the changes in the local distortions as a function of M. In Fig. 3, we show ) versus M, with each normalized to their low-T values. The data follow the same linear relationship, within the errors, irrespective of whether the magnetization was obtained by a change in T or B (for x = 0.3 and 0.21). Thus, for a given sample, the distortion removed is a nearly universal function of M. An important feature of every plot is the low initial slope; little distortion is removed until the sample is more than 50% magnetized. Then (T)) increases rapidly with M - i.e. M and ) are not quite in phase. The breakpoint occurs at M/M0 for each sample (see Fig. 4) LCMO_21 , i.e. twice the number of holes. The breakpoint at and the low slope for M/M0 suggests that the magnetization develops via pairs of Mn sites - a hole and a (distorted) electron site. We propose that such dimer pairs (which we call a dimeron) form at some temperature T∗ Patanjali99 above Tc, which likely corresponds to the temperature at which there is a break in the susceptibility plots. Kumar98
In this dimeron model, an electron must be able to rapidly hop back and forth between two sites for the double exchange mechanism to be operative; this is only feasible for an electron/hole pair. For the Jahn-Teller (JT) distorted site it costs energy EJT to completely undistort the site; consequently, as long as holes are present, the least amount of energy is required when the magnetization develops in electron/hole pairs. The dimeron quasi-particle will also be mobile; the hole changes electron partners as it moves through the sample.
If we let the distortion per JT-site be a constant, , then the maximum average distortion removed per magnetized Mn site (for decreasing T or increasing B-field) is only /2 in the initial stages of magnetization. Once the holes are used up, the distortion removed per Mn site would then increase to . This is qualitatively close to the behavior of the data shown in Fig. 3; however, the ratio of the slopes is closer to 1:4, instead of 1:2, as would be expected from this simple calculation. However for the dimeron, the electron is partially delocalized and the JT-like distortion will be reduced, although not eliminated. As a result, the ratio of the slopes would be larger than 1:2. For example, if the dimeron contains half the total polaron distortion of an electron/hole pair, then the distortion per site would be and the ratio of slopes would be 1:4.
Another explanation for the large change in slope could be a variation in the size of the polaron distortions (different values of EJT) throughout the system, due to strains and local variations in Ca content. The sites with the smallest distortion would then magnetize first. Since EXAFS gives a measure of the average local distortion over all sites, we cannot easily distinguish between these two possible explanations, unless at higher temperatures the dimerons dissociate to form isolated Mn moments Kumar98 with larger J-T polaron distortions. Further experiments are underway to investigate this possibility. Also, as T approaches Tc it is possible that small clusters of dimerons can form - the EXAFS data are not in conflict with such a possibility, they only indicate that equal numbers of electrons and holes (i.e. an integer number of pairs) have aggregated in the magnetic clusters. The EXAFS data, however, are not consistent with a large number of Mn triplets (e.g. two electrons and one hole or two holes and one electron).
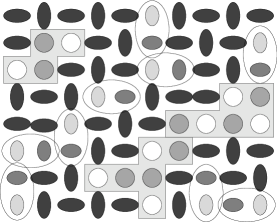
A “cartoon” of this model for T Tc is depicted in Fig. 5. Pairs of partially distorted holes (small light gray ovals) and partially distorted electron Mn sites (small dark gray ovals) are encircled at some instant in time, to represent a dimeron; these are continuously hopping as the hole changes electron partners. Several magnetized clusters are also shown; in each cluster, the dimerons become completely undistorted and lose their identity as the electron becomes much more delocalized (initial electron sites represented by gray circles; initial hole sites by open circles) Mag_cluster . At low M (M/M0 ), the dimerons in the non-magnetic regions are continually hopping and will occasionally diffuse close enough to a magnetic cluster that they can join the cluster. Here the quenched disorder from the positions of the Ca constrains how the magnetization develops, because for charge neutrality, the holes cannot be too far away from Ca sites. Consequently, if the magnetic clusters for M/M are formed from dimeron aggregation, then there will be filaments of the excess JT-distorted electron sites (black ovals) throughout the magnetized regions. Thus, the magnetic cluster development in this regime may be similar to diffusion limited aggregation, with the majority of the magnetic thermal fluctuations occurring in the paramagnetic and boundary regions. It will lead to interpenetrating nanoscale filamentary clusters of magnetic and non-magnetic regions.
In summary, XAFS data as a function of B and T indicate that the decrease in lattice distortion with increasing M is a nearly universal function for each sample. The decrease in distortion is small up to M/M0 , which suggests that the magnetic clusters develop by the aggregation of Mn pairs (electron/hole sites), which we call dimerons. The location of such aggregated dimerons is constrained by the quenched disorder of the Ca distribution, which leads to filamentary magnetic clusters for M/M0 . Increased local distortions should be found at higher temperatures when the dimerons dissociate.
Acknowledgements.
The work at UCSC was supported in part by NSF grant DMR0301971. We thank A. Millis and P Littlewood for helpful discussions. The experiments were performed at SSRL, which is operated by the DOE, Division of Chemical Sciences, and by the NIH, Biomedical Resource Technology Program, Division of Research Resources.References
- (1) C. H. Booth, F. Bridges, G. J. Snyder, and T. H. Geballe, Phys. Rev. B 54, R15606 (1996); T. A. Tyson, J. Mustre de Leon, S. D. Conradson, A. R. Bishop, J. J. Neumeier, H. Röder, and J. Zang, Phys. Rev. B 53, 13985 (1996); G. Subías, J. García, M. G. Proietti, and J. Blasco, Phys. Rev. B 56, 8183 (1997); C. H. Booth, F. Bridges, G. H. Kwei, J. M. Lawrence, A. L. Cornelius, and J. J. Neumeier, Phys. Rev. Lett. 80, 853 (1998).
- (2) C. H. Booth, F. Bridges, G. H. Kwei, J. M. Lawrence, A. L. Cornelius, and J. J. Neumeier, Phys. Rev. B 57, 10440 (1998).
- (3) A. Lanzara, N. L. Saini, M. Brunelli, F. Natoli, A. Bianconi, R. G. Radaelli, and S.-W. Cheong, Phys. Rev. Lett. 81, 878 (1998).
- (4) D. Cao, F. Bridges, D. C. Worledge, C. H. Booth, and T. Geballe, Phys. Rev. B 61, 11373 (2000).
- (5) S. J. L. Billinge, R. G. DiFrancesco, G. H. Kwei, J. J. Neumeier, and J. D. Thompson, Phys. Rev. Lett. 77, 715 (1996); D. Louca, T. Egami, E. L. Brosha, H. Röder, and A. R. Bishop, Phys. Rev. B 56, R8475 (1997); D. Louca, T. Egami, and G. H. Kwei, J. Superconductivity 12, 291 (1999).
- (6) D. Cao, F. Bridges, C. H. Booth, and J. J. Neumeier, Phys. Rev. B 62, 8954 (2000); C. Meneghini, C. Castellano, S. Mobilio, A. Kumar, S. Ray, and D. D. Sarma, J. Phys.: Condens. Matter 14, 1967 (2002).
- (7) E. Dagotto, S. Yunoki, A. L. Malvezzi, A. Moreno, and H. Ju, Phys. Rev. B 58, 6414 (1998); A. Moreo, S. Yunoki, and E. Dagotto, Science 283, 2034 (1999); A. R. Bishop, T. Lookman, A. Saxena, and S. R. Shenoy, Europhys. Lett. 63, 289 (2003); A. Weisse, J. Loos, and H. Fehske, Phys. Rev. B 68, 024402 (2003); Y. Motome, N. Furukawa, and N. Nagaosa, Phys. Rev. Lett. 91, 167204 (2003); J. Burgy, A. Moreo, and E. Dagatto, Phys. Rev. Lett. 92, 097202 (2004).
- (8) S. K. Sarker, J. Phys: Condens. Matter 8, L515 (1996).
- (9) T. V. Ramakrishnan, H. R. Krishnamurthy, S. R. Hassan, and G. V. Pai, Phys. Rev. Lett. 92, 157203 (2004).
- (10) P. S. Kumar, P. A. Joy, and S. K. Date, J. Phys. Condens. Matter 10, L269 (1998).
- (11) J. Lynn, private communication.
- (12) L. Downward, F. Bridges, D. Cao, J. J. Neumeier, and L. Zhou, Inter. J Mod. Phys. 17, 3726 (2003).
- (13) G. G. Li, F. Bridges, and C. H. Booth, Phys. Rev. B 52, 6332 (1995).
- (14) EXAFS data analysis package - http://lise.lbl.gov
- (15) S. I. Zabinsky, J. J. Rehr, A. Ankudinov, R. C. Albers, and M. J. Eller, Phys. Rev. B 52, 2995 (1995).
- (16) Modeling with two Mn-O peaks (ref. Lanzara98 ) requires two amplitudes and two coupled ’s, thus, a single parameter is not available for comparison to the magnetization.
- (17) La0.79Ca0.21MnO3 may deviate since it is close to the metal-insulator boundary. (See Rivadulla et. al., Phys. Rev. B 70, 172410 (2004).) This sample also has a static distortion at low T, and is only 95% magnetized.
- (18) P. V. Patanjali, P. Theule, Z. Zhai, N. Hakim, S. Sridhar, R. Suryanarayanan, M. Apostu, G. Dhalenne, and A. Revcolevschi, Phys. Rev. B 60, 9268 (1999).
- (19) At this point, the electrons in the magnetic cluster are delocalized, but we keep pairs of (undistorted) open and gray circles for counting purposes.