First passage times of pulling-assisted DNA unzipping
Abstract
We investigate the voltage-driven transport of hybridized DNA through membrane channels. As membrane channels are typically too narrow to accommodate hybridized DNA, the dehybridization of the DNA is the critical rate limiting step in the transport process. Using a two-dimensional stochastic model, we show that the dehybridization process proceeds by two distinct mechanisms; thermal denaturation in the limit of low driving voltage, and direct stripping in the high to moderate voltage regime. Additionally, we investigate the effects of introducing non-homologous defects into the DNA strand.
I Introduction
Over the last two decades, the rapid development of single molecule manipulation techniques has produced dramatic advances in chemistry and molecular physics. The fields of DNA biotechnology and nanofabrication in particular, have benefited from these advances. In turn, successes in the field of DNA biotechnology have further motivated the study of DNA manipulation techniques, with a strong focus on studying mechanisms of inducing DNA dehybridization ([9], [5]).
In this study, we consider dehybridizing DNA by pulling DNA molecules through a transmembrane channel. This work is motivated in part by the experimental results of Nakane et al. [11], and Bates el al. [3]. In the experiments of Nakane, a probe DNA that extends 14 base pairs beyond the opening of a trans-membrane channel is used to capture a 14 base pair target strand (see Fig 1). In order to prevent complete passage of the probe DNA through the membrane channel, the probe was attached to an Avidin anchor protein by a 50-base poly-A tail. The target strands used in the experiments were either completely homologous to the probe strand, or had one nonhomologous “defect” base. After the probe strand had captured a target strand, a transmembrane voltage was applied to pull the probe strand through an -hemolysin channel embedded in a lipid membrane. As the -hemolysin channel could only accommodate single-stranded DNA molecules, any target strand hybridized with the probe DNA would need to detach completely before the probe could be fully drawn into the channel. As the transmembrane voltage was applied, the ionic current through the -hemolysin channel was simultaneously monitored. When any part of the probe strand was inside the channel, the channel was blocked, and the ionic current fell below the measurement threshold. When the probe strand was completely pulled through the channel (after the target strand detached), ionic currents resumed and were measured. Thus, in the experiment of Nakane, the distribution of first passage times, , for the escape of the probe DNA from the -hemolysin channel was measured.
In order to understand the first passage times observed in these experiments, we have produced estimates for the thermally averaged mean first passage time using simple two-dimensional and one-dimensional stochastic models. We model the DNA hybridization energetics using both a simple free energy model where each hybridized base contributes an equal amount to the total free energy, and using free energies produced by the MFOLD 2-state hybridization server [17]. Our predicted mean first passage times show the same qualitative features observed by Nakane et al. Under the influence of small transmembrane voltages, the first passage times are found to depend strongly on the presence and energy of defects in the target DNA strand. As the transmembrane voltage is increased, a distinct roll-over in the predicted first passage times is observed, and the first passage times become relatively insensitive to the presence of defects on the target DNA strand. We propose that this roll-over in represents a transition between a thermally-dominated dehybridization mechanism in the low voltage regime, and a driven stripping mechanism in the high voltage regime.
II MODEL
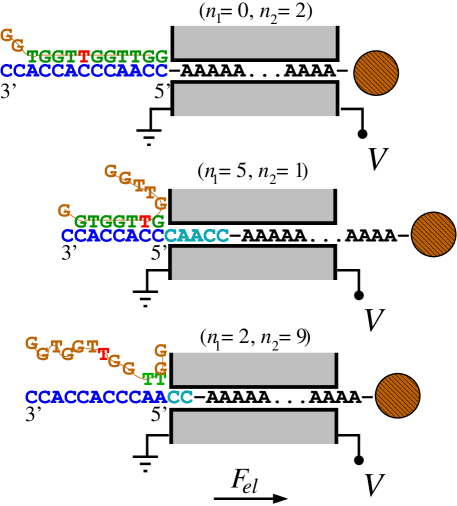
Motivated by the double-stranded DNA unzipping models of Cocco et. al. [5] and Poland and Scheraga [12], we model the process of DNA probe extraction using a two-sided zipper model described in Fig. 1. This model generates distinct partial dehybridization states labeled , were is the number of bases at the end of the probe that are dehybridized and have been pulled into the transmembrane region, and is the number of dehybridized bases at the end of the DNA probe. Using this nomenclature, the DNA probe is fully dehybridized when , and fully extracted only when and . Note that his model neglects the effects of internal dehybridization bubbles, which will be discussed later in this section. Defining to be the probability of being in state at time , given that the system was initially in state , we find the system evolves according to a master equation
| (1) |
In order to produce the elements of the transition matrix, we define the following five transition mechanisms between states :
- Bond Breaking
-
The hydrogen bonds between bases at the end of the probe DNA break, the probe DNA base moves into the transmembrane region, and the state shifts from to . This transition path includes a bond breaking event, immediately followed by translation of the probe DNA, and occurs at rate
(2) Where is the change in free energy between the current state and the target state , and is a phenomenological attempt frequency. We note that we could express as the product of an attempt frequency and a free energy barrier . However for the bond-breaking transition, as well as all other transitions in our model, we pull any dependence on the barrier energy into the effective attempt frequency. As this state transition involves a net translation of a partially charged nucleotide across the membrane, a drop in the interaction energy between the applied electric field and the probe DNA occurs:
(3) where is the mean partial charge of a DNA base.
- Bond Formation
-
In the reverse of the bond breaking transition, the probe DNA translates one base in the direction, and corresponding bases on the probe and the target DNA strands hybridize. This shifts the system from the state to the state, and occurs at rate
(4) - Bond Breaking
-
The hydrogen bonds between two hybridized bases located at the end of the probe break, thus increasing by one. This transition is assumed to occur with rate
(5) - Bond Formation
-
Corresponding dehybridized bases at the end of the probe strand and the end of the target DNA strand form a bond, decreasing by one. This transition is assumed to occur at rate
(6) - Free Translation
-
In the case where the DNA probe is completely dehybridized , but not fully extracted , the DNA probe will translate under the influence of the applied potential. The translation changes the state from to or and occurs with rate
(7) The two rates and describe translation in the and directions respectively. The only significant difference between and is the sign of the change in the interaction energy between the probe DNA and the applied electric field. In the case of translation , while in the case of translation .
Having defined the possible transitions in the model, we are left with five unknown attempt frequencies , and an unknown value for the mean partial charge per DNA base . Based on the results of Nakane, we set [11], were is the electron charge. Since free translation and bond breaking both involve sliding of the probe DNA strand, the time scale for these transitions is set approximately by the time scale for translation of the single-stranded probe DNA. To find this time scale, we built a simplified model of single-stranded DNA translation consisting of only the free translation moves described above. Using this model, we simulated the complete passage of a 60-base single-stranded DNA segment through a channel 30 DNA bases in length. We then compared the mean first passage time for complete transit of single-stranded DNA computed from this model, with the experimental results of Bates et al [3] for DNA transport through -hemolysin channels at low voltages ( at 20mV, at 40mV). The best match between the computed and experimental results occurred when the attempt frequency was approximately . To determine a value for , we followed Cocco et al. [5] and set to equal the inverse self diffusion time for a single nucleotide (). With rough order of magnitude estimates for and we then tuned the parameters of our model to give a reasonable match to the experimental data of Nakane [11] for the variation of escape time with voltage. After hand tuning, the parameters were , , , , and .
While easy to analyze, our model fails to capture a number of aspects of the denaturation and extraction process. For example, by assuming the short probe-target DNA complex denatures only from the ends, we have ignored the effects of bubble formation. By bubbles we refer to dehybridized regions of DNA that are bounded by at least one hybridized base on both sides. While clearly an approximation, we do not believe that bubble formation will qualitatively affect the process of driven DNA hybridization described here. Under physiologic conditions, structural fluctuations in double stranded DNA lead to the formation of bubbles that are typically on the order of several tens of base pairs [8]. In this paper we consider the dehybridization and extraction of DNA strands only 10-20 bases in length, and thus considerably smaller than the typical bubble size found in DNA at physiologic conditions. Additionally, recent experiments [2] have studied the formation of bubbles in small, atypically bubble-prone, poly-AT DNA chains approximately bases in length. Here, the formation of DNA bubbles approximately bases in length were observed in the DNA strand. However, through fluorescence-correlation spectroscopy Altan-Bonnet [2] were able to measure the typical lifetime of these small bubbles to be approximately 50. This lifetime is typically much smaller than the mean time for the dehybridization and extraction of small DNA strands through -hemolysin at moderate driving voltages.
Additionally we do not model partial-registry binding, where the target DNA binds to the probe DNA with an offset so that the target DNA “over-hangs” the probe. If we assume that the target-probe DNA complex is well equilibrated prior to the start of the extraction processes, then such out of registry binding is unlikely due to its high energetic cost. Moreover, should such binding occur, its effects on the DNA dehybridization process would not be qualitatively different from the effects of starting in a state with a similar number of unhybridized bases.
Finally, we do not model the full extraction of the probe DNA (i.e., full removal from the -hemolysin channel). As re-binding of the target DNA is unlikely once the probe is fully drawn into the channel (typical target concentrations are 10M [11]), complete removal of the probe DNA depends primarily on the details of the DNA-channel interactions. Previous studies [3], have shown that translation of single-stranded DNA 60 bases in length under moderate driving (0.04V) in an -hemolysin channel occurs on a time scale of 500s. Rather than model the interactions between the probe DNA and channel, we can simply add to the first passage times for probe escape we compute using our model. As we shall see, at low to moderate membrane voltages this additional time is small compared to the time required to denature the probe DNA.
III RESULTS AND DISCUSSION
We use Eqn 1 to compute the thermally averaged time for the DNA probe to first reach the fully extracted state . To do this, we make the state completely absorbing, and slightly modify Eqn 1 by setting for all :
| (8) |
Note that the first term in Eqn 8 does not include contributions from transitions out of state while the second term does include transitions into state . Upon defining to be the probability that the system reaches the absorbing state between time and time , given that it started in state we find
| (9) |
With computed from the solution to Eqn 8, we can determine the mean first passage time to the extracted state
| (10) |
Finally, to find the thermally averaged mean first passage time, , we sum the results of Eqn 10 over all possible initial states of the probe DNA,
| (11) |
where is the free energy of state relative to the free energy of the completely dehybridized system. The validity of Eqn 11 is contingent on the assumption of local thermal equilibrium between the probe and the fluid bath. However, as the probe is typically maintained in the inserted state for several tenths of a second prior to removal [11], we expect this assumption to hold to reasonable accuracy.
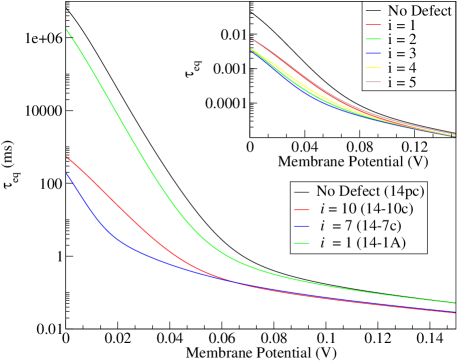
To investigate how nonhomologous defects influence the mean first passage time, we first analyze the process of DNA extraction using a simple model where each non-defective hybridized base pair lowered the free energy of the probe-target complex by a constant amount. A single defective base pair with a binding free-energy lower than all other bases was then introduced into the target strand. As an example, we considered a short strand of eleven bases, and used the double zipper model to generate the mean escape time curves displayed in the inset of Fig 2. There are two features worth noting; the mean escape time clearly depends on the location of a defective base as well as the energy of the defect, and the position and energy of the defect influence the escape time less as the applied voltage is increased. At first glance the dependence of the escape time on defect location appears counter-intuitive given that the defect energy did not vary with the location of the defect along the target strand. Nonetheless, the behavior displayed in Fig. 2 where a defect placed in the center of the DNA strand produces maximal reduction in mean escape time, is extremely general and rather insensitive to changes in the parameter values of the model.
To understand the source of this effect, consider a DNA chain with a defect at position , when the DNA chain is in the or state with . If the defect is at site , the probability of the adjacent DNA base rehybridizing goes as . Here is the rate at which the defect base dehybridizes, and is the rate of rehybridization of the base adjacent to the defect. The effect of introducing a defect is to increase while keeping constant, reducing the likelihood of hybridization of the adjacent base. In the case where the defect results in particularly weak binding, the increase in can be quite large, making it highly unlikely that DNA will rehybridize beyond the defect base once the defect itself has dehybridized. This shortens the effective length of the DNA by sites.
We note however that introducing bubbles into the model would minimize the variation in escape time with defect position. In the presence of bubbles, bases well separated from the defect could rehybridize without the defect base itself rehybridizing. This would dramatically reduce the variation in the mean escape time associated with the defect position. Nonetheless, the mean escape time of GC-rich strands which are relatively resistant to bubble formation may still be sensitive to the position of defects in the target strand.
| Name | Sequence | Energy |
|---|---|---|
| 14pc | -GGTGGTTGGTTTGGTT- | |
| 1A | -GGTGGTTGGTTTGGTA- | |
| 10C | -GGTGCTTGGTTTGGTT- | |
| 7C | -GGTGGTTCGTTTGGTT- |
Turning to a more realistic free energy model, we used the the MFOLD 2-state hybridization server [17] to generate free energy surfaces for four distinct probe sequences, each 14 bases in length [11] (see Table 1). The form of the lifetime verses voltage behavior produced by Eqn 11 for these sequences is displayed in Fig. 2. The four voltage response curves clearly separate into two groups; the 14pc sequence (perfectly complementary to the DNA probe) and the 1A sequence (with a single non-complementary base at the end of the sequence) belong to a long lived set, while the 7C and 10C sequences (both with a single non-complimentary base in the center of the sequence) form a group with a dramatically shorter lifetime. We note that the approximately four orders of magnitude difference between the defect-free and 1A escape times and the 7C and 10C escape times at zero voltage, is consistent with the free energy differences between the various probes. From the standpoint of potential applications to DNA sequencing, the reduction in free energy produced by a defective base is clearly the dominant influence on the mean escape time.
Returning to the DNA sequences used to produce Fig 2, we investigated the consequences on the mean probe lifetime of varying the detachment rate, and found that this rate has a significantly greater influence on the mean escape time in the low voltage regime than in the high voltage regime. This leads us to propose that the field-induced dehybridization can occur through one of two mechanisms. In the low voltage regime, thermal denaturation of the target DNA from the probe is the dominant mode of separation. In this region of the lifetime-voltage curve, thermally-induced dehybridization from the end is at least as significant as voltage driven-bond stripping at the end. As the applied voltage is increased, the system enters a transition region where voltage-driven bond stripping becomes the statistically favored mechanism of detachment. Finally, in the high voltage region stripping becomes the primary means of separation.
To confirm this hypothesis, we find the probability that base (measured from the end of the probe DNA), is the last base to dehybridize prior to extraction of the DNA probe. We first define to be the probability density that the last dehybridization event occurs at base between time and . Making use of the solution to Eqn 1, can be expressed as
| (12) |
Here is the probability the probe DNA is fully drawn into the channel by time given that it was fully dehybridized (i.e., in state ) at time , assuming that no rehybridization events occur between and . Rates and are defined by Eqns 2 and 5 respectively.
Since the probabilities produced by Eqn 1 contain contributions from paths through the state space that include rehybridization events, we cannot use the solution to Eqn 1 to compute . However we can compute by considering the master equation governing the transitions between fully dehybridized states . Defining to be the probability of being in the state at time , given that the system was in state at time , we have
| (13) |
In Eqn 13 there are two distinct sets of absorbing states; the first set contains only the fully extracted state , the second set contains the states with only one hybridized base . As we are seeking the probability of reaching the fully extracted state without having any base rehybridize, we are only concerned with the absorbing state. The probability distribution for escape from the set of fully dehybridized states to the fully extracted state is . Then is
| (14) |
| (15) |
Note that in the limit of low target DNA concentrations, once the probe and target DNA have completely dehybridized, rehybridization is unlikely during the time required to extract the probe DNA. Thus, in the case of low target concentrations, the integral and Eqn 15 yields . With , we can compute the probability, , that the last base to dehybridize is base from the expression . The thermally averaged probability that base is the last to dehybridize is computed from
| (16) |
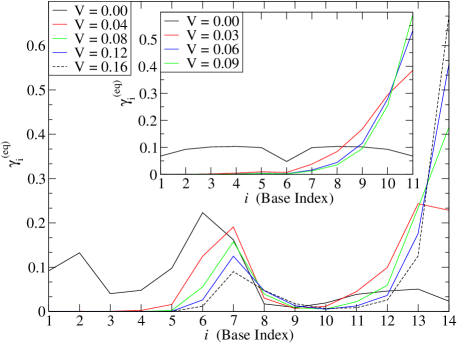
Referring to the inset in Fig 3, we see that using the simple free energy model where each hybridized base lowers the free energy of the system by produces a that is symmetric about the mid-point of the DNA lattice. This is exactly what is expected in the case where all the attempt frequencies in the model are equal and thermal denaturation dominates the dehybridization process. As the voltage increases, the behavior of is also predictable, with the bases at the end of probe DNA becoming more likely to be the last to separate. This is consistent with a voltage-driven denaturation mechanism where stripping of the target DNA occurs. Using the MFOLD free-energies for the 10c DNA segment, we see a similar effect where the free energy surface dominates the last bond-probability at low voltages. At higher voltages the effects of the free energy surface are obscured and a stripping mechanism dominates. This is consistent with Fig 2, where we see that the mean first passage times are most strongly influenced by sequence defects in the low voltage limit.
This transition between a thermally dominated denaturation mechanism and a direct stripping mechanism can explain the decreased influence of defects on the mean extraction time at high membrane voltages. To demonstrate this, we consider the one-dimensional reduction of the two-dimensional model of DNA dehybridization already presented. Retaining only the hybridization transitions, the Master equation for the one-dimensional model is
| (17) |
The one-dimensional model of DNA denaturation described by Eqn 17 is equivalent to a one dimensional random walk with a reflecting boundary at and an absorbing boundary at . The first passage time for extraction into the transmembrane channel is then [13]
| (18) |
and the thermally averaged escape time is
| (19) |
To make contact with the two dimensional model, we take the high voltage limit of Eqn LABEL:FPRW1. Note that in the high voltage limit we expect the extraction times predicted by the one and two dimensional models to agree to high accuracy. Additionally, we focus on as this is by far the dominant term in Eqn 19. In the limit of high voltage and
| (20) |
Here . Eqn 20 shows that in the high voltage limit, the mean extraction time is closely approximated by the time required to independently dehybridize DNA bases without significant rehybridization occuring. In this limit, a defect only influences the extraction process once, when the defect base pair is first dehybridized. Conversely, if we consider the zero voltage limit, Eqn LABEL:FPRW1 yields
| (21) |
where the second term includes contributions from rehybridization events. The effect of a defect is to reduce the ratio , and thus at low voltages a defect accelerates the extraction process each time the defect base pair is denatured. At low voltages the base pair is typically denatured multiple times prior to probe exaction, and hence defects have a more pronounced effect on the mean extraction time at low voltages than they do at higher voltages. We also note that the magnitude of Eqn 21 depends strongly on the position of the defect in the DNA sequence. As was the case in the two-dimensional model, the mean extraction time predicted by the one-dimensional model is a minimum when the defect is located in the middle of the target strand. As before, we ascribe this position dependence to a defect’s ability to reduce the likelihood of rehybridization past the defect base pair, thus shortening the effective length of the probe-target complex.
IV CONCLUSION
We have shown that the dehybridization process critical for the voltage-driven transport of DNA through membrane channels can proceed through two distinct mechanisms. In the low voltage regime, thermal dehybridization is the dominant mechanism and the details of the hybridized DNA’s free energy surface set the time scale for transport. In the moderate to high voltage regime, direct stripping of the complementary DNA off the probe DNA is the dominant dehybridization mechanism. Driven primarily by the applied voltage, this dehybridization mechanism is comparatively insensitive to the shape of the hybridized DNA’s free energy surface. This behavior may have implications for the use of DNA sequencing devices based on nanopores. Specifically, an attempt to increase the sequencing rate by increasing the voltage driving the double stranded DNA through the nanopore, may obscure the distinction between different DNA sequences. This may limit the maximum rate at which sequencing can be performed.
GL and GNP acknowledge financial support from the Natural Science and Engineering Research Council of Canada. GL and TC acknowledge support from the National Science Foundation through grant DMS-0206733, and the National Institutes of Health through grant K25 AI058672. The authors thank Andre Marziali, John Nakane, and Matthew Wiggin for valuable comments on the manuscript.
References
- Alberts et al. [1994] B. Alberts, D. Bray, J. Lewis, M. Raff, K. Roberts and J. D. Watson, Molecular biology of the cell, (Garland Publishing, New York, 1994).
- Altan-Bonnet el al. [2003] G. Altan-Bonnet, A. Libchaber, O. Krichevsky, Phys. Rev. Lett. 90:138101
- Bates et al. [2003] M. Bates, M. Burns, A. Meller Biophys. J. 84:2366-72
- Bhattacharjee & Marenduzzo [2002] S. M. Bhattacharjee, D. Marenduzzo, J. Phys. A. 35:L349-L356
- Cocco et al. [2003] S. Cocco, J. F. Marko, R. Monasson, 2003, Euro. Phys. E 10:153
- Evans [2001] E. Evans, 2001, Ann. Rev. Biophys. Biomol. Struct. 30:105-28
- Gardiner [1986] C. W. Gardiner, Handbook of Stochastic Methods: For Physics, Chemistry, and the Natural Sciences, (Springer-Verlag, New York, 1986).
- Hanke & Metzler [2003] A. Hanke and R. Metzler, J. Phys. A, 36:L473-L480
- Lubensky & Nelson [2002] D. K. Lubensky, D. R. Nelson, 2002, Phys. Rev. E 65:031917
- Meller et al. [2001] A. Meller, L. Nivon, D. Branton Phys. Rev. Lett. 86:3435-3438
- Nakane [2004] J. Nakane, M. Wiggin, A. Marziali, Unpublished data
- Poland & Scheraga [1970] D. Poland, H. A. Scheraga Theory of Helix-Coil Transitions (Academic Press, 1970)
- [13] P. A. Pury, M. O. Cáceres, 2003, J. Phys. A. 36:2695-2706
- Reichl [1998] L. E. Reichl A Modern Course in Statistical Physics, Second Edition, (John Wiley & Sons, New York, 1998)
- SantaLucia [1998] J. SantaLucia, 1998, Proc. Natl. Acad. Sci. 95:1460-1465
- Slutsky et al. [2003] M. Slutksy, M. Kardar, L. A. Mirny, 2003, q-bio/0310008
- Zuker [2003] M. Zuker, Nucleic. Acids. Res. 31:3406-15