Elastic anomalies in HoNi2B2C single crystals
Abstract
We have measured temperature and magnetic field dependencies of the sound velocities and the sound attenuation in HoNi2B2C single crystals. The main result is a huge softening the velocity of mode due to a cooperative Jahn-Teller effect, resulting in a tetragonal-orthorhombic structural phase transition. Anomalies in the behavior of the mode through various magnetic phase transitions permit us to revise the low temperature H–T phase diagrams of this compound.
pacs:
62.20.Dc, 64.70.Kb, 71.70EjHolmium borocarbide HoNi2B2C is one of the most interesting members of the rare earth borocarbide family. The list of phenomena that have been found in this compound at low temperatures contains many of the mainstream research issues of solid state physics. Among them are the coexistence of superconductivity and magnetism, occurrence of multiple magnetic phases, including incommensurate spiral structures, and reentrant superconductivity (see muller for a review). In this paper we uncover one more facet of complexity of HoNi2B2C: the presence of strong Jahn–Teller interactions.
Over the past decade almost all of the available arsenal of experimental tools has been used in the studies of borocarbides. However it seems that ultrasound methods did not receive the proper attention, and as a result the acoustic properties of these compounds are mostly “terra incognito” at present. In this work we have performed acoustic investigation of HoNi2B2C single crystals and obtained valuable data that are complementary t o the known results. In particular, we have discovered a considerable softening of the elastic modulus that starts at temperatures as high as 100K. This is indicative of the strong Jahn–Teller interaction present in this compound. This interaction is the driving force of the tetragonal–orthorhombic structural phase transition dist-neurt . The magnetic phase transitions are accompanied by elastic anomalies which are most pronounced for the mode. By analyzing these features we were able to construct the H-T phase diagrams that added a few details to the existing phase diagrams (see for example specific-heat ).
Single crystals of HoNi2B2C were produced using the method described previously crystal-grows . Samples had the shape of plates of 0.2 mm thickness. The c axis of the crystal was oriented perpendicular to the surface of the plate. The technique of working with submillimeter samples and the method of phase measurements are presented elsewhere ulta-sound-exp . The characteristic feature of the method is the utilization of an electronically controlled phase shifter with a dynamical range that is practically unlimited. This, along with the use of a digital phase measuring device, allows to keep a very high resolution for large changes in the sound velocity. While the behavior of all pure modes of the crystal have been studied, we devote this paper mainly to the analysis of the most informative mode. The anomalies of the sound velocity of the mode are also briefly discussed at the end.
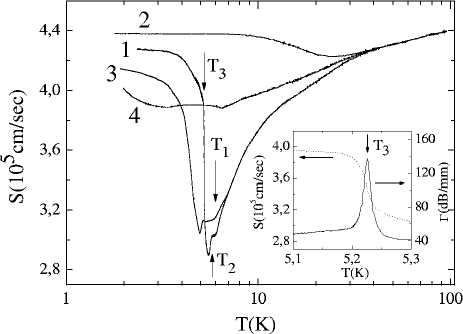
Shown in Fig. 1 are the temperature dependences of the sound velocity, , of the mode both in the absence of an external magnetic field and when the field is oriented along main crystal directions. For (curve 1) exhibits a considerable, about 35%, softening that starts showing up long before the onset of magnetic ordering found at by neutron diffraction experiments dist-neurt ; neut-mag-order . At there is a return to a stiffer state marked by a jump in . If a magnetic field of is applied in the basal plane (curves 2 and 4) the magnitude of the softening is strongly reduced, though not eliminated completely. On the other hand, is affected very little if the field is applied along the axis (curve 3).
A wide temperature interval in which a softening of elastic constants takes place is the fingerprint of the Jahn–Teller interaction luthi1 . The elastic constant of the lattice itself (background elastic constant ) increases very slowly with decreasing temperature. Much stronger temperature dependence comes from partially filled inner electronic shells of rare earth ions. For HoNi2B2C the crystal field splitting of the lowest J–multiplet of ion is about 200K cristal-field , which explains why we do not see the pure background elasticity even at the highest temperatures used in our experiments (about 100K). The localized electronic degrees of freedom are coupled to an extended degrees of freedom associated with the lattice. The elastic modulus of interest can be calculated as follows (see, for example luthi1 ):
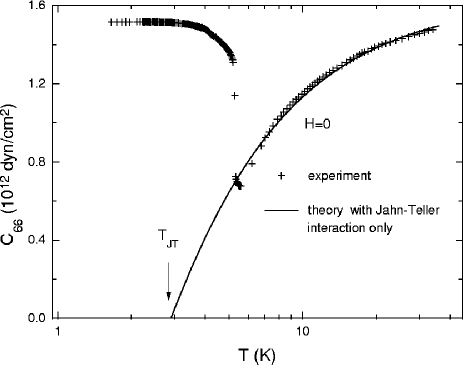
where is the unit cell volume and are the eigenvalues of the single ion Hamiltonian which operates within the lowest multiplet of ion with J=8. The the crystal field Hamiltonian has the form standard for tetragonal symmetry with the parameters determined by Gasser et al. cristal-field The magnetic-ion–lattice (Jahn–Teller) interaction is taken in the simplest form , where is the relevant component of the strain tensor and is the lowest order electronic quadrupole operator to which this strain couples by symmetry. Both , assumed temperature independent, and the unknown coupling constant were determined from a fitting procedure in the temperature range where the system is paramagnetic. In Fig. 2 we show and the best fit (solid line), which corresponds to meV/ion and dyn/cm2, along with the experimental points (crosses) for . The agreement is quite good. The steep increase of at is due to interactions with magnetic degrees of freedom, which we do not attempt to account for in this work.
The next conclusion is that Jahn–Teller interaction is in fact quite strong. If there were no other interactions in the system the crystal lattice would become unstable at about as indicated by the vanishing of the calculated (see Fig. 2). Therefore, the Jahn–Teller interaction is the driving force of the structural phase transition from the tetragonal to orthorhombic phase that most probably takes place simultaneously with the stabilization of collinear antiferromagnetic ordering at . Orthorhombic distortions of the crystal lattice have been observed previously at about 2K dist-neurt and were associated with the magnetostriction.
Neither the sound velocity nor the sound attenuation, , develop any visible anomalies at the superconducting phase transition ( muller ) in our experiments. At the same time magnetic phase transformations can be detected quite easily with the behavior of the mode. The typical shapes of the anomalies in the sound velocity and the sound attenuation are clearly seen in Fig. 1. The characteristic features are different for different phase transformations. For the sound velocity there is a change in the slope (jump in the derivative) at temperatures , while at there is a jump-like decrease and at there is a jump-like increase. Usually, these kinds of anomalies in the sound velocity are accompanied by an increase of the sound attenuation, which can be quite large in some cases (for example at , see the insert in Fig. 1). In principle, by the type of anomaly one can determine the nature of the corresponding phase transformation. For instance, the change in slope of the sound velocity at corresponds to a second order phase transition of the improper segnetoelastic type.
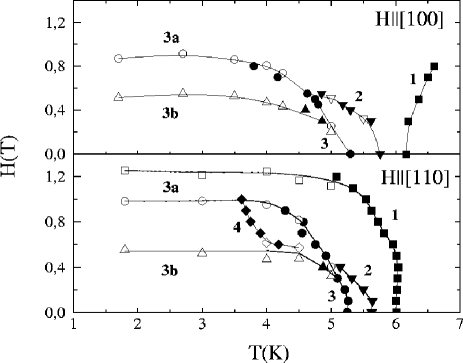
Leaving such an analysis for a future publication we present in Fig. 3 the obtained phase diagrams for (top panel) and (bottom panel). Note that we used two types of measurements: temperature sweeps with fixed magnetic field and field sweeps with fixed temperature. In all cases the external parameter was kept increasing during sets of sweeps.
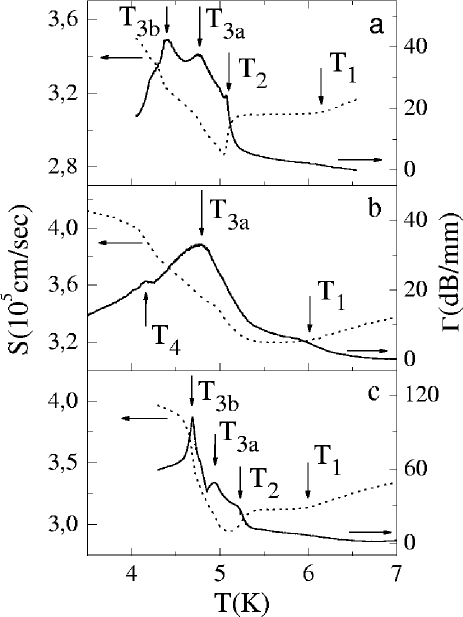
Let us discuss the case of (see Fig. 3, top panel) in more detail. At the temperatures of the magnetic phase transitions practically coincide with those found in the literature muller . The location of line 1 is close to that of the other published data as well. Line 3 represents the position of a jump-like increase of the sound velocity, which is steep at but smears considerably as grows. The attenuation always goes through a maximum on line 3 (see insert on Fig. 1). At line 3 splits forming a critical point. Shown in Fig. 4a are the and curves at where the splitting of the line 3 is obvious. In the literature lines 3 and 3b are associated with the boundary of a commensurate antiferromagnetic phase. Both line 3a and line 3b represent an increase of the sound velocity in the form of a smeared step. They are possibly better detected as peaks in the attenuation (see Fig. 4a, right vertical axis). Although it is in principle possible that lines 3b and 3b stay separate from each other as the magnetic field decreases all the way down to zero, we were not able to observe any indications of such behavior. Line 3 is not split as within the accuracy of our experiments (see insert in Fig. 1).
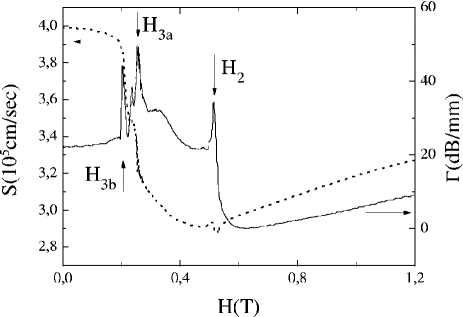
The anomaly represented by line 2 is a step-like decrease of the sound velocity. At line 2 approaches line 3a as field increases, but disappears further on. Over some range of magnetic fields line 2 coexists with lines 3a and 3b (see Fig. 3, top panel). This is demonstrated in Fig 4a where all three peaks in the attenuation are clearly distinguishable. The simultaneous presence of all these three anomalies can also be observed on an appropriate vertical cut of the plane in the top panel of Fig. 3. The magnetic field dependence of and at shown in Fig 5, confirms the coexistence of lines 2, 3a and 3b unambiguously.
In general, similar systematics holds true for as well (see Fig. 3, bottom panel). However, in the fields larger than the value at which lines 2 and 3a merge one can see a new feature on and curves (look up in Fig. 4b). This suggests the existence of one more line, line 4 in the bottom panel of Fig. 3, which could in fact be a continuation of line 2.
For the phase diagram essentially coincides with the one published in the literature muller . We do not present it again in this paper, but comment that in high fields line 3 is possibly split as well. Indeed, in fields as high as 3T (see Fig. 4c), we can readily define and on the attenuation temperature dependence curve, .
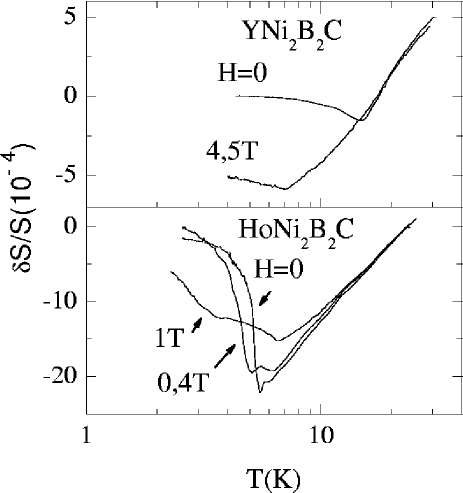
Fig. 6 shows the temperature dependences of the velocity of the mode in both Ho and Y borocarbides that also exhibits slight softening. Notice that the magnitude of the effect for this mode is three orders of magnitude smaller than for the mode in the Ho compound (see Fig. 1). The ions in the other compound have all electronic shells completely filled, and therefore do not couple to the lattice by means of the mechanism discussed above. A softening of the mode velocity in YNi2B2C for has been observed recently by Isida et al isida who associated it with the presence of a nesting feature of the Fermi surface.
Such anomalies have attracted a lot of attention in the 1970s in connection with superconductors of the A-15 crystal structure as a possible source of low temperature structural transformations testardi . The theory gorkov predicts a logarithmic dependence of the active elastic modulus on temperature (for a given geometry). This is satisfied reasonably well for both compounds (see Fig. 6), providing the evidence of a measurable coupling of itinerant electrons to the lattice. In borocarbides this coupling is much weaker than in A-15 compounds, which could be due to a smaller contribution of 1D bands to the electronic spectrum.
Apart from a similar temperature dependence in the range of temperatures where softening takes place, the behavior of the elastic modulus in Y and Ho borocarbides with further decrease of temperature is very different. In the former compound the lattice softening stops upon stabilization of the superconducting phase, including the mixed state in magnetic fields (Fig. 6, top panel). In the latter compound the lattice starts growing stiffer only after magnetic ordering occurs while the onset of superconductivity does not produce any visible effect.
In summary, we demonstrated the presence of a Jahn–Teller interaction in HoNi2B2C which is sufficiently strong to make the high temperature tetragonal crystal structure unstable (a cooperative Jahn–Teller effect). The details of phase diagram were clarified. We presented evidence in favor of the existence of critical points where several phase transition lines merge or perhaps intersect.
This study was supported in part by CRDF Foundation (Grant UP1-2566-KN-03). The work of AK was supported by the Natural Science and Engineering Research Council of Canada (NSERC) and the Canadian Institute for Advanced Research (CIAR).
References
- (1) K.H. Muller, G. Fuchs, S.L. Drechsler, V.N. Narozhnyi, in Handbook of Magnetic Materials, edited by K.H.J. Buschov (Elsevier Science, Amsterdam, 2002), vol. 14, ch. 3.
- (2) A. Kreyssig, M. Loewenhaupt, J. Freudenberger, K.H. Muller, C. Ritter, J. of Appl. Phys. 85, 6058, (1999).
- (3) T. Park, M.B. Salamon, E.M. Choi, H.J. Kim, and S.-I. Lee, Phys. Rev. B69, 054505 (2004)[cond-mat/0307041].
- (4) M.O. Mun, S.I. Lee, W.C. Lee, P.C. Canfield, B.K. Cho, D.C. Johnston, Phys. Rev. Lett. 76, 2790, (1996).
- (5) E.A. Masalitin, V.D. Fil, K.R. Zhekov, A.N. Zholobenko, T.V. Ignatova, S.-I. Lee, Low Temp. Phys. 29, 72, (2003)[cond-mat/0301183].
- (6) J.W. Lynn, S. Skanthakumar, Q. Huang, S.K. Sinha, Z. Hossain, L.C. Gupta, R. Nagarajan, C. Godart, Phys. Rev. B 55, 6584 (1997).
- (7) M.E. Mullen, B. Luthi, P.S. Wang, E. Bucher, L.D. Longinotti, J.P. Maita, and H.R. Ott, Phys. Rev. B10, 186 (1974).
- (8) U. Gasser, P. Allenspach, F. Fauth, W. Henggeler, J. Mesot, A. Furrer, S. Rosenkranz, P. Vorderwisch, and M. Buchgeister, Z. Phys. B101, 345 (1996).
- (9) S. Isida, A. Matsushita, H. Takeya and M. Suzuki, Physica C 349, 150 (2001).
- (10) L.R. Testardi, in Physical Acoustics, edited by W.P. Mason and R.N. Thurston (Academic Press, New York, 1973), vol. X, p. 193.
- (11) L.P. Gorkov and O.N. Dorokhov, J. Low. Temp. Phys. 22, 1 (1976).