Structural transition in NaxCoO2 with near 0.75 due to Na rearrangement
Abstract
We report neutron powder diffraction measurements on a series of NaxCoO2 samples with near 0.75 which were prepared under different synthesis conditions. Two different crystal structures for the samples are observed at room temperature. The two structures differ primarily by a shift of a large fraction of the Na ions from a high-symmetry position to a lower-symmetry position. Close inspection of the refinement parameters indicates that the presence of either structure depends sensitively on the Na content , with as the critical concentration separating the two phases. By raising the temperature to around K, the high-symmetry structure can be converted to the lower-symmetry structure. The transition is reversible, but there is significant hysteresis. We discuss the effects of this structural transition on the bulk magnetic and transport properties.
pacs:
74.72.Dn, 74.40.+k, 75.30.Fv, 75.10.Jm, 75.50.EeI Introduction
The layered cobaltate NaxCoO2 has generated much recent interest as a correlated electron material with unusual electronic properties. The structure of this compound consists of layers of Co atoms, within an octahedral environment of oxygen atoms, arranged on a triangular lattice. The Na atoms form layers in between the CoO2 layers, and the Na stoichiometry can vary from to 0.85. This family of materials has attracted much recent interest due to the discovery of superconductivity below 4.5 K in hydrated Na0.3CoO2 H2O.Takada et al. (2003) The composition with shows an unusually strong thermoelectric effect and has Curie-Weiss magnetism coexisting with metallic behavior.Ray et al. (1999); Chou et al. (2004a) The electronic phase diagram of non-hydrated NaxCoO2 is rich, with two metallic phases existing for and which are separated by a charge-ordered insulator at .Foo et al. (2003); Zandbergen et al. (2004) It is clear that the properties of NaxCoO2 can be strongly affected by the mobility of the Na ions, which leads, for example, to the formation of a Na superlattice at .Foo et al. (2003); Huang et al. (2004a) In order to further understand the electronic and magnetic properties of NaxCoO2, it is helpful to first understand the details of the crystal structure.
In this paper we present neutron powder diffraction measurements of samples of NaxCoO2 with near 0.75. We find that there exist two distinct structures in this region of the phase diagram. These structures differ from each other by the arrangement of the Na ions. In addition, we find that the Na arrangement depends sensitively on the temperature and doping level . These results are important because they demonstrate that samples of nominally the same composition, , may have different physical properties. Recently, Sales and coworkers have found evidence for a transition around 340 K using scanning calorimetry, magnetization and transport measurements.Sales et al. (2004) They attributed this behavior to a possible structural transition involving Na ordering. Our powder neutron diffraction measurements directly reveal how the crystal structure changes. We present results from a systematic study involving neutron diffraction, resistivity measurements, and susceptibility measurements on both single crystal and powder samples annealed under various conditions.
II EXPERIMENTAL
Powder samples of NaxCoO2 were prepared using a solid-state reaction technique. A mixture of 0.75 Na2CO3 + 2/3 Co3O4 was used as the starting material. The material was reacted at elevated temperatures (C and C) in air with repeated grindings over 12 hours cycles until single phase Na0.75CoO2 was achieved, as verified with x-ray diffraction. The single crystal samples were grown via the travelling solvent floating-zone method as described previously.Chou et al. (2004b) In this paper, we have examined the structure of four different samples: (i) a crushed single crystal labelled CC, (ii) an as-prepared powder which was quenched in air from C labelled P-900, (iii) an as-prepared powder quenched in air from C labelled P-750, and (iv) a powder sample labelled P-anneal which was annealed in a flowing oxygen atmosphere while slowly cooled between from to C at a rate of C/min. The samples’ histories are summarized in Table 1. All four samples originated from different batches and therefore have slight variations in stoichiometry near 0.75.
| name | batch# | sample form | reaction atm. | highest reaction temp. | cooling |
|---|---|---|---|---|---|
| CC | crushed crystal | oxygen | C | quenched | |
| P-900 | powder | air | C | quenched | |
| P-750 | powder | air | C | quenched | |
| P-anneal | powder | air+O2 annealed | C | slow cooled to C |
The neutron powder diffraction data of these samples were collected using the BT-1 high-resolution powder diffractometer at the NIST Center for Neutron Research, employing a Cu (311) monochromator crystal to produce a beam of monochromatic neutrons with wavelength Å. Collimators with horizontal angular divergences of , and were used before and after the monochromator, and after the sample, respectively. The scattered intensities were measured as a function of 2 in steps of 0.05∘ in the range . The structural parameters were refined using the GSAS program.Larson and Von Dreele (1994) The neutron scattering lengths used in the refinements were 0.363, 0.253, and 0.581 ( cm) for Na, Co, and O, respectively.
Magnetization measurements were performed using a SQUID magnetometer (Quantum Design MPMS-XL). The resistivity of a single crystal sample was measured using the standard 4-probe technique. Electrical contacts were attached to the surface of the sample with silver epoxy and measurements were performed from 5 K to 350 K in applied fields of 0 Tesla and 14 Tesla using a Physical Property Measurement System (Quantum Design).
III RESULTS
We first present our results on the structural properties of our samples which all have the same nominal Na concentration near . The structure of NaxCoO2 consists of layers of edge-sharing CoO6 octahedra, where the Co atoms form a triangular lattice. For the hexagonal unit cell, the lattice constants are and Å. The Na ions occupy planes which lie in between the CoO2 layers. Previous measurementsLynn et al. (2003); Jorgensen et al. (2003) have revealed two crystallographically distinct sites which the Na ions occupy in the lattice, Na(1) and Na(2). The relative population of these sites varies from sample to sample and depends strongly on the Na concentration .
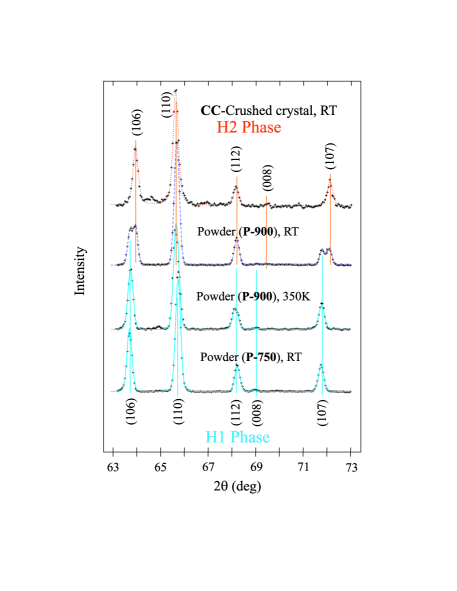
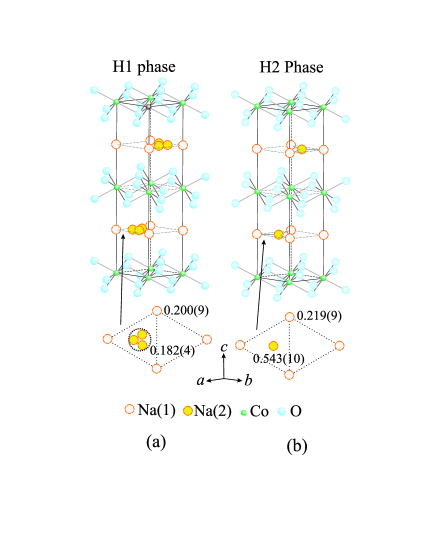
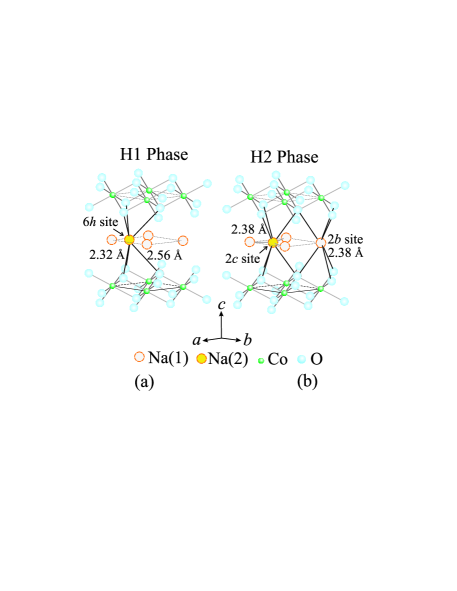
Figure 1 shows a portion of the neutron powder diffraction pattern of Na0.75CoO2 for the crushed single crystal sample (CC) and two of the powder samples (P-900 and P-750). By comparing the room-temperature pattern for sample CC (top-most profile) with the pattern for sample P-750 (bottom-most profile), we find that there are two distinct structural phases. As indicated in the plot, the positions of several peaks (such as the (106) and (107) peaks) are clearly different, indicating slight differences in the crystal structure. The data can be fit using the hexagonal space group with structural models H1 or H2 as shown in Fig. 2. Lynn et al. (2003); Jorgensen et al. (2003) These structural models will be discussed in detail below. The primary difference is that the Na(2) ions reside at a higher symmetry position for structure H2 compared to structure H1. The crushed crystal CC has structure H2 at room temperature, whereas the powder sample P-750 has structure H1 at room temperature.
The middle two diffraction profiles in Fig. 1 were taken on sample P-900 at room temperature and at K. Interestingly, the room temperature pattern shows coexistence of both structures, H1 and H2. When this sample is heated to 350 K, the peaks associated with structure H2 disappear completely, and the peaks associated with structure H1 are enhanced. This indicates that a structural phase transition occurs at an intermediate temperature. Note that the powder profile of the P-900 sample at 350 K is identical to the profile for the P-750 sample at room temperature, demonstrating that the conversion of the phase with structure H2 to the phase with structure H1 is complete. The diffraction pattern for the sample P-anneal, which was slow-cooled in oxygen, shows that the entire sample is described by structure H1. The structural parameters for all four samples determined by Rietveld refinement are summarized in Table 2.
| Sample ID | P-750 | P-900 ( 3.6wt%CoO) | P-anneal | CC | ||||||
|---|---|---|---|---|---|---|---|---|---|---|
| T (K) | 3.6 | 30 | 295 | 295 | 350 | 295 | 295 | |||
| (refined) | 0.721(8) | 0.726(8) | 0.711(8) | 0.746(15) | 0.762(13) | 0.746 | 0.762 | 0.749(8) | 0.752(17) | |
| Structure | H1 | H1 | H1 | H1(46.2(2)%) | H2(50.2(2)%) | H1(42.9(7)%) | H1(53.4(6)%) | H1 | H2 | |
| a() | 2.83607(4) | 2.83603(4) | 2.83709(4) | 2.83709(5) | 2.84064(4) | 2.8369(1) | 2.84250(9) | 2.83628(5) | 2.84081(9) | |
| c() | 10.8325(2) | 10.8327(2) | 10.8811(2) | 10.8735(2) | 10.8117(2) | 10.8733(5) | 10.8611(5) | 10.8863(3) | 10.8115(5) | |
| V() | 75.456(3) | 75.455(3) | 75.849(3) | 75.796(3) | 75.554(3) | 75.785(5) | 75.998(5) | 75.842(4) | 75.562(6) | |
| Co | B() | 0.13(3) | 0.14(2) | 0.32(2) | 0.20(3) | 0.20(3) | 0.20(3) | 0.20(3) | 0.38(4) | 0.13(7) |
| Na(1) | B() | 0.31(8) | 0.47(8) | 1.04(9) | 1.30(8) | 1.30(8) | 1.41(9) | 1.41(9) | 1.7(1) | 1.0(1) |
| 0.196(5) | 0.198(5) | 0.198(5) | 0.200(9) | 0.219(9) | 0.200 | 0.219 | 0.221(5) | 0.224(11) | ||
| Na(2) | 0.2810(7) | 0.2814(7) | 0.2834(8) | 0.274(1) | 0.285(2) | 0.299(2) | 0.289(2) | |||
| B() | 0.31(8) | 0.47(8) | 1.04(9) | 1.30(8) | 1.30(8) | 1.41(9) | 1.41(9) | 1.7(1) | ||
| n | 0.175(2) | 0.176(2) | 0.171(2) | 0.182(4) | 0.543(10) | 0.182 | 0.181 | 0.176(2) | 0.518(13) | |
| O | 0.09054(7) | 0.09052(6) | 0.09023(7) | 0.0904(1) | 0.0909(1) | 0.0925(2) | 0.0888(2) | 0.08990(8) | 0.0908(2) | |
| B() | 0.43(2) | 0.45(1) | 0.61(1) | 0.46(1) | 0.46(1) | 0.60(2) | 0.60(2) | 0.56(2) | 0.50(3) | |
| (%) | 4.75 | 4.62 | 4.42 | 4.16 | 5.28 | 4.90 | 4.54 | |||
| 5.90 | 5.78 | 5.39 | 5.02 | 6.58 | 6.54 | 5.66 | ||||
| 2.100 | 1.976 | 1.790 | 1.608 | 2.149 | 2.829 | 1.323 | ||||
Selected bond () distances and angles (degree)
Co-O
1.9087(4)
1.9085(4)
1.9097(4)
1.9103(6)
1.9119(6)
1.922(1)
1.904(1)
1.9077(5)
1.912(1)
O-Co-O
95.97(3)
95.97(3)
95.94(2)
95.90(4)
95.96(4)
95.11(9)
96.59(8)
96.04(3)
95.97(7)
Na(1)-O
2.3801(5)
2.3803(5)
2.3886(5)
2.3863(8)
2.3768(8)
2.370(2)
2.399(2)
2.3915(6)
2.377(2)
Na(2)-O
2.304(1)
2.305(1)
2.316(1)
2.302(2)
2.3768(8)
2.298(3)
2.346(4)
2.326(2)
2.377(2)
2.564(3)
2.562(3)
2.563(3)
2.596(5)
2.3768(8)
2.540(8)
2.519(9)
2.547(5)
2.377(2)
Na(2)-Oaverage
2.391(5)
2.389(5)
2.398(5)
2.400(8)
2.3768(8)
2.38(1)
2.40(2)
2.400(8)
2.377(2)

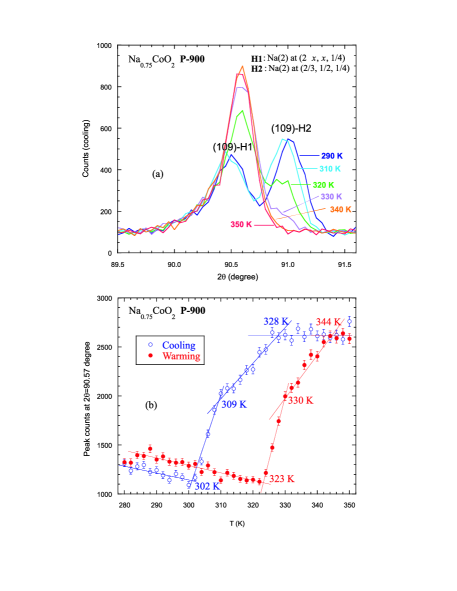
In order to characterize the structural phase transition in more detail, we measured the (109) Bragg peak of sample P-900 over a range of temperatures. As shown in Figure 3(a), at a temperature of K there are two diffraction peaks, (109)-H1 and (109)-H2, signifying the coexistence of both structures (H1 and H2). As the temperature is raised in steps of 2 K, the intensity of the (109)-H2 peak decreases and the intensity of (109)-H1 peak increases. Upon warming, the sample becomes single phase above 340 K, possessing only the H1 structure. Figure 3(b) shows the intensity at a -position corresponding to the (109)-H1 reflection as a function of temperature. The intensity suddenly increases above 323 K upon warming, and reaches a maximum near 344 K. Upon cooling the intensity begins to decrease suddenly below 328 K and levels off below 302 K. The marked hysteresis (around 20 degrees in temperature) suggests that the transformation from structure H2 to H1 is a first order transition.
The reason for the coexistence of the two structures at room temperature is that sample P-900 is likely composed of a mixture of two stoichiometries with slightly different Na contents. The Rietveld refinement at K indicates the sample is almost an equal mixture of two compounds with and . (We note that the error bars for for these two phases overlap. Alternatively, we could label these two phases using their and lattice constants, which are clearly distinguishable.) A complete diffraction pattern was collected at 350 K and the data were analyzed by the Rietveld method using a two-phase model with the same H1 structure but different structural parameters. In this refinement the Na content and the occupancies for each site were fixed at values obtained from the 295 K data, assuming that the Na atoms do not change sites (ie. Na(1) and Na(2)) between 295 and 350 K. The results are shown in Table 2. From these fits, we can conclude that the temperature dependence plotted in Fig. 3 is entirely derived from the phase associated with .
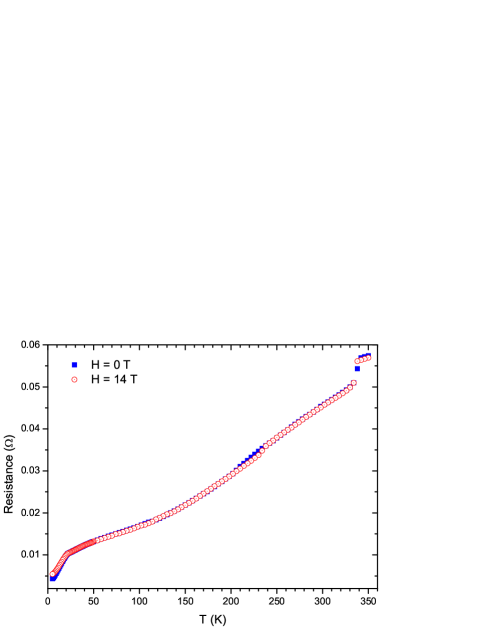
We have measured the transport properties of a single crystal sample of Na0.75CoO2 which was prepared under the same conditions as sample CC. Figure 4 shows the resistance as a function of temperature between 5 K and 350 K, measured in magnetic fields of 0 Tesla and 14 Tesla oriented along the c-axis. The most noticeable features of the resistivity curves are the transitions near 22 K and 340 K. Both of these features agree with the reported measurements of Sales et.al. on a floating-zone grown Na0.75CoO2 sample.Sales et al. (2004) The distinct jump in resistivity between 330 K and 340 K (upon warming) in Fig. 4 closely matches the temperature range (between 323 K and 344 K) over which the H2 structure becomes transformed to the H1 structure for the sample shown in Fig. 3. Since the crushed crystal is also described by the H2 structure at room temperature, we conclude that the jump in resistance near 340 K is a direct result of the structural transition (H2H1) that we have discovered. We also observe a very small magnetoresistance effect between 200 K and 240 K.
Magnetic susceptibility measurements were performed on the same single crystal used for the resistance measurement. These data are shown in Fig. 5. We find that there is a subtle change in the temperature dependence between 330 K and 340 K. This is consistent with other reported measurements.Sales et al. (2004) Again, we can associate this behavior with the newly discovered structural transition. Measurements of the magnetic susceptibility of the crushed crystal sample CC show nearly identical behavior.
IV DISCUSSION
The most important finding of this work is the existence of two distinct structures for NaxCoO2 samples with near 0.75. The difference between the two structural models, H1 and H2, is that in model H2 the Na(2) atoms occupy the site, while for the model H1 structure the Na(2) atoms randomly occupy the site. To emphasize the differences in Na positions in the two models, we show a section of a Na layer, projected along the c-axis, in the lower part of the Fig. 2. In addition, Fig. 6 shows the coordination of the Na(1) and Na(2) sites. There are six oxygen atoms surrounding the Na with the average Na-O bond distance 2.38 Å, forming a triangular polyhedron. The Na(1)O6 triangular polyhedron is face sharing with two CoO6 octahedra (directly above and below) and the Na(2)O6 triangular polyhedron is corner sharing with six CoO6 octahedra in the nearest CoO2 blocks. Both Na(1) and Na(2) sites are partially occupied and the ratio of the number of the Na ions is nNa(2) : nNa(1) = 2.5 : 1. No evidence of vacancy ordering was observed in our experiments. In model H2, the Na(1) and Na(2) ions are located at the corner and center of the triangular mesh of the hexagonal lattice, respectively, and both Na(1) and Na(2) have identical bonding distances to the nearest oxygen atoms. In contrast, in model H1, the Na(2) shifts away from the center of the Co-ions triangle and randomly occupies the 6h(2x, x, 1/4) sites. In this case, therefore, the Na ions shift away from the center of the triangular NaO6 polyhedron resulting in two long (2.56 Å) and four short (2.32 Å) Na-O bonds.
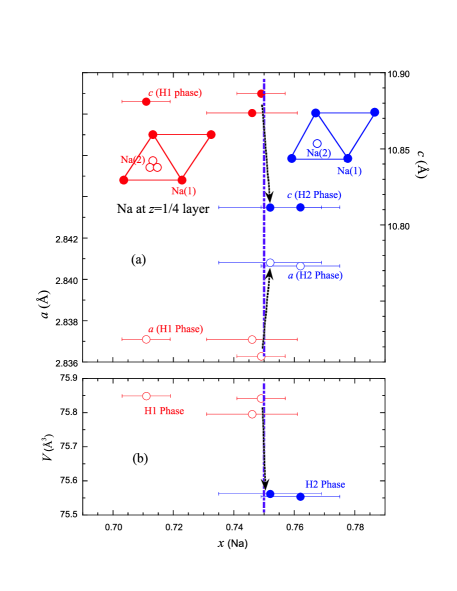
Another important result from our work is shown in Fig. 7. Here, we plot of the lattice constants as a function of Na content , where was determined by Rietveld refinement as listed in Table 2. In samples with structure H1, the a-axis is significantly shorter and the c-axis is significantly longer than in samples with structure H2. Hence, these two structures can be readily distinguished from each other. Our refinements suggest that a sudden change occurs at near 0.75, in which structure H1 is the stable phase below and structure H2 is the stable phase above . We note that the error bars for the refined values of are large and overlap, except for the two samples: P-750 with and P-900 with . However, the identification of as the critical concentration is further confirmed by studies on other samples of NaxCoO2 with different stoichiometry ().Huang et al. (2004b) We note that the H1-to-H2 phase transition is not observed in sample P-750 which has . At this value of , the structure H1 is stable for the entire temperature range measured.
The structural phase transition resembles an order-disorder phase transitions in that Na atoms shift from a random occupation of the 6 sites (structure H1) to a configuration in which every Na(2) atom occupies a 2 position (structure H2). The transition is unusual in that it is the lower temperature phase (structure H2) which has the higher symmetry for the Na(2) ions. However, we note that both structures have the same average space group symmetry , as measured by neutron powder diffraction.
The sudden expansion of the -axis lattice constant at the transition from structure H1 to H2 may explain the sharp jump in the resistance that we measured near 340 K upon warming. The transport properties of NaxCoO2 are highly anisotropic, with the resistivity within the -planes being several hundred times higher than that perpendicular to the planes.Sales et al. (2004) The resistance of such an anisotropic material measured using the 4-probe technique usually contains an out-of-plane component due to non-uniform current flow across the sample. Since the c-axis resistivity should increase for a larger c-axis lattice constant, this may explain the jump in our resistance data shown in Fig. 4. Alternatively, the jump in resistivity may be related to enhanced scattering due to the disorder in the H1 structure, which has randomly occupied sites.
In conclusion, we have found two distinct structural phases in NaxCoO2 with near 0.75. These two phase are characterized by Na ions which occupy different sites, in structure H1 and in structure H2. The presence of either structure depends sensitively on the specific conditions used during sample synthesis (such as annealing environment and rate of cooling). Our refinement parameters indicate that this structural transition is especially sensitive to the Na content , with as the critical concentration separating the two phases. By raising the temperature to around K, the high-symmetry structure (H2) can be converted to the lower-symmetry structure (H1). We find that this structural transition also has signatures in measurements of the bulk magnetic and transport properties.
Acknowledgements.
The work at MIT was supported primarily by the MRSEC Program of the National Science Foundation under grant number DMR 02-13282. Identification of commercial equipment in the text is not intended to imply recommendation or endorsement by the National Institute of Standards and Technology.References
- Takada et al. (2003) K. Takada, N. Sakurai, E. Takayama-Muromachi, F. Izumi, R. A. Dilanlan, and T. Sasaki, Nature 422 (2003).
- Ray et al. (1999) R. Ray, A. Ghoshray, K. Ghoshray, and S. Nakamura, Phys. Rev. B 59, 9454 (1999).
- Chou et al. (2004a) F. C. Chou, J. H. Cho, and Y. S. Lee (2004a), cond-mat/0404061.
- Foo et al. (2003) M. L. Foo, Y. Wang, S. Watauchi, H. W. Zandbergen, T. He, R. J. Cava, and N. P. Ong (2003), cond-mat/0312174.
- Zandbergen et al. (2004) H. Zandbergen, M. Foo, Q. Xu, V. Kumar, and R. J. Cava (2004), cond-mat/0403206.
- Huang et al. (2004a) Q. Huang, M. Foo, J. Lynn, H. Zandbergen, G. Lawes, Y. Wang, B. H. Toby, A. Ramirez, N. Ong, and R. Cava (2004a), cond-mat/0402255.
- Sales et al. (2004) B. C. Sales, R. Jin, K. A. Affholter, P. Khalifah, G. M. Veith, and D. Mandrus (2004), cond-mat/0402379.
- Chou et al. (2004b) F. C. Chou, J. H. Cho, P. A. Lee, E. T. Abel, K. Matan, and Y. S. Lee, Phys. Rev. Lett. 92 (2004b).
- Larson and Von Dreele (1994) A. Larson and R. Von Dreele, Los Alamos National Laboratory, Internal Report (1994).
- Lynn et al. (2003) J. W. Lynn, Q. Huang, C. M. Brown, V. L. Miller, M. L. Foo, R. E. Schaak, C. Y. Jones, E. A. Mackey, and R. J. Cava, Physical Review B 68 (2003).
- Jorgensen et al. (2003) J. D. Jorgensen, M. Avdeev, D. G. Hinks, J. C. Burley, and S. Short, Physical Review B 68 (2003).
- Huang et al. (2004b) Q. Huang, M. Foo, J. Lynn, B. Toby, R. A. Pascal Jr., H. Zandbergen, and R. Cava (2004b), unpublished.