Also at ]Physics Department, Kazan State University, Kazan 420008 Russia
Magnetization reduction induced by nonlinear effects
Abstract
This letter reports the first detailed measurement of , the component parallel to the effective field direction, when ferromagnets are excited by microwave fields at high power levels. It is found that drops dramatically at the saturation of the main resonance. Simultaneous measurements of and absorption power show that this drop corresponds to a diminution of the spin-lattice relaxation rate. These changes are interpreted as reflecting the properties of longitudinal spinwaves excited above Suhl’s instability. Similar behavior should be expected in spinwave emission by currents.
pacs:
76.50.+gFerromagnetic, antiferromagnetic, and ferrimagnetic resonancesThe out of equilibrium dynamics of ferromagnets is receiving much attention owing to the potential application to spin electronic devices. Interest for transport properties usually lies in the response of the longitudinal magnetization (component parallel to the effective field direction) to a large excitation amplitude. But the high power dynamics cannot be understood in terms of a linear susceptibility. Nonlinear (NL) contributions contained in the torque term of the gyroscopic equation become important as soon as the precession angle exceeds a couple of degrees. Although these effects were first discovered in the ferromagnetic resonance (FMR) response of insulators Damon (1953), they are in fact generic to all ferromagnets. The same physics also applies to metallic samples as shown recently by An et al. An et al. (2004). While the consequences of these nonlinearities on the microwave susceptibility have been thoroughly investigated Suhl (1957), their effects on have never been established.
This letter reports the first measurement of at the resonance saturation. We will present our data obtained at room temperature on an yttrium iron garnet (YIG) sample, shaped into a disk of diameter m and thickness m and uniformly magnetized by a static magnetic induction applied along the normal axis of the disk Naletov et al. (2003). It is found that drops dramatically at the saturation of the main resonance. It results from a rapid growth of phase-coherent spinwaves (SW) propagating along the magnetization direction Suhl (1957). We use these experimental results to discuss the consequences of the NL effects on the problematic of spin injection. Their inclusion inside the microscopic spin-torque model Slonczewski (1996); Berger (1996); Waintal et al. (2000) should provide a mechanism to reverse the magnetization through a reduction of Silva et al. (2002); Safonov (2004).
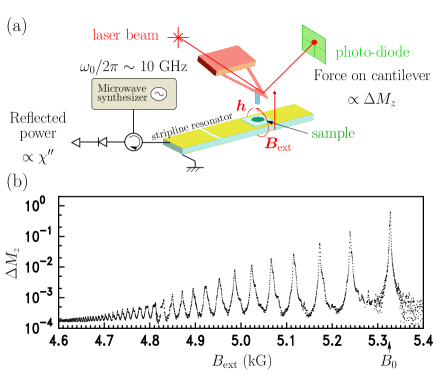
We exploit the exquisite sensitivity of Magnetic Resonance Force Microscopy (MRFM) to follow the changes in with a resolution better than 1ppm. A schematic of the setup is shown in Fig.1(a). A cylindrical permanent magnet is glued at the free end of a clamped cantilever and then aligned with the axis of the YIG disk. The distance between the sample and the probe is fixed at m so that their coupling is in the weak interaction regime Charbois et al. (2002). The inhomogeneous dipolar field generated by the sample creates a point load on the tip and thus an elastic deformation of the cantilever. Since the flexural modes of the cantilever are well below the Larmor frequency, the mechanical probe is insensitive to the precession of the transverse magnetization and it only couples to the longitudinal component .
The measured quantity is when the microwave field is turned on. is the saturation magnetization at the lattice temperature. The microwave is generated by a synthesizer and fed into an impedance matched stripline resonator tuned at GHz. We call the circularly polarized amplitude of the microwave driving field at the sample position. If is much lower than Suhl’s threshold (see below) then the response is proportional to the excitation power. Fig.1(b) shows the FMR spectrum of our disk in the linear regime. A multiplicity of maxima are detected during a sweep of . The spectrum illustrates the quantized energy levels of magnetostatic waves (near-zero wavevector) confined by the sample diameter.
Simultaneously, we measure the imaginary part of the transverse susceptibility through a standard setup. The power reflected off the half-wavelength resonator is detected by a microwave crystal diode whose signal is proportional to the absorbed power .
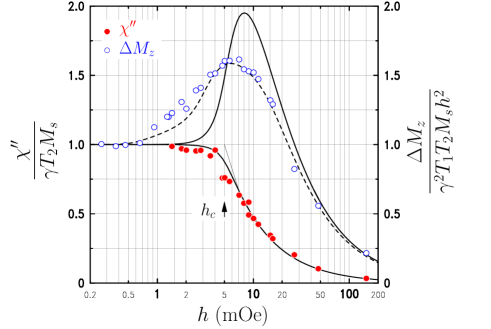
Although the discussion below can be extended to any of the magnetostatic modes above, we concentrate on the high power behavior of the main resonance at G (see Fig.1(b)). This mode has a transverse wavevector and is called hereof the uniform precession because it has no precessional nodes. We plot in Fig.2 the microwave field dependence of (closed circles) and (open circles) evaluated at resonance. Both quantities are normalized by their low power values. The data shows the well known premature saturation behavior above Suhl’s threshold, mOe. Surprisingly, the power dependence of exhibits a peak at the threshold. Evidence of a behavior where increases with power has never been established before in any magnetic resonance experiment.
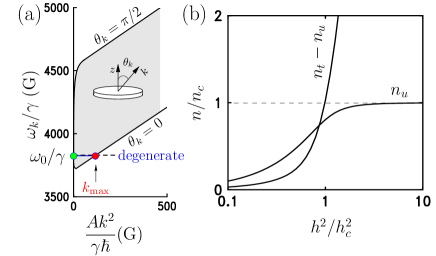
Obviously the correlation between the longitudinal and transverse quantities cannot be explained by a macrospin picture, which implies that in this power range. The difference clearly demonstrates that the measurements only reveal a partial picture of the dynamics inside the sample. Other SW with identical energies () but different wavevectors () can be excited in the sample. Fig.3(a) is the magnon-manifold for our finite aspect ratio disk Sparks (1964). The shaded area expresses the possible balance between demagnetizing and exchange energies. Volume demagnetizing energy of SW mode can be changed by varying the angle between , the propagation wavevector and , the magnetization vector. Short wavelength SW do not couple to because the transverse projection averages to zero. However, each magnon excitation diminishes the longitudinal component by . In other words, while the transverse data measures the number of uniform magnons , the longitudinal data is proportional to the total number of magnons . Here we only count the magnons created by the microwave excitation. Thermal magnons’ occupation numbers are accounted for in and remain constant in all the measurements below. Suhl showed Suhl (1957) that the NL coupling destroy the independence between degenerate modes. He found that, above a critical power (), saturates at as shown in Fig.3(b). We want to establish that this saturation is associated with a surge of degenerate magnons .
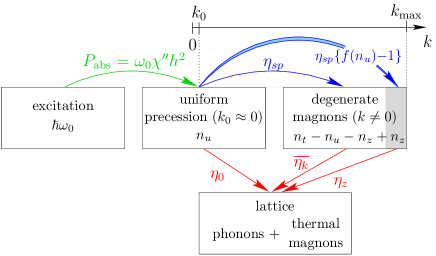
Before continuing further the discussion, we need to look at the different relaxation channels in our sample. These damping forces are necessary to stabilize the SW excited by the nonlinearities Suhl (1957). Fig.4 establishes a schematic of the coupling between the various degrees of freedom in the system. At and , the uniform microwave field preferentially couples to the uniform mode, the longest wavelength mode available inside the degenerate band. Its energy relaxation rate directly to the lattice will be written (our definition is twice as large as the amplitude relaxation rate used in Suhl’s paper Suhl (1957)). The linewidth of the peaks in Fig.1(b), however, is the sum , where is the decay constant of the uniform precession to degenerate SW due to scattering on the sample inhomogeneities. We define as the number of degenerate magnons having a wavevector and as their average decay rate to the thermodynamic equilibrium. Translated into Bloch’s notation, the linear part of the diagram in Fig.4 corresponds Fletcher et al. (1960) to and , respectively the transverse and longitudinal relaxation times. These relaxation times, in the limit of infinitesimal excitations, have been completely characterized in a previous paper Klein et al. (2003). Their values are summarized in Table 1.
| spin-spin | uniform | th | longitudinal |
|---|---|---|---|
| process | precession | magnons | magnons |
| 0.2 | 1.07 | 0.65 | 0.15 |
The NL terms in the gyroscopic equation Suhl (1957) couple coherently degenerate SW of equal and opposite wavevectors . The coupling term with the uniform motion, , is maximum (G) for longitudinal SW ( or ). We use Suhl’s notation for so that the reader can refer to Suhl (1957) for a complete treatment. In our disk, these SW have a wavevector (see Fig.3(a)). A critical threshold is reached when becomes comparable to , the relaxation rate to the lattice of the longitudinal SW. Two quanta of the uniform precession then break down in a parametric magnon pair propagating along . The instability corresponds to a spatial distortion of the instantaneous axis of precession which diminishes the transverse demagnetizing energy. The critical number of uniform magnons is with , the saturation power. We propose to view this as an alteration of the energy flow between the modes in Fig.4:
| (1a) | |||
| (1b) | |||
| (1c) | |||
where Suhl (1959) and is the number of parametric magnons.
In the stationary regime, Eq.1a leads to an implicit equation for the susceptibility first derived by Suhl Suhl (1959):
| (2) |
where is the susceptibility normalized by its low power value. We try to compare quantitatively our data to the profile predicted by Eq.2. We use the measured value of the threshold, mOe, in the formula. It corresponds to G, a value which is consistent with previous measurements in spheres and thin plates Patton and Jantz (1979), where it was found that the decay rate becomes smaller as diminishes Patton and Jantz (1979); Fletcher et al. (1960). We have displayed in Fig.2 the predicted behavior, with no fitting parameters. The model properly predicts the shape and the smearing out of the singularity at .
Solving the set of Eq.1 in the steady-state gives a new analytical relationship between and
| (3) |
where is normalized by the slope of at low power. The above equality is equivalent to an energy balance between the absorbed power and the dissipated power in the sample Schlömann (1959); Fletcher et al. (1960). The solid line in Fig.2 is the bell-shape behavior inferred from Eq.3 when . Experimentally we find that the raise of begins at powers lower than . We have omitted in our model the finite size effects in order to keep the discussion simple. But the so-called uniform mode has a spatially dependent precession amplitude. at the center of the disk is about three times larger than its spatial average Naletov et al. (2003). Changes in the profile are expected when different locations of the sample hit the saturation threshold. Spatial dependences are further magnified by the MRFM which provides a local measurement (here the mechanical probe is above the disk center). While the raise of coincides with the saturation of the central part of the disk, the spatially averaged transverse susceptibility drops at higher power, approximately when the periphery saturates (zone with the highest spatial weight). The dashed line in Fig.2 is the predicted behavior when Eq.3 is weighted by the spatial profile of . Such good agreement with the data suggests that the shift of the peak towards is due to these finite size effects.
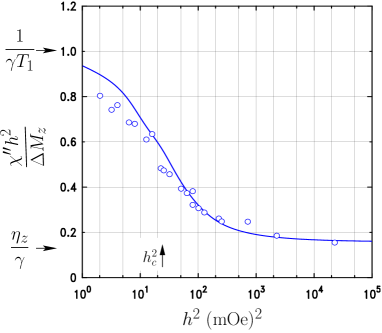
To gain further insight, we plot in Fig.5 the ratio between the transverse and longitudinal quantities. This shows the power dependence of the spin-lattice relaxation rate inside the spin system. In magnetic resonance, the power absorbed during the spin-lattice relaxation time is equal to the energy stored in the sample, . Thus the quantity on the ordinate axis is . We find that the observed correlation between and corresponds to a monotonic diminution of the damping with increasing power. This ratio starts to decrease below and the drop extends to the region. In our model, the relaxation rate is simply equal to when (linear regime) and then it reduces to when . The two limits correlate respectively to and . The solid line in Fig.5 is the drop inferred from the analytical expression showing how the value is approached asymptotically. We find that the agreement with the data extends well above and the asymptotic value is in agreement with the inferred from the threshold value, . We recall that our model only considers the NL coupling between the uniform and the longitudinal magnons. A proper analysis, however, should also account for the NL coupling between all the degenerate modes, which become important at much higher powers. They correspond to a different redistribution of the degenerate magnons’ occupation number in the flow diagram of Fig.4.
In conclusion, this letter studies the changes of properties of excited SW due to NL effects. If the excitation mechanism favors a particular mode, then a 4-magnon process starts at high power levels to redistribute the magnons’ occupation number between degenerate modes. During the redistribution, the coupling to the excitation usually decreases: less energy is absorbed for the same excitation energy. The efficiency, however, might increase if the newly filled modes (generally the longitudinal ones Sparks (1964)) have lower energy relaxation rates: more SW are emitted for the same absorbed energy. We believe that these comments are also pertinent to SW emitted by a current for the following reasons. First, the above statements can be generalized to other selection rules, i.e. the favored mode might not necessarily be the longest wavelength one. Second, the precession amplitudes achieved by currents are much larger than the ones achieved by microwaves Kiselev et al. (2003) (though conductors have larger values of ). Third, the eigen-modes are at least doubly degenerate if one sample dimension is larger than 100nm (indeed the width of the magnon manifold is of the order of nm for metals). Fourth, the energy relaxation rate of degenerate SW generally decreases as aligns with the direction (cf. measurements in Permalloy films An et al. (2004)). These arguments indicate that parametric SW should also get excited by spin injection. Excitations of short wavelength SW should provide a mechanism to reverse the magnetization through a reduction of Safonov (2004). Finally, we emphasize that the NL transfers conserve the phase-coherency. This point is important regarding to the spin torque model which relies on the concept of coherent emission of SW Berger (1996).
We are greatly indebted to J. Ben Youssef, V. Charbois, M. Viret, X. Waintal, C. Fermon and O. Acher for their help and support. This research was partially supported by the E.U. project M2EMS (IST-2001-34594) and the Action Concertée Nanoscience NN085.
References
- Damon (1953) R. W. Damon, Rev. Mod. Phys. 25, 239 (1953).
- An et al. (2004) S. Y. An, P. Krivosik, M. A. Kraemer, H. M. Olson, A. V. Nazarov, and C. E. Patton, J. Appl. Phys. 96, 1572 (2004).
- Suhl (1957) H. Suhl, J. Phys. Chem. Solids 1, 209 (1957).
- Naletov et al. (2003) V. V. Naletov, V. Charbois, O. Klein, and C. Fermon, Appl. Phys. Lett. 83, 3132 (2003).
- Slonczewski (1996) J. C. Slonczewski, J. Magn. Magn. Mater. 159, 1 (1996).
- Berger (1996) L. Berger, Phys. Rev. B 54, 9353 (1996).
- Waintal et al. (2000) X. Waintal, E. B. Myers, P. W. Brouwer, and D. C. Ralph, Phys. Rev. B 62, 12317 (2000).
- Silva et al. (2002) T. J. Silva, P. Kabos, and M. R. Pufall, Appl. Phys. Lett. 81, 2205 (2002).
- Safonov (2004) V. L. Safonov, J. Appl. Phys. 95, 7145 (2004).
- Charbois et al. (2002) V. Charbois, V. V. Naletov, J. Ben Youssef, and O. Klein, Appl. Phys. Lett. 80, 4795 (2002).
- Sparks (1964) M. Sparks, Ferromagnetic relaxation theory (McGraw-Hill, 1964).
- Fletcher et al. (1960) R. C. Fletcher, R. C. LeCraw, and E. G. Spencer, Phys. Rev. 117, 955 (1960).
- Klein et al. (2003) O. Klein, V. Charbois, V. V. Naletov, and C. Fermon, Phys. Rev. B (Rapid Comm.) 67, 220407 (2003).
- Suhl (1959) H. Suhl, J. Appl. Phys. 30, 1961 (1959).
- Patton and Jantz (1979) C. E. Patton and W. Jantz, J. Appl. Phys. 50, 7082 (1979).
- Schlömann (1959) E. Schlömann, Phys. Rev. 116, 828 (1959).
- Kiselev et al. (2003) S. I. Kiselev, J. C. Sankey, I. N. Krivorotov, N. C. Emley, R. J. Schoelkopf, R. A. Buhrman, and D. C. Ralph, Nature 425, 380 (2003).