Anomalous Paramagnetic Effects in the Mixed State of LuNi2B2C
Abstract
Anomalous paramagnetic effects in dc magnetization were observed in the mixed state of LuNi2B2C, unlike any reported previously. It appears as a kink-like feature for kOe and becomes more prominent with increasing field. A specific heat anomaly at the corresponding temperature suggests that the magnetization anomaly is due to a true bulk transition. A magnetic flux transition from a square to an hexagonal lattice is consistent with the anomaly.
In cuprate (high-) superconductors, high-transition temperatures () and short coherence lengths () lead to large thermal fluctuation effects, opening a possibility for melting of the flux line lattice (FLL) at temperatures well below the superconducting transition temperature. A discontinuous step in dc magnetization and a sudden, kink-like drop in resistivity signified the first order nature of the melting transition from the vortex lattice into a liquid.Pastoriza et al. (1994); Zeldov et al. (1995); Welp et al. (1996) In conventional type II superconductors, with modest transition temperatures and large coherence lengths, vortex melting is also expected to occur in a very limited part of the phase diagram,Eilenberger (1967) but it has yet to be observed experimentally. In the rare-earth nickel borocarbides RNi2B2C (R = Y, Dy, Ho, Er, Tm, Lu), the coherence lengths () and superconducting transition temperatures (16.1 K for R = Lu) lie between these extremes, suggesting that the vortex melting will be observable and may provide further information on vortex dynamics. Indeed, Mun et al. Mun et al. (1996) reported the observation of vortex melting in YNi2B2C, based on a sharp, kink-like drop in electrical resistivity.
Recently, a magnetic field-driven FLL transition has been observed in the tetragonal borocarbides.Yaron et al. (1996); Eskildsen et al. (1998); Sakata et al. (2000); Eskildsen et al. (2001a) The transition from square to hexagonal vortex lattice occurs due to the competition between sources of anisotropy and vortex-vortex interactions. The repulsive nature of the vortex interaction favors the hexagonal Abrikosov lattice, whose vortex spacing is larger than that of a square lattice. The competing anisotropy, which favors a square lattice, can be due to lattice effects (fourfold Fermi surface anisotropy), Kogan et al. (1997) unconventional superconducting order parameter, Gilardi et al. (2002) or an interplay of the two.Nakai et al. (2002); Park et al. (2004) In combination with non-negligible fluctuation effects, the competition leads to unique vortex dynamics right below the line in the borocarbides, namely a reentrant vortex lattice transition.Eskildsen et al. (2001a) Fluctuation effects near the upper critical field line wash out the anisotropy effect, stabilizing the Abrikosov hexagonal lattice.Gurevich and Kogan (2001); Klironomos and Dorsey (2003) Here, we report the first observation of paramagnetic effects in the dc magnetization of the mixed state of LuNi2B2C. The kink-like feature in and the corresponding specific heat feature for kOe signify the reentrant FLL transition, which is consistent with the low-field FLL transition line inferred from small angle neutron scattering (SANS).Eskildsen et al. (2001a)
Single crystals of LuNi2B2C were grown in a Ni2B flux as described elsewhere Cho et al. (1995) and were post-growth annealed at C∘ for 100 hours under high vacuum, typically low Torr. Miao et al. (2002) Samples subjected to a preparation process such as grinding, were annealed again at the same condition as the post-growth annealing. A Quantum Design magnetic property measurement system (MPMS) was used to measure ac and dc magnetization while the heat capacity option of a Quantum Design physical property measurement system (PPMS) was used for specific heat measurements. Electrical resistivity was measured by using a Linear Research ac resistance bridge (LR-700) in combination with a PPMS.
The detailed dc magnetization of LuNi2B2C reveals an anomalous paramagnetic effect for 30 kOe, where the magnetic response deviates from a monotonic decrease and starts to rise, showing decreased diamagnetic response. The in-phase and out-of-phase components of the ac susceptibility show a dip and the specific heat data show a feature at the corresponding temperature, reminiscent of vortex melting in high- cuprates.Schilling et al. (1997) Electrical transport measurements, however, do not exhibit any feature corresponding to the paramagnetic effect; e.g., a sharp drop in the electrical resistivity. The zero-resistance transition, rather, occurs at a much higher temperature, suggesting that the paramagnetic effect is not related to vortex melting. It is instead consistent with a topological FLL change between square and hexagonal structures.
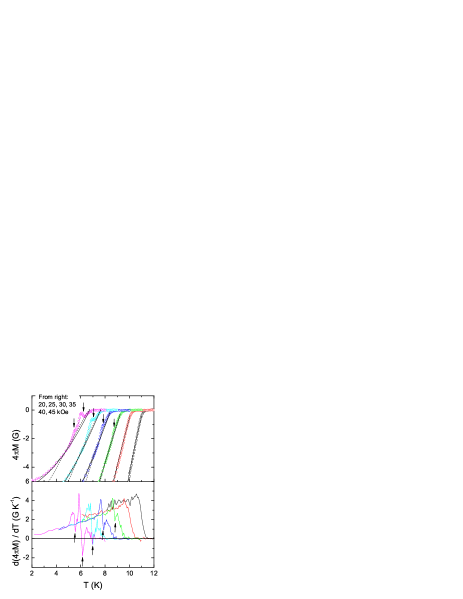
The top panel of Fig. 1 shows dc magnetization as a function of temperature at several fields. For kOe, kink-like features appear, which are marked by arrows. The anomalous increase can be easily seen as a sharp drop in (arrows in the bottom panel). The magnetization reported here is independent of time and has no hysteresis between zero-field cool (ZFC) and field cool (FC) data within experimental accuracy, indicating that the measured value is an equilibrium magnetization. In the top panel of Fig. 1, we compare the data and some model calculations. Dashed lines are predictions from the standard local London model: deGennes (1966)
| (1) |
where , is a constant of order unity, the penetration depth, and the flux quantum. In the fit, was determined from our resistivity data (see Fig. 2) and from with . In order to get the best result, the fitting parameter was varied between 0.95 and 0.97 and the absolute amplitude of was changed as a function of magnetic field. The local London model explains the monotonic decrease with decreasing temperature, but the fit becomes worse at higher field. In a clean system like LuNi2B2C where the electronic mean free path is long compared to the coherence length , the current at a point depends on magnetic fields within a characteristic length , or nonlocal radius. Taking into account the nonlocal current-field relation in superconductors, a non-local London model was suggested: Kogan et al. (1996)
| (2) |
where and with and being order of unity. It is worth noting that the scaling parameter in the local theory is replaced by in the non-local model. The nonlocal radius slowly decreases with increasing temperature and is suppressed strongly by scattering. The solid lines are best results from the model calculation where we used the temperature dependence of and from the literature for YNi2B2C.Song et al. (1999) Both the local and the non-local models explain the temperature dependence of at low fields, while only the non-local model can describe the data at and above 35 kOe. The good fit from the nonlocal model is consistent with the equilibrium magnetization analysis of YNi2B2C, Song et al. (1999) suggesting the importance of nonlocal effects in the magnetization. The many fitting parameters in both fits, however, prevent us from making a definite conclusion as to which model better describes . Nevertheless, we can extract the important conclusion that the kink-like feature in the mixed state is a new phenomenon that needs further explanation.
In the early stage of high- cuprate research, anomalous paramagnetic effects in were reported in the irreversible region and this effect was later attributed to the field inhomogeneity of the measured scan length in a SQUID magnetometer.Schilling et al. (1992) We tested various scan lengths from 1.8 cm to 6 cm for which the field inhomogeneity varies from 0.005 % to 1.4 % along the scan length and found negligible dependence on the measuring length, which suggests that field inhomogeneity is not the source of the anomaly. A more definitive test used a conventional type II superconductor NbSe2 in a similar configuration. There was no such anomalies in NbSe2 as in the borocarbide. Taken together, we conclude that the reversible paramagnetic effects are intrinsic to LuNi2B2C. We also emphasize that the the phenomena is different from the paramagnetic Meissner effect (PME) or Wohlleben effect Braunisch et al. (1993) where the FC becomes positive whereas the ZFC remains negative. The PME is an irreversible effect and occurs in the Meissner state, while the subject of this study is a reversible effect and takes place in the mixed state.
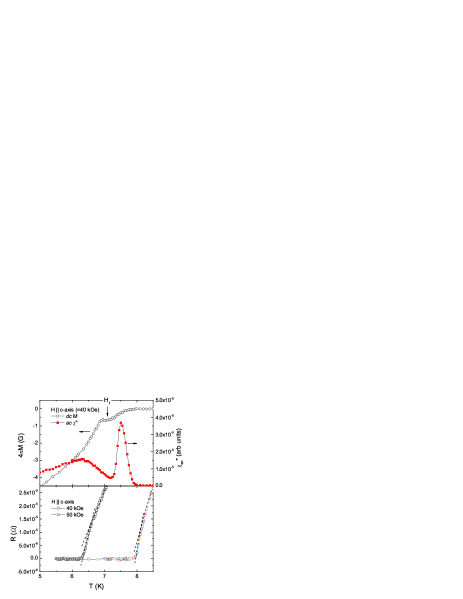
In the top panel of Fig. 2 the reversible magnetization (left axis) and the out-of-phase component of ac susceptibility (right axis) are shown as a function of temperature at 40 kOe. A dip appears both in (not shown) and in at the same temperature where shows the paramagnetic anomaly. Since a dip in is often related to vortex melting, it is natural to consider the vortex phase change from liquid to lattice or glass as a possible explanation. The resistive superconducting transition at 40 kOe (circles) and 50 kOe (squares) are shown in the bottom panel of Fig. 2. A resistive slope change in the transition region, that can be considered as a signature of the vortex melting, Mun et al. (1996) was observed at 8.1 K and 6.6 K for 40 kOe and 50 kOe, respectively. The transition temperature, however, is much higher than the temperature where the dip occurs in , which argues against the vortex melting scenario as the physical origin of the anomalous paramagnetic effects. The increase in at the transition temperature is also opposite from the decrease in the vortex melting interpretation.
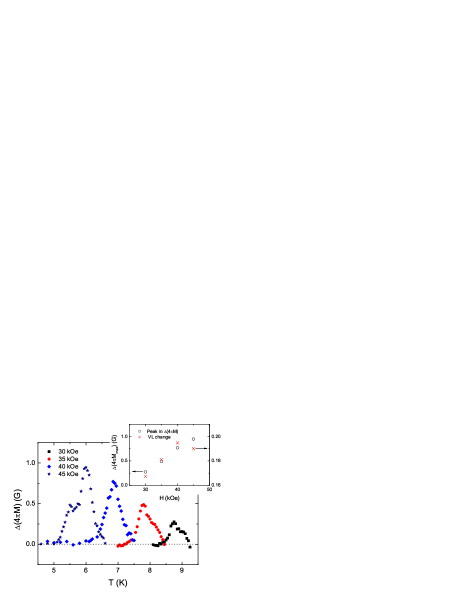
Recently, a structural phase transition in the FLL was suggested to explain another peak effect observed below the vortex melting line in YBCO. Deligiannis et al. (1997); Rosenstein and Knigavko (1999) The vanishing of a squash elastic mode gives rise to a topological FLL transition and leads to the new peak effect, while the softening of the shear modes is relevant to the conventional peak effect in high- cuprates.Larkin et al. (1995) The observation of the dip effect well below the melting line in LuNi2B2C indicates that the anomalous paramagnetic effects are related to a change in the FLL and the increase in is also consistent with the FLL change where the Abrikosov geometrical factor changes.Abrikosov (1957); deGennes (1966) Fig. 3 shows the temperature dependence of the paramagnetic anomaly, , at several magnetic fields, where is the magnetization after subtracting the monotonic, diamagnetic background obtained from Eq. (2). With increasing field, the peak becomes enhanced and an additional peak is observed at 45 kOe. In extreme type II material , the magnetization change due to a FLL transition is written as
| (3) |
where for a hexagonal FLL and for a square FLL.deGennes (1966) In the inset of Fig. 3, we compared the peak intensity of (left axis) and the estimation from Eq. 3 (right axis) with . It is encouraging to see that the simple model qualitatively reproduces the field dependence of the paramagnetic contribution. However, the quantitative difference in absolute values suggests that a more elaborate model is required.
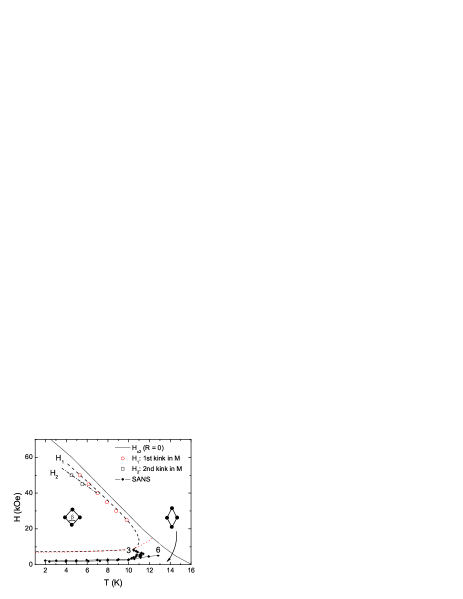
The phase diagram is shown in Fig. 4. The upper critical field line was determined from the superconducting transition and is consistent with the temperature where starts to have a non-zero value. The line in the mixed state is the point where the reversible magnetization shows the paramagnetic effects and is the 2nd anomaly that appears above 45 kOe (see Fig. 1). According to the Gurevich-Kogan non-local London model, Gurevich and Kogan (2001) the anisotropic nonlocal potential, which is responsible for the low-field FLL transition observed in SANS, Eskildsen et al. (2001a) is averaged out by thermal vortex fluctuations near . Since the interaction becomes isotropic, the hexagonal Abrikosov lattice is preferable, leading to the second FLL transition from square back to rhombic (triangular) lattice as the field gets closer to the line. The reentrant transition is predicted to occur well below the vortex melting line because the amplitude of vortex fluctuations required to wash out the nonlocal effects is much smaller than that for the vortex melting. This prediction is consistent with our observation that the line is much below the transition line. The dashed line depicts qualitatively what the fluctuations models based on the nonlocal London Gurevich and Kogan (2001) or extended GL Klironomos and Dorsey (2003) predict, which nicely explains the line. The dotted line is the FLL transition line that meets the line both in the non-local London model Affleck et al. (1997) and in the extended Ginzburg-Landau (GL) theory DeWilde et al. (1997) without fluctuation effects. We note that a direct comparison between the SANS and our data is difficult even though they are qualitatively similar. Since heavily depends on the sample purity, Gammel et al. (1999) a factor of 2 or more difference in has been easily observed even among pure compounds.Eskildsen et al. (1997); Eskildsen et al. (2001b) Further, the line from the SANS also depends on the criteria used for the FLL transition (see Fig. 4).
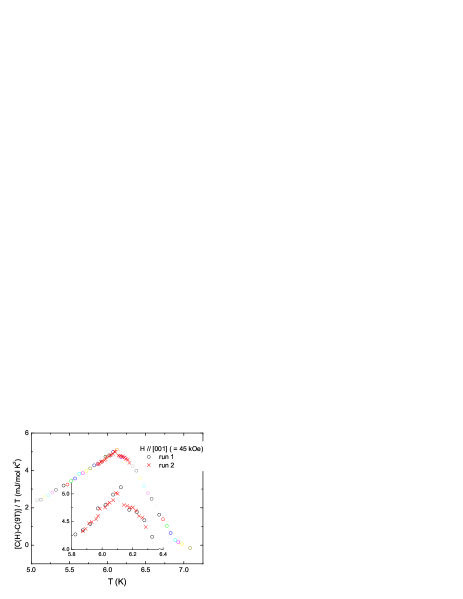
For vortex melting, where the lattice changes to a liquid, the transition involves latent heat and the specific heat shows a sharp peak at the transition temperature.Schilling et al. (1997) For a structural change in the vortex lattice, the transition is probably of 2nd order because an infinitesimally small change of the angle between adjacent vortex lines changes the symmetry. Based on the paramagnetic jump (Fig. 1) and (Fig. 3), Ehrenfest’s relation at constant field predicts a suppression of as the FLL changes from a rhombic to a square lattice. Fig. 5 shows the specific heat data of LuNi2B2C at 45 kOe as a function of temperature. In addition to the superconducting transition between 6.22 and 6.89 K, an anomaly is, indeed, observed at 6.12 K which corresponds to the anomalous paramagnetic effects. Depending on the back ground we choose, however, the anomaly can be considered as either a suppression or a jump.jum Similar features at 40 and 50 kOe were also observed at the temperatures corresponding to the paramagnetic effects in . More sensitive measurements such as ac calorimetry will help in resolving the issue. Finally, we note that we are not able to discern any corresponding feature to the line in or in . More work is in progress to understand the second paramagnetic jump in which appears for kOe.
In summary, we report the first observation of an anomalous paramagnetic jump in the magnetization of the mixed state of LuNi2B2C. A dip appears in at the same temperature as the paramagnetic effects, suggesting the relevance of the flux line lattice. The phase diagram is consistent with a FLL structural transition from square to hexagonal lattice just below the upper critical field line. The observation of an additional feature in the specific heat data at the corresponding temperature underscores the interpretation of paramagnetic effects as due to a reentrant FLL transition in LuNi2B2C.
Work at Los Alamos was performed under the auspices of the U.S. Department of Energy (DOE) and at Urbana under NSF Grant No. DMR 99-72087. The work at Pohang was supported by the Ministry of Science and Technology of Korea through the Creative Research Initiative Program and at Ames by Iowa State University of Science and Technology under DOE Contract No. W-7405-ENG-82. We acknowledge benefits from discussion with Lev N. Bulaevskii, M. P. Maley, and I. Vekhter. We thank T. Darling for assistance in sample annealing.
References
- Pastoriza et al. (1994) H. Pastoriza, M. F. Goffman, A. Arribere, and F. de la Cruz, Phys. Rev. Lett. 72, 2951 (1994).
- Zeldov et al. (1995) E. Zeldov, D. Majer, M. Konczykowski, V. B. Geshkenbein, V. M. Vinokur, and H. Shtrikman, Nature (London) 375, 373 (1995).
- Welp et al. (1996) U. Welp, J. A. Fendrich, W. K. Kwok, G. W. Crabtree, and B. W. Veal, Phys. Rev. Lett. 76, 4809 (1996).
- Eilenberger (1967) G. Eilenberger, Phys. Rev. 164, 628 (1967).
- Mun et al. (1996) M.-O. Mun, S.-I. Lee, W. C. Lee, P. C. Canfield, B. K. Cho, and D. C. Johnston, Phys. Rev. Lett. 76, 2790 (1996).
- Yaron et al. (1996) U. Yaron, P. Gammel, D. Huse, R. Kleiman, C. Oglesby, E. Bucher, B. Batlogg, D. Bishop, K. Mortensen, and K. Clausen, Nature (London) 382, 236 (1996).
- Eskildsen et al. (1998) M. R. Eskildsen, K. Harada, P. L. Gammel, A. B. Abrahamsen, N. H. Andersen, G. Ernst, A. P. Ramirez, D. J. Bishop, K. Mortensen, D. G. Naugle, et al., Nature (London) 393, 242 (1998).
- Sakata et al. (2000) H. Sakata, M. Oosawa, K. Matsuba, N. Nishida, H. Takeya, and K. Hirata, Phys. Rev. Lett. 84, 1583 (2000).
- Eskildsen et al. (2001a) M. R. Eskildsen, A. B. Abrahamsen, V. G. Kogan, P. L. Gammel, K. Mortensen, N. H. Andersen, and P. C. Canfield, Phys. Rev. Lett. 86, 5148 (2001a).
- Kogan et al. (1997) V. G. Kogan, M. Bullock, B. Harmon, P. Miranovic, L. Dobrosavljevic-Grujic, P. L. Gammel, and D. J. Bishop, Phys. Rev. B 55, R8693 (1997).
- Gilardi et al. (2002) R. Gilardi, J. Mesot, A. Drew, U. Divakar, S. L. Lee, E. M. Forgan, O. Zaharko, K. Conder, V. K. Aswal, C. D. Dewhurst, et al., Phys. Rev. Lett. 88, 217003 (2002).
- Nakai et al. (2002) N. Nakai, P. Miranovic, M. Ichioka, and K. Machida, Phys. Rev. Lett 89, 237004 (2002).
- Park et al. (2004) T. Park, E. E. M. Chia, M. B. Salamon, E. D. Bauer, I. Vekhter, J. D. Thompson, E. M. Choi, H. J. Kim, S.-I. Lee, and P. C. Canfield (2004), unpublished.
- Gurevich and Kogan (2001) A. Gurevich and V. G. Kogan, Phys. Rev. Lett. 87, 177009 (2001).
- Klironomos and Dorsey (2003) A. D. Klironomos and A. T. Dorsey, Phys. Rev. Lett. 91, 097002 (2003).
- Cho et al. (1995) B. K. Cho, P. C. Canfield, L. L. Miller, D. C. Johnston, W. P. Beyermann, and A. Yatskar, Phys. Rev. B 52, 3684 (1995).
- Miao et al. (2002) X. Y. Miao, S. L. Bud’ko, and P. C. Canfield, J. Alloys Comp. 338, 13 (2002).
- Schilling et al. (1997) A. Schilling, R. A. Fisher, N. E. Phillips, U. Welp, W. K. Kwok, and G. W. Crabtree, Phys. Rev. Lett. 78, 4833 (1997).
- deGennes (1966) P. G. deGennes, Superconductivity of Metals and Alloys (Benjamin, New York, 1966).
- Kogan et al. (1996) V. G. Kogan, A. Gurevich, J. H. Cho, D. C. Johnston, M. Xu, J. R. Thompson, and A. Martynovich, Phys. Rev. B 54, 12386 (1996).
- Song et al. (1999) K. J. Song, J. R. Thompson, M. Yethiraj, D. K. Christen, C. V. Tomy, and D. M. Paul, Phys. Rev. B 59, R6620 (1999).
- Schilling et al. (1992) A. Schilling, H. R. Ott, and T. Wolf, Phys. Rev. B 46, 14253 (1992).
- Braunisch et al. (1993) W. Braunisch, N. Knauf, G. Bauer, A. Kock, A. Becker, B. Freitag, A. Grutz, V. Kataev, S. Neuhausen, B. Roden, et al., Phys. Rev. B 48, 4030 (1993).
- Deligiannis et al. (1997) K. Deligiannis, P. A. J. deGroot, M. Oussena, S. Pinfold, R. Langan, R. Gagnon, and L. Taillefer, Phys. Rev. Lett. 79, 2121 (1997).
- Rosenstein and Knigavko (1999) B. Rosenstein and A. Knigavko, Phys. Rev. Lett. 83, 844 (1999).
- Larkin et al. (1995) A. I. Larkin, M. C. Marchetti, and V. M. Vinokur, Phys. Rev. Lett. 75, 2992 (1995).
- Abrikosov (1957) A. A. Abrikosov, Sov. Phys. JETP 5, 1174 (1957).
- Affleck et al. (1997) I. Affleck, M. Franz, and M. H. S. Amin, Phys. Rev. B 55, R704 (1997).
- DeWilde et al. (1997) Y. DeWilde, M. Iavarone, U. Welp, V. Metlushko, A. E. Koshelev, I. Aranson, G. W. Crabtree, and P. C. Canfield, Phys. Rev. Lett. 78, 4273 (1997).
- Gammel et al. (1999) P. L. Gammel, D. J. Bishop, M. R. Eskildsen, K. Mortensen, N. H. Andsersen, I. R. Fisher, K. O. Cheon, P. C. Canfield, and V. G. Kogan, Phys. Rev. Lett. 82, 4082 (1999).
- Eskildsen et al. (1997) M. R. Eskildsen, P. L. Gammel, B. P. Barber, A. P. Ramirez, D. J. Bishop, N. H. Andersen, K. Mortensen, C. A. Bolle, C. M. Lieber, and P. C. Canfield, Phys. Rev. Lett. 79, 487 (1997).
- Eskildsen et al. (2001b) M. R. Eskildsen, A. B. Abrahamsen, D. Lopez, P. L. Gammel, D. J. Bishop, N. H. Andersen, K. Mortensen, and P. C. Canfield, Phys. Rev. Lett 86, 320 (2001b).
- (33) When we extrapolate the specific heat data from above the H1 transition temperature (= 6.15 K) and consider them as a background, the feature at H1 can be considered as a decrease.