Competing crystal structures in La0.5Ca0.5MnO3: conventional charge order versus Zener polarons
Abstract
Equilibrium crystal structures for La0.5Ca0.5MnO3 have been calculated using hybrid exact exchange and density functional methods. Two distinct ground states with either conventional checkerboard charge ordering or Zener polaron formation are found depending on the proportion of exact exchange used. The checkerboard state has mixed d, d and d orbital ordering and CE-type magnetic order while the Zener polaron state has d and d ordering and A-type magnetic order.
pacs:
75.30.Et, 75.47.Lx, 71.27.+a, 75.10.-bI Introduction
Low temperature charge ordering (CO) transitions in manganites such as La1-xCaxMnO3 are generic for doping in the range 0.4 x 0.9 Chen and Cheong (1996); Radaelli et al. (1997, 1999); Li et al. (2001); Nagai et al. (2002); Kajimoto et al. (2002); Loudon et al. (2002); Pissas and Kallias . They are observed as commensurate or incommensurate changes in unit cell dimension parallel to the crystallographic axis Loudon et al. . Commensurate structures are found when x is a rational fraction such as 1/2, 2/3 or 3/4. Half-doped manganites, A0.5B0.5MnO3 with A La, Nd, Pr and B Ca, Sr, have been widely studied as the CO phase is believed to consist of a checkerboard (CB) pattern of Mn3+ and Mn4+ ions Wollan and Koehler (1955); Goodenough (1955); Radaelli et al. (1997) in which Mn3+ ions are Jahn-Teller (JT) distorted while Mn4+ ions are not. However, there is evidence from Hartree-Fock calculations Zheng and Patterson (2003); Ferrari et al. (2003) on La0.5Ca0.5MnO3 for a Zener polaron (ZP) electronic structure in which all Mn ions have a valence of 3.5 and a recent single-crystal neutron scattering study found a ZP crystal structure for Pr0.60Ca0.40MnO3 Daoud-Aladine et al. (2002) where all Mn ions have an intermediate JT distortion. There is conflicting experimental evidence from resonant XRD experiments Grenier et al. (2004) for a CB CO pattern in Pr0.60Ca0.40MnO3 and a recent refinement of the structure of Pr0.5Ca0.5MnO3 using high resolution x-ray and neutron powder data favored a CB structure Goff and Attfield (2004). Both CB and ZP phases have been proposed to exist in a phase diagram for half-doped manganites in which the tolerance ratio for the rare earth and alkaline earth ions is varied F. Rivadulla and Goodenough (2002). Powder neutron and x-ray diffraction experiments Radaelli et al. (1997) and x-ray absorption near edge structure (XANES) Subías et al. (1997); García et al. (2001a) and resonant x-ray diffraction (RXD) García et al. (2001b) support a CB CO picture for La0.5Ca0.5MnO3.
In this Letter we use hybrid Hartree-Fock/density functional theory ab initio energy minimization calculations and show that the ground state CO crystal structure switches between CB and ZP as the percentage of Hartree-Fock (exact) exchange is varied. These two states are therefore similar in energy and the actual ground state may depend on specific A and B ions F. Rivadulla and Goodenough (2002), or even sample preparation, history and ambient conditions. The predominant difference in charge populations of the two states is in charge on O ions rather than Mn ions and so CO may be associated with O ions rather than Mn ions. Furthermore, we find that the lowest energy structure for either CO pattern has a different space group from those proposed for the CB Radaelli et al. (1997) or ZP Daoud-Aladine et al. (2002) structures. The structure that we find has modulations of Mn and O ion positions about ideal perovskite positions which are parallel to planes and transverse to the axis and are similar to those observed in layered Li et al. (2001); Nagai et al. (2002)and simple doped manganites Chen and Cheong (1996); Radaelli et al. (1997, 1999); Kajimoto et al. (2002); Loudon et al. (2002); Pissas and Kallias . A TA phonon softening mechanism for the CO transition would explain the observation of incommensurate order with wavevector = (1-x)* Loudon et al. and may also be relevant to colossal magnetoresistance (CMR) phases of manganites where diffuse satellites in x-ray scattering have been observed Nelson et al. (2001); Campbell et al. (2001) and attributed to polarons with transverse displacements of ions Campbell et al. (2001) similar to those in Fig. 1(a).
Structure optimizations were performed using the CRYSTAL program Saunders et al. . A x2x2 unit cell (Fig. 1) containing eight formula units with ferromagnetic (FM) order was used for optimizations while total energies of A and CE-type magnetically ordered structures were compared using x2x2 unit cells. A single force evaluation was carried out for CE-type magnetic order for a structure which had been optimized with FM magnetic order in order to estimate the importance of magnetoelastic effects on the crystal structure; these were found to be small. No simultaneous relaxation of unit cell dimensions was performed as the calculations are expensive in computer time; unit cell dimensions were taken from experiment Radaelli et al. (1997) (a = 5.4763 , b = 10.8932 , c = 7.5247 ). Structure optimizations were performed for 60%, 80% and 100% exact exchange (the latter is simply an unrestricted Hartree-Fock (UHF) calculation); both 60% and 80% exact exchange calculations resulted in CB CO for all space groups investigated while 100% exact exchange resulted in ZP CO structures. Initial atomic configurations were taken from Table II in Ref. [Radaelli et al., 1997] (P1121/m symmetry) or were generated by hand. As noted by Daoud-Aladine and coworkers Daoud-Aladine et al. (2002), the isotropy subgroups of the parent high temperature Pbnm phase that have a doubled unit cell along the axis are: P11m, P21nm, P1121/m, P1121/b, P21nb and P11b. The relevant isotropy subgroups for ZP CO are P21nm and P11m and for CB CO they are P1121/m Radaelli et al. (1997) and P11m.
Hessian matrices for energy minimized CB or ZP CO structures with these space groups had at least one negative eigenvalue, which indicates that they are saddle points on the potential energy surface. A further energy minimization was performed using P1211 symmetry and 100% exact exchange. The screw axis parallel to the axis naturally incorporates transverse Mn displacements found in experiment. All Hessian matrix eigenvalues were positive for this ZP CO structure and it was lower in energy than the other structures (P11m +7 meV/Mn ion; P21nm +14 meV/Mn ion). A structure optimization with 60% exact exchange and Pn21m symmetry resulted in a stable CB CO structure which was 31 meV/Mn ion lower than the optimized structure with P1121/m symmetry. Fractional coordinates for the lowest energy CB and ZP CO structures found, which have Pn21m symmetry, are given in Table 1. Fractional coordinates for the La0.5Ca0.5MnO3 ZP CO structure are compared to those determined by neutron scattering for Pr0.60Ca0.40MnO3 Daoud-Aladine et al. (2002) in Table 2.
| 100% | 60% | ||||||
|---|---|---|---|---|---|---|---|
| Atom | Wyck. | x | y | z | x | y | z |
| Ca1 | 2a | 0.4773 | 0.8866 | 0.0000 | 0.4861 | 0.8866 | 0.0000 |
| La2 | 2a | 0.4652 | 0.3732 | 0.0000 | 0.4514 | 0.3673 | 0.0000 |
| La3 | 2a | 0.9760 | 0.1226 | 0.5000 | 0.9743 | 0.1261 | 0.5000 |
| Ca4 | 2a | 0.9789 | 0.5985 | 0.5000 | 0.9779 | 0.6057 | 0.5000 |
| Mn1 | 4b | 0.0000 | 0.8746 | 0.2445 | 0.0000 | 0.8713 | 0.2478 |
| Mn2 | 4b | 0.4578 | 0.6224 | 0.2534 | 0.4811 | 0.6231 | 0.2535 |
| O1 | 4b | 0.2463 | 0.0069 | 0.2109 | 0.2352 | 0.9977 | 0.2109 |
| O2 | 4b | 0.2556 | 0.7600 | 0.2112 | 0.2676 | 0.7600 | 0.2144 |
| O3 | 4b | 0.1813 | 0.2315 | 0.2042 | 0.2118 | 0.2433 | 0.2146 |
| O4 | 4b | 0.7479 | 0.9891 | 0.2753 | 0.7539 | 0.9970 | 0.2717 |
| O1’ | 2a | 0.4298 | 0.1255 | 0.5000 | 0.4320 | 0.1055 | 0.5000 |
| O2’ | 2a | 0.5550 | 0.1309 | 0.0000 | 0.5430 | 0.1337 | 0.0000 |
| O3’ | 2a | 0.0443 | 0.3645 | 0.5000 | 0.0316 | 0.3611 | 0.5000 |
| O4’ | 2a | 0.9054 | 0.3770 | 0.0000 | 0.9012 | 0.3625 | 0.0000 |
| LCMO | PCMO | ||||||
|---|---|---|---|---|---|---|---|
| Atom | Wyck. | x | y | z | x | y | z |
| Ca1 | 2a | 0.4769 | 0.9021 | 0.0000 | 0.5121 | 0.8936 | 0.0000 |
| La2 | 2a | 0.4783 | 0.3723 | 0.5000 | 0.4784 | 0.3614 | 0.5000 |
| La3 | 2a | 0.9832 | 0.1286 | 0.0000 | 0.9977 | 0.1426 | 0.0000 |
| Ca4 | 2a | 0.9741 | 0.6093 | 0.5000 | 0.9905 | 0.6088 | 0.5000 |
| Mn1 | 4b | 0.0000 | 0.8743 | 0.2498 | 0.0000 | 0.8756 | 0.2489 |
| Mn2 | 4b | 0.9611 | 0.3775 | 0.7518 | 0.9795 | 0.3746 | 0.7492 |
| O1 | 4b | 0.2717 | 0.9980 | 0.2768 | 0.3044 | 0.9845 | 0.2861 |
| O2 | 4b | 0.6918 | 0.2685 | 0.7837 | 0.7090 | 0.2676 | 0.7891 |
| O3 | 4b | 0.1818 | 0.2261 | 0.7029 | 0.2112 | 0.2328 | 0.7148 |
| O4 | 4b | 0.7324 | 0.5211 | 0.2276 | 0.7515 | 0.5191 | 0.2110 |
| O1’ | 2a | 0.4344 | 0.1246 | 0.0000 | 0.4353 | 0.1125 | 0.0000 |
| O2’ | 2a | 0.5575 | 0.1322 | 0.5000 | 0.5743 | 0.1321 | 0.5000 |
| O3’ | 2a | 0.0375 | 0.3644 | 0.0000 | 0.0562 | 0.3758 | 0.0000 |
| O4’ | 2a | 0.9247 | 0.3777 | 0.5000 | 0.9104 | 0.3846 | 0.5000 |
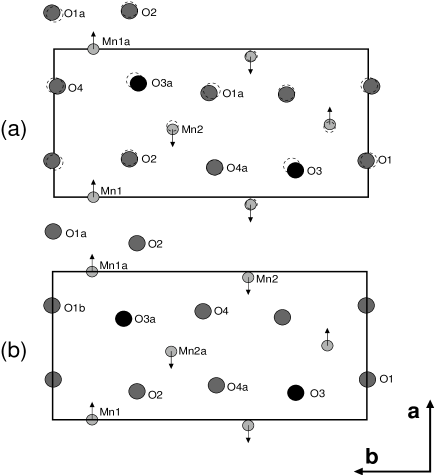
Fig. 1(a) shows atomic positions for nearly coplanar Mn and O ions projected onto the plane in the Pn21m energy minimized structure. Positions of ions in the ZP CO structure are indicated by shaded or filled circles and positions of ions in the CB CO structure are indicated by dashed lines (Table 1). The structures are coincident at the Mn1 ion positions and so this figure facilitates comparison of distortions in the plane. The main differences in ion position occur at the Mn2 and O3 positions to accommodate the switch between ZP and CO JT distortion patterns. Transverse wavelike modulations of Mn and O ion positions about ideal perovskite positions can be identified in Fig. 1(a). Modulations of either ion type have wavelength equivalent to the unit cell dimension along the axis and are out of phase by and are similar to modulations of MnO6 proposed in manganites with x 0.5 Nagai et al. (2002) and x 0.5 Campbell et al. (2001).
Positions of ions in the energy minimized P21nm structure with ZP CO are shown in Fig. 1(b). The main differences in atomic positions in the plane between this ZP CO structure and the Pn21m ZP CO structure occur at the O2 and O3 positions. Fractional coordinates for the P21nm structures for both La0.5Ca0.5MnO3 (this work) and for Pr0.60Ca0.40MnO3 Daoud-Aladine et al. (2002) are compared in Table 2 and the agreement is remarkable. The starting guess for the La0.5Ca0.5MnO3 structure in ab initio calculations was not the Pr0.60Ca0.40MnO3 structure and the coordinates obtained via ab initio calculations are not simply a relaxation of the Pr0.60Ca0.40MnO3 structure. There are bonds of intermediate length along the ZP axis ranging from 1.99 to 2.09 in ab initio calculations and from 1.98 to 2.05 in experiment Daoud-Aladine et al. (2002) (Table 3). Bond valence sums Brown (1992) (calculated using Ro and B values of 1.750 and 0.37 for all Mn-O bonds) for the ZP structures are close to 3.5 in both computed and experimental ZP structures, which is indicative of an intermediate valence. The Mn-O--Mn bond angle is 160o or less in both La0.5Ca0.5MnO3 and Pr0.60Ca0.40MnO3.

| Bond | CB11footnotemark: 1 | ZP22footnotemark: 2 | Bond | ZP33footnotemark: 3 | ZP 44footnotemark: 4 |
|---|---|---|---|---|---|
| Mn1a-O1a | 1.92 | 1.99 | Mn1a-O1a | 2.01 | 2.05 |
| Mn1a-O4 | 1.86 | 1.87 | Mn1a-O1b | 1.86 | 1.88 |
| Mn1a-O2 | 1.91 | 1.89 | Mn1a-O2 | 1.91 | 1.91 |
| Mn1a-O3a | 1.84 | 2.05 | Mn1a-O3a | 2.08 | 1.98 |
| Mn2-O2 | 1.91 | 1.89 | Mn2a-O2 | 1.90 | 1.90 |
| Mn2-O3a | 2.14 | 2.09 | Mn2a-O3a | 2.09 | 2.01 |
| Mn2-O1a | 1.92 | 1.86 | Mn2a-O4 | 1.88 | 1.90 |
| Mn2-O4a | 2.15 | 2.03 | Mn2a-O4a | 2.02 | 2.03 |
| Bond angle | 160 | 155 | 151 | 159 | |
| BVS Mn1 | 3.28 | 3.60 | 3.60 | 3.5 44footnotemark: 4 | |
| BVS Mn2 | 4.08 | 3.56 | 3.53 | 3.5 44footnotemark: 4 |
La0.5Ca0.5MnO3 Pn21m symmetry, 60% exact exchange
22footnotemark: 2La0.5Ca0.5MnO3 Pn21m symmetry, 100% exact exchange
33footnotemark: 3La0.5Ca0.5MnO3 P21nm symmetry, 100% exact exchange
44footnotemark: 4Pr0.60Ca0.40MnO3 P21nm symmetry, expt. (Ref. Daoud-Aladine et al. (2002))
The spin density and charge density difference of the ZP CO structure are shown in Fig. 2. Charge density difference plots are generated by subtracting densities of isolated O2- and Mn4+ ions from the total charge density of the crystal structures and therefore show deformations of charge density at O ion sites and eg orbital order at Mn ion sites. Each Mn ion in the ZP CO state has a d4 configuration, O- ions order in Mn(d4)-O--Mn(d4) dimers (Zener polarons) in planes and the magnetic ground state is A-type Zheng and Patterson (2003). UHF calculations Zheng and Patterson (2003) predict a magnetic moment of 0.7 on the O- ion in the center of each ZP, which is opposed to the moments of neighboring ZP Mn ions. On the other hand, cluster configuration interaction (CI) calculations Patterson show that the moment on O- ions is much less than 0.7 . However they show that the charge on these ions is approximately -1.0e, in agreement with UHF calculations and that the ZP are strongly bound in a FM state. In both UHF and CI calculations the total magnetic moment on each ZP is 7/2 in agreement with experiment Loudon et al. (2002). The reason for the discrepancy between spin distributions in CI and UHF calculations is simply that the UHF spin function for the Mn-O- bond is whereas it should be . d and d orbital order in the ZP state can clearly be seen in Fig. 2 in both spin density and charge density difference plots.

Bond lengths, the Mn1a-O3a-Mn2 bond angle and bond valence sums for the CB state with Pn21m symmetry are given on the left in Table 3. Spin densities and charge density differences are given in Fig. 3. The ground state magnetic order for the CB CO state is CE-type, the magnetic order found experimentally in La0.5Ca0.5MnO3 Radaelli et al. (1997), and it consists of zig-zag FM chains as shown in Fig. 3. Mn1 ions in the chains have short (1.85) Mn-O bonds while JT distorted Mn2 ions have long Mn-O bonds (2.15). These are, respectively, the lengths of Mn-O bonds in CaMnO3 and LaMnO3 Wollan and Koehler (1955); Rodriguez-Carvajal et al. (1998). The magnetic moments on these ions are 3.23 (Mn1) and 3.85 (Mn2) and bond valence sums are 3.28 and 4.08. All of these are characteristic of conventional CO, although charges on Mn ions as measured by Mulliken populations are essentially identical, with values of +2.02 (Mn1) and +2.02 (Mn2). A small difference in Mn ion charge has been noted in several experimental papers Grenier et al. (2004); Goff and Attfield (2004) in apparently CO states.
In summary, we have shown that the equilibrium structure for La0.5Ca0.5MnO3 which is predicted by hybrid Hartree-Fock/density functional theory depends on the percentage of exact exchange used in the calculation. The CB CO state consists of FM zig-zag chains in which corner (Mn1) ions have short bonds (1.85) while JT distorted (Mn2) ions have long bonds (2.15) to neighboring O ions. A preliminary calculation of the RXD spectrum using this structure is in reasonably good agreement with experimental RXD spectra for Pr0.60Ca0.40MnO3 Grenier . The ZP CO state consists of FM planes tiled with polarons which have Mn-O bonds of intermediate length along the polaron axis and this structure is in reasonable agreement with that found for Pr0.60Ca0.40MnO3 by neutron scattering Daoud-Aladine et al. (2002). Transformation from the CB to the ZP state requires rehybridization at Mn1 and O3 sites together with relatively minor displacements shown in Fig. 1(a). Effective magnetic moments from magnetic susceptibility data for at least two mixed valence manganites display marked increases in effective magnetic moment on cooling below the CO transition temperature to 6.1 Prodi et al. (2004) or 7.9 Daoud-Aladine et al. (2002). These magnitudes are similar to the ZP magnetic moment of 7 . Dimerization of CE zig-zag chains to form a ZP state may produce this large effective moment.
Acknowledgements.
This work was supported by the Irish Higher Education Authority under the PRTLI-IITAC2 programme. The author wishes to acknowledge discussions with P.G. Radaelli, A. Daoud-Aladine and S. Grenier.References
- Chen and Cheong (1996) C. Chen and S.-W. Cheong, Phys. Rev. Lett. 76, 4042 (1996).
- Radaelli et al. (1997) P. G. Radaelli, D. E. Cox, M. Marezio, and S.-W. Cheong, Phys. Rev. B 55, 3015 (1997).
- Radaelli et al. (1999) P. G. Radaelli, D. E. Cox, L. Capogna, S.-W. Cheong, and M. Marezio, Phys. Rev. B 59, 14440 (1999).
- Li et al. (2001) J. Li, C. Jin, and H. Zhao, Phys. Rev. B 64, R20405 (2001).
- Nagai et al. (2002) T. Nagai, T. Kimura, A. Yamazaki, T. Asaka, K. Kimoto, Y. Tokura, and Y. Matsui, Phys. Rev. B 65, R60405 (2002).
- Kajimoto et al. (2002) R. Kajimoto, H. Yoshizawa, Y. Tomioka, and Y. Tokura, Phys. Rev. B 66, R180402 (2002).
- Loudon et al. (2002) J. C. Loudon, N. D. Mathur, and P. A. Midgley, Nature 420, 797 (2002).
- (8) M. Pissas and G. Kallias, eprint cond-mat/0205410.
- (9) J. C. Loudon, S. Cox, A. J. Williams, J. P. Attfield, P. B. Littewood, P. A. Midgley, and N. D. Mathur, eprint cond-mat/0308501.
- Wollan and Koehler (1955) E. O. Wollan and W. C. Koehler, Phys. Rev. 100, 545 (1955).
- Goodenough (1955) J. B. Goodenough, Phys. Rev. 100, 564 (1955).
- Zheng and Patterson (2003) G. Zheng and C. H. Patterson, Phys. Rev. B 67, 220404(R) (2003).
- Ferrari et al. (2003) V. Ferrari, M. Towler, and P. Littlewood, Phys. Rev. Lett. 91, 227202 (2003).
- Daoud-Aladine et al. (2002) A. Daoud-Aladine, J. Rodriguez-Carvajal, L. Pinsard-Gaudart, M. T. Fernandez-Diaz, and A. Revcolevschi, Phys. Rev. Lett. 89, 97205 (2002).
- Grenier et al. (2004) S. Grenier, J. Hill, D. Gibbs, K. Thomas, M. v. Zimmermann, C. Nelson, V. Kiryukhin, Y. Tokura, Y. Tomioka, D. Casa, et al., Phys. Rev. B 69, 134419 (2004).
- Goff and Attfield (2004) R. J. Goff and J. P. Attfield, Phys. Rev. B 70, 140404R (2004).
- F. Rivadulla and Goodenough (2002) J.-S. Z. F. Rivadulla, E. Winkler and J. Goodenough, Phys. Rev. B 66, 174432 (2002).
- Subías et al. (1997) G. Subías, J. García, M. Proietti, and J. Blasco, Phys. Rev. B 56, 8183 (1997).
- García et al. (2001a) J. García, M. C. Sánchez, G. Subías, and J. Blasco, J. Phys. Condens. Matt. 13, 3229 (2001a).
- García et al. (2001b) J. García, M. C. Sánchez, J. Blasco, G. Subías, and M. G. Proietti, J. Phys. Condens. Matt. 13, 3243 (2001b).
- Nelson et al. (2001) C. Nelson, M. v. Zimmermann, Y. Kim, J. Hill, D. Gibbs, V. Kiryukhin, T. Koo, S.-W. Cheong, D. Casa, B. Keimer, et al., Phys. Rev. B 64, 174405 (2001).
- Campbell et al. (2001) B. Campbell, R. Osborn, D. Argyriou, L. Vasiliu-Doloc, J. Mitchell, S. Sinha, U. Ruett, C. Ling, Z. Islam, and J. Lynn, Phys. Rev. B 65, 014427 (2001).
- (23) V. R. Saunders, R. Dovesi, C. Roetti, M. Causá, R. Orlando, C. M. Zicovich-Wilson, N. M. Harrison, K. Doll, B. Civalleri, I. Bush, et al., eprint Crystal03 User’s Manual, University of Torino, Torino, 2003. (www.crystal.unito.it).
- Brown (1992) I. D. Brown, Acta Crystallogr. B 48, 553 (1992).
- (25) C. H. Patterson, eprint Mol. Phys. (Accepted for publication).
- Rodriguez-Carvajal et al. (1998) J. Rodriguez-Carvajal, M. Hennion, F. Moussa, A. H. Moudden, L. Pinsard, and A. Revcolevschi, Phys. Rev. B 57, R3189 (1998).
- (27) S. Grenier, eprint Private communication.
- Prodi et al. (2004) A. Prodi, E. Gilioli, A. Gauzzi, F. Licci, M. Marezio, F. Bolzoni, Q. Huang, A. Santoro, and J. W. Lynn, Nature Mater. 3, 48 (2004).