Also at ]Institute of Physics, Slovak Academy of Sciences, 84228 Bratislava, Slovakia
Cohesive energies of Fe-based glass-forming alloys
Abstract
We calculate the cohesive energies of Fe-based glass-forming alloys in the B-Fe-Y-Zr quaternary system. Our ab-initio calculations fully relax atomic positions and lattice parameters yielding enthalpies of mixing at T=0K. We examine both the known equilibrium and metastable phases as well as a selection of plausible structures drawn from related alloy systems. This method, generally reproduces experimentally determined phase diagrams while providing additional information about energetics of metastable and unstable structures. In particular we can identify crystalline structures whose formation competes with the metallic glass. In some cases we identify previously unknown structures or observe possible errors in the experimental phase diagrams.
pacs:
61.50.Lt,61.43.Dq, 71.20.Be, 81.30.BxI Introduction
Calculation of alloy phase diagrams from first-principles is necessary to achieve the goal of materials by design Olson (2000). Bulk metallic glass-forming alloys, which often contain three or more chemical elements provide a useful test case. Recently discovered many-component alloysInoue et al. (1990); Peker and Johnson (1993); He et al. (1996) solidify in amorphous structures at relatively low cooling rates. These materials display intriguing and potentially useful mechanical properties including nearly perfect elasticityJohnson (1999). Amorphous Fe-based alloys are interesting for both their structural and their magnetic properties. Achieving bulk glass formation could extend the range of potential applications of these materials.
To understand factors limiting bulk glass formation, we perform ab-initio total energy calculations on the quaternary compound B-Fe-Y-Zr as well as its binary and ternary subsystems such as B-Fe and B-Fe-Zr. Our calculations use the plane-wave electronic density functional theory program VASP Kresse and Hafner (1993); Kresse and Furthmuller (1996). We identify the crystalline structures whose formation competes with the amorphous structure of the supercooled liquid. To this end, we calculate the cohesive energies of stable, metastable and hypothetical crystal structures throughout the alloy composition space. Standard metallurgical databases Villars (1997); Massalski et al. (1990); Villars et al. (1995)list known stable and metastable structures. Chemically similar alloy systems provide hypothetical structures to test.
Cohesive energies of stable and metastable phases yield thermodynamic driving forces for crystallization. The structural complexity of these phases gives some insight into the possibility of their nucleation and growth during a rapid quench. Our main results are the identification of the structure types CFe3 (Pearson symbol oP16) and C6Cr23 (Pearson symbol cF116) as the two main competitors to the B-Fe glass. Alloying with Zr does surprisingly little to destabilize the C6Cr23 structure, while alloying instead with Y does reduce stability of this structure. On the other hand, alloying with Y stabilizes certain other ternary structures. On this basis we deduce advantageous composition ranges.
Energetically favorable structural motifs identified within these phases can be compared with structural models of the metallic glass. We identify a class of Boron coordination polyhedra related to the trigonal prism Gaskell (1978) with some distortions. These polyhedra may be arranged in many ways, some leading to simple crystal structures with very low energy but many more whose energies and local structure closely resemble the glass. We call the entire class of these structures “amorphous approximants”, by analogy with the concept of approximants to quasicrystal structures Elser and Henley (1985).
The following two sections of this paper (sections II and III) present our calculational methods and the resulting cohesive energy data. Although we study here Fe-based glass-forming alloy systems, our basic method can be applied to any alloy system. Besides checking known experimental phase diagrams, our calculations provide energetic information which is often not known experimentally, especially in the case of metastable and amorphous structures. In addition, we propose likely structures for compounds whose existence was known but whose structures were unknown, for example, B4Fe4Y, B4FeY and B6Fe2Y5. Conversely, in some cases our results call into question details of the established phase diagrams. For example: the claimed high temperature stability of BZr is most likely only metastability in reality; the Co7Y2 structure may be stable in Fe-Y though it has not been reported; the phase Fe17Y2, related to important permanent magnet materials Coey (1996), is possibly only a high temperature phase. Further, we can predict phase diagrams of alloy systems such as B-Y-Zr, Fe-Y-Zr and B-Fe-Y-Zr that have not been established experimentally.
II Methods
Our interest in the binary B-Fe and ternary B-Fe-Zr and B-Fe-Y compounds led to the study of all elemental, binary, ternary and quaternary combinations of the elements B-Fe-Y-Zr. We selected structures for study that are known as stable or metastable structures in the phase diagrams of these alloy systems or chemically similar alloy systems. For example we consider known C-Fe structures (e.g. CFe3.oP16) with B replacing C, etc. Our notation for structure type is to first give the prototype (some familiar isostructural compound, e.g. CFe3) followed by the Pearson symbol (indicating the point symmetry, centering information, and number of atomic sites per unit cell, e.g. oP16 for orthorhombic Primitive 16-atom cell).
Our sources for established phase diagrams and structures include standard references Villars (1997); Massalski et al. (1990); Villars et al. (1995), individual publications and private communication. Information from these sources has been compiled into a database containing over 1000 structures that we search to match criteria such as chemical elements, stoichiometry, and atomic size ratios. Some additional structures examined are liquid and amorphous structures, obtained from ab-initio molecular dynamics simulation.
Our ab-initio calculations use the program VASP (version 4.5.5) together with the projector-augmented wave method, an all-electron generalization of the pseudopotential approach Blochl (1994); Kresse and Joubert (1999). We employ the Perdew-Wang generalized gradient approximation Perdew and Wang (1992) (GGA) exchange-correlation functional with the Vosko-Wilkes Nussair Vosko et al. (1980) spin interpolation. These choices give excellent results for bulk elemental Fe Kresse and Joubert (1999). GGA is needed instead of LDA is necessary to properly reproduce magnetization and lattice constants Moroni et al. (1997). Our magnetic calculations are spin-polarized (i.e. collinear magnetization) and are employed for any structure containing 50% Fe or higher.
VASP solves for the self-consistent electronic structure in reciprocal space, using a plane wave basis. It requires that we choose the reciprocal space grid appropriately and demonstrate convergence in the number of k-points used and the plane wave energy cutoff. We construct k-point grids whose spacing is nearly isotropic in reciprocal space. Mostly we use Monkhorst-Pack grids, although for hexagonal structures we use Gamma-centered grids. Our k-point density is sufficient that all structural energies are converged to a precision of 10 meV/atom or better. All energies for structures that lie on or near the convex hull are converged to a precision of 1 meV/atom or better.
In general our relaxations allow variations of cell volume and shape, as well as atomic displacements, consistent with the symmetry of the starting structure. Relaxations run until an accuracy of 1meV/atom or better is reached. During relaxation we use Methfessel-Paxton Fermi-surface smearing with width 0.2 eV (the VASP default choice Kresse and Furthmuller (2003). When smearing is employed we report the energy (extrapolated to zero smearing), not the fictitious free energy. For many structures on or near the convex hull, we recalculated the energy of our best-relaxed structure using the tetrahedron method without smearing. This test confirms we reached our 1 meV/atom precision goal.
Table 1 demonstrates convergence with respect to k-point grid and plane wave cutoff energy, reporting the energies of two metastable variants of Fe3B, one with structure type Fe3C.oP16 and one with structure type Ni3P.tI32. We see how energies and energy differences converge as the k-point mesh grows at fixed energy cutoff. The energy difference at low precision has even the incorrect sign, while medium and high precision agree to within the desired 1meV/atom accuracy. For the results presented below we employ a constant energy cutoff of 319 eV, consistent with medium precision.
Certain calculated structural quantities can be compared directly with experiment. For example, for Fe3B.oP16 we obtain converged volume 9.78 Å3/atom, and compared with the experimental values, respectively, of 10.09 Å3/atom, 1.22 and 1.51. Likewise, for Fe3B.tI32 we find volume 9.61 Å3/atom and compared with experimental values 10.06 Å3/atom and 2.01. Our underestimation of the volume reflects both thermal expansion (experimental volumes are at room temperature, while our calculations are for T=0K ground states) and known systematic errors associated with density functional theory.
| Param | FeC.oP16 | Ni3P.tI32 | ||||
|---|---|---|---|---|---|---|
| grid | M | E | M | E | ||
| 1 | 239 | 1.38 | -8.1227 | 0.37 | -8.1073 | 0.0155 |
| 10 | 239 | 1.16 | -7.9698 | 0.80 | -7.9283 | 0.0415 |
| 20 | 239 | 1.29 | -8.0460 | 1.33 | -8.0519 | -0.0059 |
| 28 | 239 | 1.22 | -7.9870 | 1.27 | -7.9899 | -0.0029 |
| 36 | 239 | 1.20 | -7.9629 | 1.26 | -7.9656 | -0.0027 |
| 44 | 239 | 1.20 | -7.9554 | 1.26 | -7.9572 | -0.0017 |
| 52 | 239 | 1.20 | -7.9525 | 1.25 | -7.9543 | -0.0018 |
| 1 | 319 | 1.38 | -8.1725 | 0.82 | -8.0873 | 0.0852 |
| 10 | 319 | 1.51 | -8.0683 | 1.33 | -8.0365 | 0.0318 |
| 20 | 319 | 1.49 | -8.0430 | 1.38 | -8.0428 | 0.0002 |
| 28 | 319 | 1.48 | -8.0441 | 1.39 | -8.0420 | 0.0020 |
| 36 | 319 | 1.49 | -8.0437 | 1.39 | -8.0409 | 0.0028 |
| 44 | 319 | 1.50 | -8.0437 | 1.39 | -8.0410 | 0.0027 |
| 52 | 319 | 1.50 | -8.0437 | 1.39 | -8.0411 | 0.0026 |
| 1 | 398 | 1.38 | -9.1688 | 1.43 | -8.0991 | 0.0696 |
| 10 | 398 | 1.50 | -8.0667 | 1.51 | -8.0667 | 0.0334 |
| 20 | 398 | 1.48 | -8.0382 | 1.38 | -8.0383 | -0.0001 |
| 28 | 398 | 1.48 | -8.0390 | 1.39 | -8.0372 | 0.0018 |
| 36 | 398 | 1.48 | -8.0386 | 1.38 | -8.0362 | 0.0025 |
| 44 | 398 | 1.49 | -8.0386 | 1.39 | -8.0362 | 0.0024 |
| 52 | 398 | 1.49 | -8.0386 | 1.39 | -8.0363 | 0.0023 |
The composition space of an -component alloy is a set of composition variables obeying . The set forms an dimensional simplex (respectively, a point, line segment, triangle and tetrahedron for ). Structural energies form a scatter-plot over this simplex. Stable low temperature phases lie on vertices of the convex hull of the energy versus composition scatter-plot. Edges and facets of the convex hull represent coexistence regions of the phases at adjoining vertices. Lines and triangles joining low temperature phases phases will be referred to as tie-lines and tie-planes. A tie-surface in general refers to the hyperplane joining or fewer points in the -component energy scatter-plot.
The tie-surface connecting all pure elements in their lowest energy structures forms a useful reference for alloy energies. The distance of an alloy energy from the tie-surface joining pure elements is known as its enthalpy of formation (enthalpy because volume relaxation means we work at fixed pressure, ). Strong compound formation is reflected in large negative enthalpy of formation.
High temperature phases should lie above the convex hull, but be sufficiently close that entropic effects (e.g. phonons or chemical substitution) can stabilize them. Metastable phases also should lie close to the convex hull, so that their free energy is less than the liquid free energy at temperatures below freezing. Although is usually negative for high temperature and metastable phases, their energy difference from the convex hull is small and positive. The value of is a measure of the thermodynamic driving force for decomposition into the appropriate combination of stable phases.
Using these methods, we built a database of structural energies. For a given -component alloy system of interest we extract from our database energies of structures containing all, of just some, of the chosen elements. We use a standard convex hull program (qhull Barber et al. (1996)) to identify stable structures and the coexistence regions that connect them. Based on the output of this program, we calculate values of and for every structure.
Our methods introduce systematic errors associated with the PAW implementation and even with the underlying density functional theory. Provided these errors vary smoothly with composition, the identity of convex hull vertices will not be affected in most cases. However, the tie-lines, tie-planes, etc. grow progressively more sensitive to error. It is probable that even when we correctly identify the stable phases, we may misidentify their coexistence regions.
Previous workers carried out analogous studies, though mainly on binary alloys. Hafner Hafner (1987) wrote a general introduction to the subject of ab-initio alloy phase diagram prediction. Miedema, de Boer and coworkers de Boer et al. (1988) performed extensive semi-empirical analysis of binary alloy systems, including almost all binary alloys of Fe Boom et al. (1983). Others Asta et al. (1999); Sluiter and Kawazoe (2002); V. Ozolins and Zunger (1998) take more rigorous approaches, sometimes including finite temperature effects of vibrational and configurational entropy. Many cohesive energy calculations have been collected in online databases HLS ; NIM ; MS . All the data we present here, and a great deal more, can be found on the WWW all .
III Results
The -component B-Fe-Y-Zr quaternary alloy system contains many subsystems: four pure elements, six binary alloy systems and four ternaries. This section presents our results in order of increasing number of components. We adopt alphabetical order in naming alloy systems, because this brings some order to the proliferation of chemical combinations in multicomponent systems.
In most cases we reproduce the known equilibrium and metastable phase diagrams with surprising accuracy. In a few cases lingering discrepancies may reveal limitations of our method or cast doubt on the accepted phase diagrams. In some cases where the existence of a phase was known experimentally but not its structure we suggest probable structures. Our quaternary and two of our ternary phase diagrams have never been determined experimentally.
III.1 Pure elements
Each of the four elements under study exhibits solid-solid phase transitions in addition to its melting transition, and verifying the relative energies of the different structures is a nontrivial test of our calculational method.
The precise low temperature structure of Boron is unknown. The presumed equilibrium phase, designated is rhombohedral with approximately 108 atoms per unit cell. Atomic positions are known, but there is partial occupancy and probably strong correlations among the partially occupied sites, that have not been adequately resolved.
The basic structure of -Boron (denoted B.hR105) consists of overlapping B156 clusters with icosahedral symmetry, located at the vertices of the primitive rhombohedral cell Hoard et al. (1970). The -atom cluster assembles twelve 12-atom icosahedra surrounding one central icosahedron. All icosahedra all empty. A single extra atom at the body center of the rhombohedral cell is not part of any B156 cluster. An alternate description concentrates on non-overlapping B84 clusters, obtained by removing the outer halves of the 12 outer icosahedra of B156. In addition to the B84 cluster the basic structure contains two B10 clusters connected by the extra B atom in the center of the rhombohedral primitive cell, yielding 105 atoms per unit cell.
Wyckoff positions of B.hR105 are labeled B1-B15, with the B15 site the cell center. Structural refinements Hoard et al. (1970); Hughes et al. (1963); Callmer (1977); Slack et al. (1988) find the B13 sites surrounding the B15 atom at the center of the rhombohedral cell only fractionally occupied, while an extra B16 Boron atom approximately compensates the missing electron density. The refinement by Slack Slack et al. (1988) additionally reports five other Boron sites with small occupancy factors, and proposes tentative a model for occupancy correlations. The Pearson symbol for the Slack model is hR141.
Our calculations show the basic B.hR105 structure higher in energy than the presumed metastable -B structure (B.hR12) by 25 meV/atom. We find, in agreement with Slack Slack et al. (1988) but contrary to naive assumption, that the choice of which B16 atom to insert is not correlated to the B13 site occupancy. The B16 atom lowers the total energy by as much as 8 eV per primitive rhombohedral cell, narrowing the energy difference between and boron to 11 meV/atom. Insertion of a second B16 atom, or other more complex modifications, are second-order corrections to the total energy. Our best model of the fractional occupancies additionally replaces one B13 atom by a new B19 atom (106 atoms per primitive cell), provided the B19 atom is not a nearest neighbor of the B16 atom. This model remains unstable relative to -B by meV/atom.
Pure elemental Iron passes through four solid phases, -, as temperature rises from T=0K to melting. is BCC (Pearson cI2) and ferromagnetic. At its Curie temperature it transforms to which is also BCC. At higher temperatures it transforms to , which is FCC (Pearson cF4) and finally to , again BCC, before melting. First-principles calculations Sjostedt and Nordstrom (2002) show that the magnetic ground state of -Fe is a noncollinear antiferromagnet, while at the experimental atomic volume it is a collinear antiferromagnet Herper et al. (1999). According to our calculations, the relaxed energy of this collinear antiferromagnetic structure is 81 meV/atom above the energy of -Fe.
The low temperature phases of Yttrium and Zirconium are both hexagonal (hP2) and their high temperature phases are both BCC (cI2). Our calculations agree with these facts.
III.2 Binaries
III.2.1 Fe-B
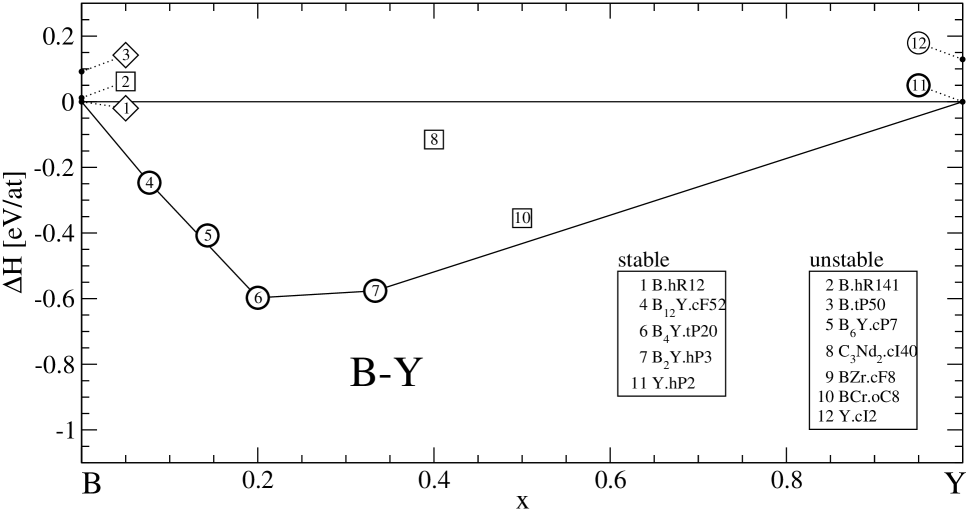
The established Fe-B phase diagram contains just two compounds, Fe2B.tI12 and BFe.oP8, each with simple structures. A number of metastable phases exist in the Fe-rich end, namely CFe3.oP16, Ni3P.tI32 and C6Cr23.cF116. These occur close to the deep eutectic at 17 % B, and hence are important competitors to glass formation.
Our calculations shown in Fig. 1 reproduce the established phase diagram perfectly, with the known stable phases lying on the convex hull and the known metastable phases lying within 20 meV/atom above (at the eutectic melting temperature of T=1447 K, a characteristic thermal energy is meV/atom). Structures occurring as stable or metastable phases in other alloy systems (but not in Fe-B) lie further above the convex hull, except for the BRe3.oC16 and CoSc3.oP32 structures. On the basis of our calculation, BRe3 and CoSc3 should occur as metastable phases in Fe-B, although they have not been reported.
A prior ab-initio study of the Fe-B structures investigating magnetism and bonding Ching et al. (1990) reported a covalent character to Fe-B and B-B bonds while the Fe-Fe bonds are metallic in nature, together with a significant charge transfer from Fe to B. Spin polarization of the B atoms is weak and opposite to the Fe atoms. Our calculations support those conclusions.
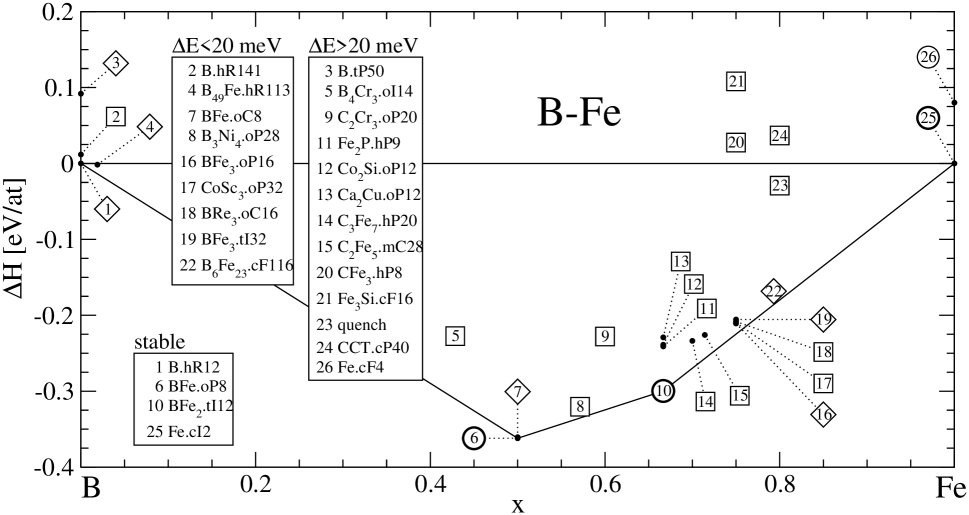
Given our perfect agreement with the established phase diagram, it is surprising that our calculated enthalpies (respectively -368 and -308 meV/atom for FeB and Fe2B) differ greatly from measured values (respectively -676 and -707 meV/atom for FeB and Fe2B Madelung (1992)). This may be due in part to the fact that our calculation are performed at T=0K while the measurements were done at T=1385K. Pure elemental Fe undergoes two phase transitions (one structural, one magnetic) as temperature drops, which could be partly responsible for this discrepancy.
One hypothesis on the glass-forming ability of Fe-B is that very simple, easy to nucleate and grow crystal structures, are destabilized by the size contrast Egami and Waseda (1984) of Fe (nominal diameter=2.48Å) and B (nominal diameter=1.80Å). We observe this principle in action in the Fe-rich end of this phase diagram. Consider a substitutional solid solution of Fe and B, around composition BFe3, based on the BCC structure of Fe. The Fe3Si.cF16 structure is a particular realization of such a structure, in which the Fe and B atoms arrange at regular positions. However, the energy of cF16 is much higher than the metastable oP16 structure, which can be reached through distortion of the cF16 lattice. It seems that the lattice strain caused by size mismatch destabilizes the BCC solid solution, converting cF16 into oP16.
We note in addition that B will not stabilize the FCC structure of Fe by substitution to form the AuCu3.cP4 structure, though such stabilization does occur with larger atoms, for example Fe3Ge.
Alternatively, B might enter as an interstitial, as indeed C enters into FCC lattices of Fe in octahedral or tetrahedral sites (respectively, in the metastable Fe3C.hP8 and Fe4C.cP5 structures). However, owing to the slightly larger size of B compared with C (nominal diameter=1.43Å), these structures are far above the convex hull in the B-Fe energy scatter plot.
It seems that only fairly complicated crystal structures exist near compositions of about 25% B. The difficulty of nucleating and growing these structures may aid in glass formability. An estimate of the thermodynamic driving force for nucleation can be obtained by comparison of three energy scales. The metastable structures are about 10-20 meV/atom above the tie-line joining Fe2B to -Fe. Further details of Fe-B structures, especially focusing on B-atom environments and the occurrence of trigonal prism structures is given in the discussion section IV.
A quenched amorphous structure at composition Fe80B20 is about 170 meV/atom above the tie-line, and the liquid is 350 meV/atom above. Candidate liquid and amorphous structures were produced by liquid state molecular dynamics on 100 atom samples using Nosé dynamics at temperature T=1500K, then quenched by conjugate gradient relaxation. Atomic displacements under relaxation are large, averaging about 0.6 Å. The liquid runs were at fixed volume, 7% greater than the volume of the quenched amorphous samples. All molecular dynamics and quenching runs were done with spin polarization, using the k-point only.
III.2.2 Fe-Zr and Fe-Y binaries
A promising glass-forming strategy is to start with a good glass-forming binary such as B-Fe, then add one or more additional elements to further destabilize any crystalline structures. Large atoms such as Zr (nominal diameter=3.18Å) and Y (nominal diameter=3.55Å) are promising because they associate well with Fe and B but they differ strongly in size from either Fe or B. Before turning to these ternary and quaternary compounds, we briefly examine the Fe-Zr and Fe-Y binaries.
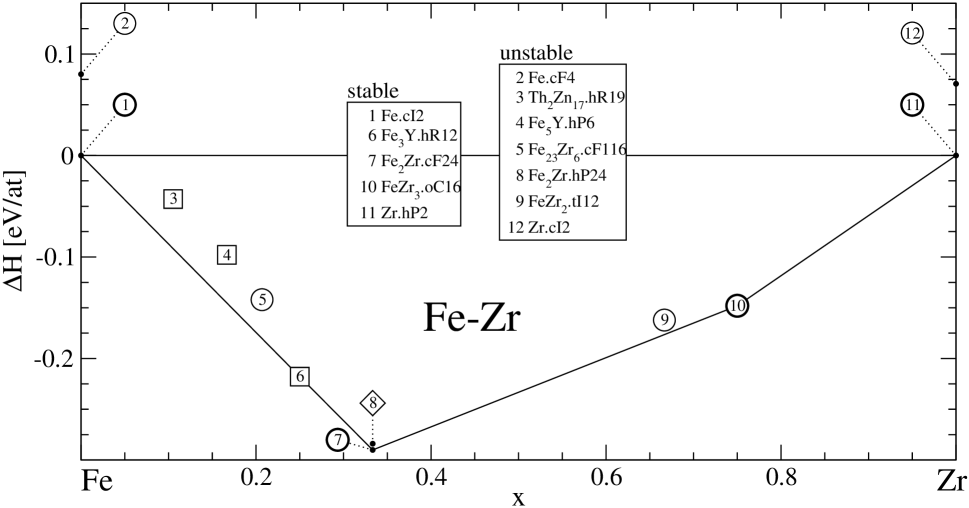
The established Fe-Zr phase diagram Okamoto (2000) contains three low temperature compounds, Fe2Zr.cF24, FeZr2.tI12 and FeZr3.oC16, one high temperature compound Fe23Zr6.cF116 (this cF116 structure is quite distinct from the C6Cr23.cF116 structure which confusingly shares the same stoichiometry and Pearson symbol) and one metastable compound Fe2Zr.hP24. Our calculation (see Fig. 2) is in excellent agreement with experiment. Every known low temperature phase lies on the convex hull, and the high temperature and metastable compounds lie close above it.
One unknown structure, Fe3Y.hR12, appears on the convex hull where no stable compound is known experimentally. Most likely this reflects an inaccuracy of our methods. Because its stability relative to the tie-line joining Fe2Zr to pure Fe is about 1 meV/atom, small errors (either calculational or arising from approximations of density functional theory) could account for this difference. Alternatively, the phase could truly be stable, but hard to observe experimentally because the driving force for its formation is weak. This matter requires further theoretical and experimental analysis, but for the study of glass formation all we care about is that its energy lies close to the tie-line from Fe2Zr to -Fe.
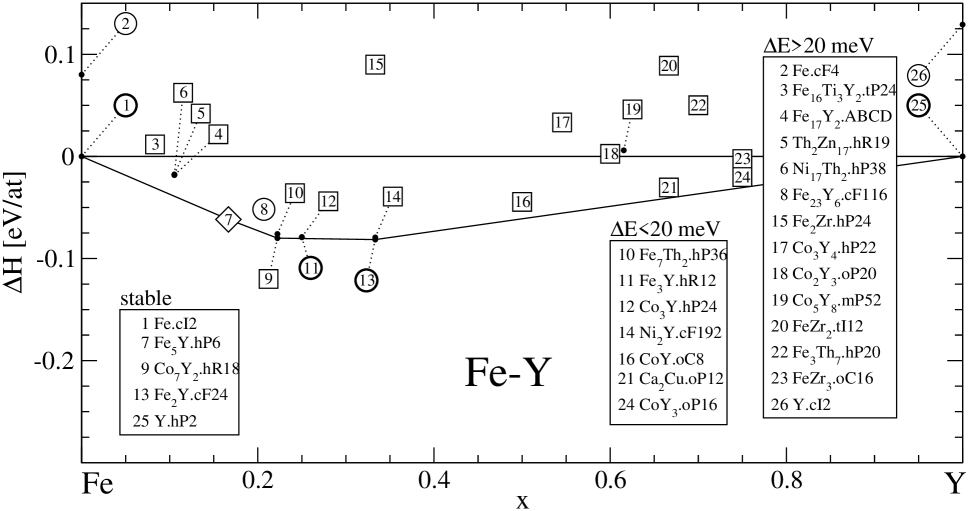
Now consider Fe-Y. The established phase diagram Okamoto (2000) contains all the same phases as Fe-Zr and two additional phases, Fe3Y.hR12 and Fe17Y2. Certain features of the phase diagram are thermodynamically improbable Okamoto and Massalski (2000, 1991). The close proximity of line compound Fe23Y6.cF116 (at low temperature) to the line compound Fe3Y.hR12 is highly unlikely. We presume that Fe23Y6.cF116 is stable at high temperatures only, where the phase diagram shows a broad composition range. The strong asymmetry of the liquidus of Fe3Y.hR12 also is improbable but we have no proposed alternative at present.
The structure of Fe17Y2 has not been properly identified, and is believed to occur in at least two variants. We follow the lead of Massalski and Okhamoto and identify these variants as Th2Zn17.hR19 (low temperature) and Ni17Th2.hP38 (high temperature). Other reported variants Villars (1997) of this phase are Fe17Ho2.hP44 and Ni19Th2.hP80. The occurrence of several structural variants, most with partial occupancy, suggest a possible entropic stabilization mechanism by structural disorder. See the synopsis of the basic structure and its degrees of freedom in the discussion section IV.
Our calculations for Fe-Y (Fig. 3) present certain disagreements in comparison with experiment. Notably, all variants of Fe17Y2 lie above the convex hull and thus are predicted as high temperature or metastable. Meanwhile, Fe5Y.hP6, believed metastable, touches the convex hull as does the unreported structure Co7Y2.hR18.
For the failure of Fe17Y2 to meet the convex hull, three possible explanations are: (1) The structure of Fe17Y2 has not yet been correctly determined (we mentioned this above and discuss it further in section IV.2); (2) Our calculations are seriously flawed and unable to properly compare the energies of Fe-Y compounds (we checked that changes in cutoff energy, pseudopotentials and exchange-correlation functional have no significant impact); (3) Fe17Y2 is only metastable or high temperature and the true low temperature state is a coexistence of Fe5Y and pure Fe.
A simple mechanism to explain high temperature stability is note that the energy of Fe17Y2 lies below the tie-line from Fe5Y to -Fe. Because -Fe is the phase with which Fe17Y2 coexists from melting down to about T=900C, it may be difficult to observe decomposition of Fe17Y2 at low temperatures where it competes instead with -Fe. This scenario suggests the possibility that other Fe-based alloy phase diagrams could be incorrect at low temperatures, which could have significance for the engineering of magnetic materials Coey (1996).
The ab-initio calculations of total energies for the Fe-Zr and Fe-Y alloys were difficult because of the complicated magnetic properties of the Fe-rich structures. We mention two important observations. (1) The Zr and Y atoms have magnetic moments pointing opposite to the Fe atoms. Moments are typically in the range of +1.8 to +2.4 for Fe and in the range of -0.2 to -0.4 for Y or Zr in spin polarized calculations. Similar values for Fe-Y alloys were reported in prior calculations Coehorn (1989) and experiments Moze et al. (1994). (2) Magnetism couples strongly with atomic volume leading to multiple self-consistent solutions of the DFT. Generally one finds: a nonmagnetic, low volume, high energy solution; a strongly magnetic, high volume, low energy solution; occasional additional solutions of intermediate magnetism, volume and energy. Presumably this is related to the strong magnetovolume effects that actually occur in Fe-rich compounds Coey (1996); Coehorn (1989).
Comparing our calculated enthalpies of formation with published experimental data Madelung (1992), we again find that our calculated values lie well below the published data, in the case of Fe-rich alloys, probably as a result of the high temperatures at which the experiments were carried out. At lower Fe-content our data is fairly consistent with the experimental data.
III.2.3 Other binaries: B-Zr, B-Y and Zr-Y
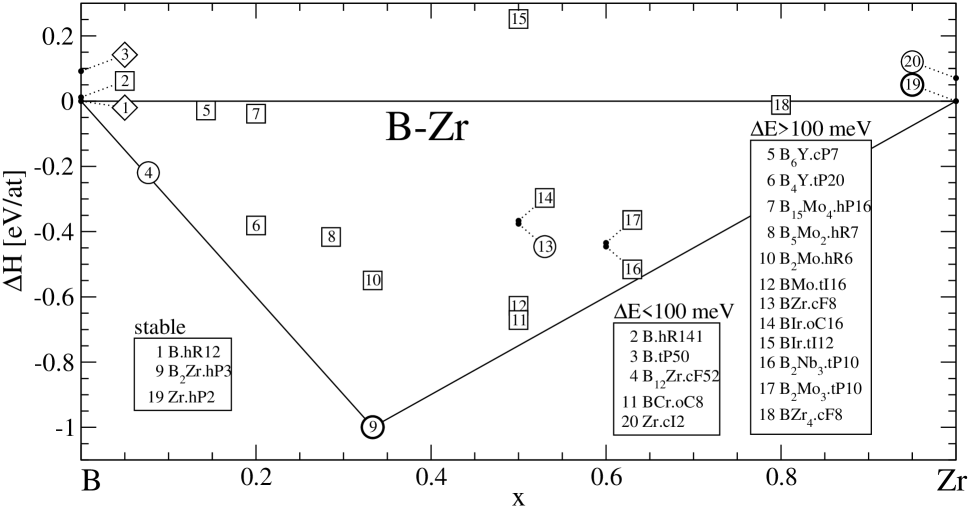
Next we turn to the B-Zr and B-Y binaries. The established B-Zr phase diagram exhibits three compounds. The well known stable phase B2Zr.hP3 is very strongly bound. The other two phases exist only at high temperatures: B12Zr.cF52 melts congruently, while BZr.cF8 exists only over an intermediate temperature range below all liquidus temperatures Glaser and Post (1953); Champion and Hagege (1992). Our calculation (Fig. 4) supports stability of B2Zr and high temperature stability of B12Zr, but strongly contradicts the existence of BZr.cF8. Indeed, at this composition the best structure we find is BCr.oC8, but that too is highly unstable. We explored nearby compositions, and even added traces of C (CZr.cF8 is a stable compound in the C-Zr binary system), but we cannot find any structure within a reasonable distance of the convex hull. Probably BZr.cF8 is a metastable structure formed during rapid quench Glaser and Post (1953); Champion and Hagege (1992).
Comparing our calculated enthalpies of formation with published data Madelung (1992) we find excellent agreement. For B12Y we calculate -219 meV/atom compared with the experimental value -213 meV/atom. The experimental data is taken at a fairly low T=298K. For B2Zr we calculate =-999 meV/atom compared with the experimental value -1074 meV/atom.
The enthalpy of B2Zr reflects strong covalent B-B bonding. Densities of states among transition-metal diboridesVajeeston et al. (2001) exhibit a strong pseudogap associated with Boron p-states. As one moves across the transition-metal series, the Fermi level falls in the pseudogap for group IVa elements (Ti/Zr,Hf), leading to strong peaks in cohesive energy. This is also the likely cause of the wide composition range of B2Nb – since Nb lies just to the right of Zr and the Fermi energy of Nb lies just to the right of the pseudogap, Nb vacancies can move the Fermi energy closer to the gap, resulting in a low vacancy formation energy.
In contrast to B-Zr, B-Y contains several B-rich phases, including B2Y.hP3 and B12Y.cF52 as in B-Zr, and additionally B4Y.tP20 and B6Y.cP7. The last one is of uncertain composition Massalski et al. (1990), with the experimental diagram showing a composition range at low temperatures, contradicting the notion that alloys should reach definite compositions as T K. We investigated Yttrium vacancies within a supercell of B6Y.cP7 and found that removal of a single Y out of 8 was favorable and lowered the value of to +15 meV/atom. Finally, there is a phase B66Y.cF1880 of whose gigantic unit cell size prevents us from calculating cohesive energy. Our calculated convex hull (Fig. 5) agrees perfectly with the experimental data except in the case of B6Y which we find is unstable at low temperature. Owing to the lack of a definite low temperature stoichiometry, B6Y most likely is unstable at low temperatures Okamoto and Massalski (2000, 1991). No experimental data is available for enthalpies of formation.
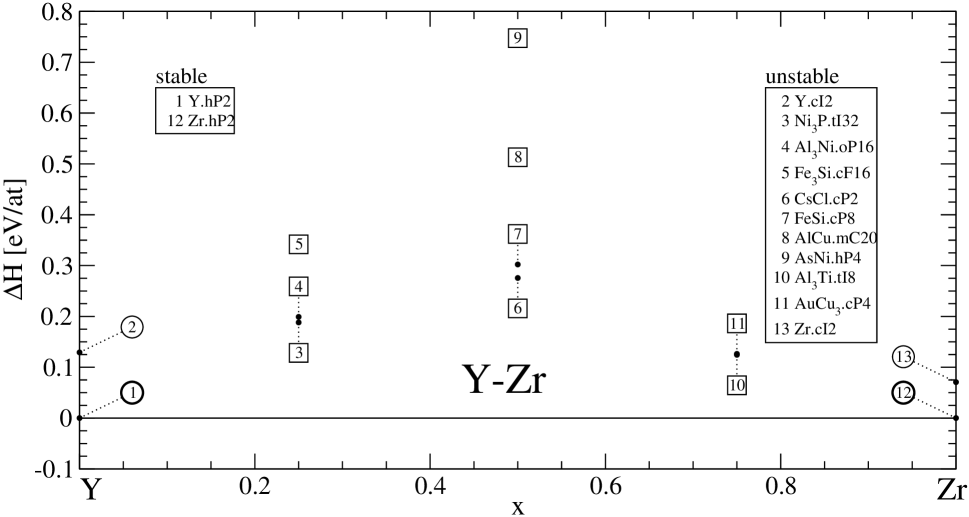
Finally, consider the Y-Zr binary (Fig. 6). The established phase diagram contains no compounds. We investigated several possibilities appropriate for their atomic size ratio and found none stable.
III.3 Ternaries
III.3.1 B-Fe-Zr and B-Fe-Y
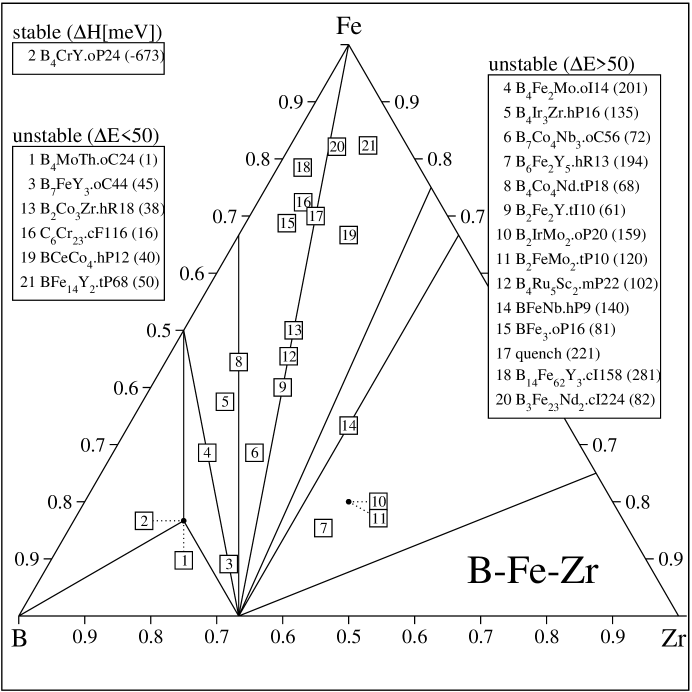
The ternary alloy system B-Fe-Zr exhibits no known ternary compounds. Our calculations (Fig. 7) generally support this, but we do identify one stable compound, with structure, B4CrY.oP24. We convert the binary structure C6Cr23.cF116 to a ternary by substituting the large Zr atoms on sites that have the largest Voronoi volume. These turn out to sites of Wyckoff type , resulting in the intrinsic ternary structure type B6Co21Zr2.cF116. Interest in this structure is motivated by its proximity to the glass-forming composition, and the metastability of this structure is discussed later in section IV. The quenched structure is, as before, a 100 atom model metallic glass reached by molecular dynamics and quenching.
The reason that B-Fe-Zr exhibits so few (i.e. just one) stable ternary compounds is that the enthalpy of formation of B2Zr is very large, as discussed above in section III.2.3. Covalent bonding of B2Zr is so strong that even Fe-rich systems find it advantageous to phase separate into a mixture of B2Zr plus Fe alloyed with which ever of Zr or B remains in excess.
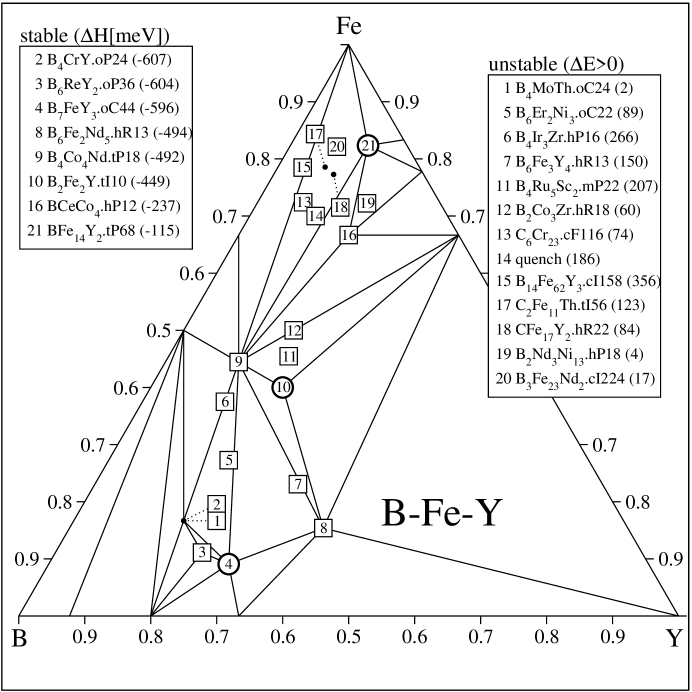
In contrast, the B-Fe-Y ternary alloy system (Fig. 8) exhibits many stable ternary compounds, because the bonding of B2Y is less strong than B2Zr. Those compounds with known structures are the Fe-rich compound BFe14Y2.tP68, and in the Fe-poor region B2Fe2Y.tI10, B6Fe3Y4.hR13, B7FeY3.oC44 and a metastable structure B14Fe62Y3.cI158. All previously known stable structures touch the convex hull. Additionally there are stable compounds of unknown or partially known structure at B3FeY2, B4Fe4Y and B4FeY. Our calculations reveal these compounds to take the structure types, respectively, B6Fe2Nd5.hR13, B4Co4Nd.tP18 and B4CrY.oP24.
Surprisingly, we find a previously unknown compound of structure type BCeCo4.hP12 on the convex hull in the Fe-rich region. Nearby we find structure type B2Nd3Ni13.hP18 just slightly higher in energy. It would be of interest to explore these compositions experimentally in more detail.
At 80% B content, we find three stable crystals in the B-Fe-Y ternary: B4CrY.oP24, B6ReY2.oP36 and B7ReY3.oC44. One of these, B4CrY.oP24, is also stable in the B-Fe-Zr ternary. All three of these structure types can be considered as approximants to decagonal quasicrystals. However, we have not identified systematic extensions toward truly quasiperiodic structures, and we are not prepared to predict the occurrence of decagonal quasicrystals in these compounds. At present no B-based quasicrystals are known. Further discussion can be found in Ref. Mihalkovič and Widom (2003).
One structure reported in the B-Fe-Y system, B14Fe62Y3.cI158, has a very high energy ( meV/atom) and large initial forces (as high as 1.7 eV/Å). Even after large atomic displacements during relaxation the energy remains very high. We believe the experimentally reported structure is incorrect.
We are impressed by the faithfulness with which our calculations reproduce systematic differences in the phase diagrams of Y- and Zr-containing alloys. Despite their adjacency in the periodic table, and the consequent similarities in atomic size, electronegativity and preferred structure types, those details on which the accepted phase diagrams do differ are almost always correctly reproduced.
III.3.2 B-Y-Zr and Fe-Y-Zr
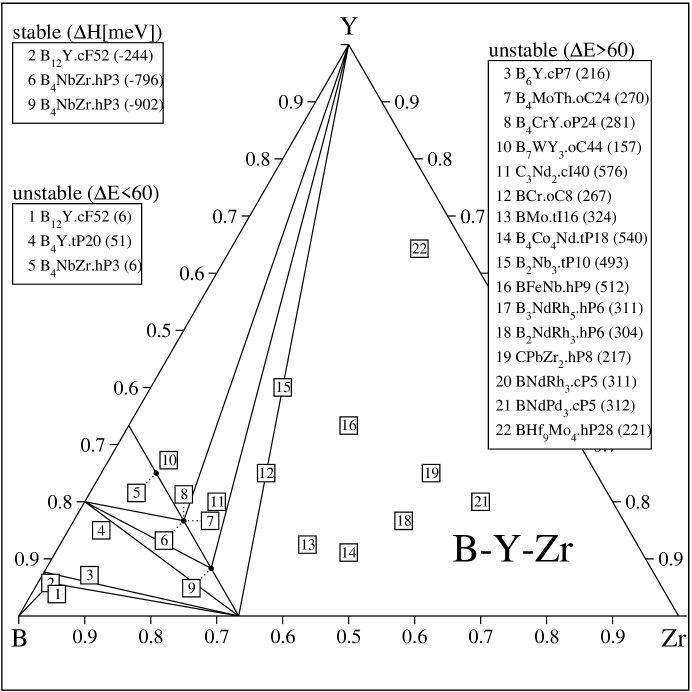
The B-Y-Zr ternary diagram has not been experimentally determined. We have explored it using the methods described above. The only stable ternary compounds we find (Fig. 10) are extensions of certain binaries into the ternary. Notably B2(Zr,Y).hP3 exhibits complete miscibility of Zr and Y in this pseudobinary structure. Additionally, B12Y.cF52 extends part way into the ternary.
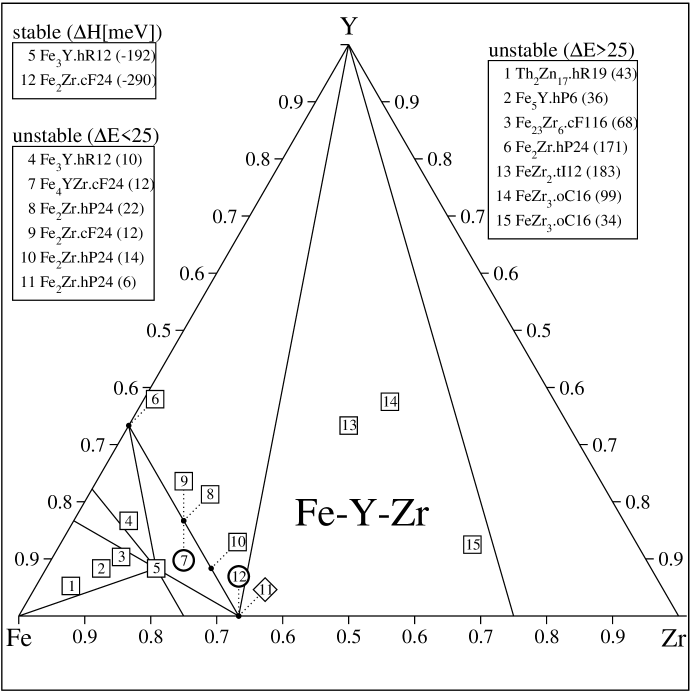
The Fe-Y-Zr ternary diagram has not been experimentally determined either. Our calculations (Fig. 9) suggest that Fe2(Y,Zr).cF24 and Fe3(Y,Zr).hR12 both extend across the full ternary diagram, but no other binaries appear to extend far into the ternary.
III.4 B-Fe-Y-Zr Quaternary
The B-Fe-Y-Zr quaternary has not been experimentally determined. No quaternary structures are reported in the standard references. We have calculated enthalpies of formation for 15 different compounds (11 structure types, some with alternate chemical occupancies) and find no stable quandaries. Our lowest energy structures are listed in Table 2. The nearest we come to stability is for the structure type B4CrY.oP24, for which is around 3-4 meV/atom for all substitutions of Y and Zr. Thus it is likely that the entire Y/Zr substitution yields equilibrium structures at high temperatures. We find 4 meV/atom for substitution of Zr for one of the two Y in BFe14Y2.tP68, suggesting significant Zr solubility at high temperatures.
Several factors contribute to the lack of stable B-Fe-Y-Zr quandaries: incompatibility of Y and Zr atoms (see Fig. 6) destabilizes quaternaries that are rich in Y or Zr; the difficulty of accommodating the slightly differing atomic sizes into the same crystal lattice site classes destabilizes quaternaries in which Y and Zr are minority species; the very strong bonding of B with Zr destabilizes quaternaries that are B-Zr-rich.
| B | Fe | Y | Zr | Structure | Comments | ||
|---|---|---|---|---|---|---|---|
| 67 | 17 | 4 | 12 | 3.1 | -653 | B4CrY.oP24 | 3Zr |
| 67 | 17 | 8 | 8 | 4.4 | -636 | B4CrY.oP24 | 3Zr |
| 67 | 17 | 12 | 4 | 3.8 | -620 | B4CrY.oP24 | 1Zr |
| 7 | 82 | 10 | 1 | 5.2 | -117 | BFe14Nd2.tP68 | 1Zr |
| 7 | 82 | 6 | 6 | 21.9 | -120 | BFe14Nd2.tP68 | 4Zr |
| 64 | 9 | 23 | 4 | 21.1 | -623 | B7FeY3.oC44 | Zr on 4c |
| 64 | 9 | 23 | 4 | 28.4 | -620 | B7FeY3.oC44 | Zr on 8f |
| 17 | 67 | 8 | 8 | 23.2 | -264 | BCeCo4.hP12 | |
| 21 | 72 | 3 | 3 | 45.9 | -210 | C6Cr23.cF116 | Y/Zr on 8c |
| 20 | 70 | 5 | 5 | 211.9 | -61 | quench |
IV Discussion
IV.1 Boron atom environments
IV.1.1 Trigonal prisms in Fe-rich B-Fe stable and metastable systems
Trigonal prisms Gaskell (1978) place six large (Fe) atoms at their six vertices, their rectangular (nearly square) faces are capped by an additional three large atoms, and they are centered by a small (B) atom. They are well known structural motifs in compounds with significant contrast in atomic size, in the large-atom-rich composition range. Too large a size contrast is unfavorable, as they do not occur in B-Y or B-Zr binaries. A stringent definition of the trigonal prism uses the (radical-planes) Voronoi construction. The Voronoi polyhedron of the central atom should have no triangular face, 3 rectangular and 6 pentagonal faces. This polyhedron is denoted (0,3,6) in the (,,…) notation of Watson and Bennett Watson and Bennett (1991).
One stable B-Fe compound, BFe.oP8 which we find marginally more stable than the BCr.oC8 prototype, contains trigonal prisms. In both structures (and also in closely related CaCu.mP20 and CaCu.oP40 structure types) Fe prisms share 2 out of 3 rectangular faces with neighboring prisms, while the third rectangular face is capped by an Fe atom. The prisms form columns along the shortest periodic direction. The structure has respectable packing fraction (greater than 0.73) when Fe/B atoms are replaced by hard spheres with radius ratio 1.55, optimizing the packing fraction.
In the Fe-rich portion of the B-Fe system (see section III.2.1), we find seven Fe-rich structures that are unstable by less than 50 meV/atom relative to the convex hull. These include the known metastable phases BFe3.oP16, BFe3.tI32 and B6Fe23.cF116, and other structures BRe3.oC16, C2Fe5.mC28, C3Fe7.oP40 and C3Fe7.hP20. Of these, the BRe3.oC16 and CoSc3.oP32 structures are sufficiently low in energy and differ sufficiently in composition from the nearest stable crystalline phases that we expect they could also occur as metastable phases. At higher B-content we find B3Ni4.oP28 at low energy and possibly metastable.
With the exception of the cF116 structure, all B atom environments in the above-mentioned structures are proper trigonal prisms. In the oP16 and oC16 structures all Fe atoms are structurally similar, each with 3 B neighbors. The oC16 structure is characterized by a unique stacking mode of the trigonal prisms, forming unterminated columns along the shortest-period -axis and sharing triangular faces. Each Fe has 2 B neighbors, and each Fe is simultaneously the vertex of one prism and a capping atom of another prism, shifted by /2. The B3Ni4.oP28 structure combines the same building blocks found in BRe3.oC16 and BFe.oP8 - columns of trigonal prisms stacked into columns either sharing triangular faces (oC16) or rectangular faces (oP8).
The stable phase BFe2, like a number of other B-TM2 binary systems, crystallizes into the Al2Cu.tI12 structure type. Viewed parallel to the shortest () axis, the structure is built by two flat layers of Fe atoms each forming a nearly regular square-triangle tiling pattern Mihalkovič and Widom (2003). Boron atoms occupy interstitial octahedral sites in the network. This topology is not optimal for packing atoms with very different sizes, so the atomic sizes must not play an important energetic role for this system. Interestingly, this is the only structure among the stable and metastable B-Fe compounds (with the exception of cF116) in which B atoms do not have trigonal-prismatic environment. Each B atom has two other B atoms only 2.1A distant, forming 1D chains along the -direction.
B atoms in the cF116 structure have the (0,5,4) Voronoi polyhedron; if we eliminate its smallest face (area 0.35Å2), it converts to an (0,8,0) environment, in which each B atom has 8 Fe neighbors. This B environment is similar to that of BFe2 except there are no B-B near neighbors. The cF116 structure is also exceptional in an uneven distribution of the B atoms in Fe matrix: while some Fe atoms (sites 4a and 8c) have no B neighbors, site 32f has two B neighbors and 48h has three.
IV.1.2 Quenched samples of Fe80B20
In the quenched samples, relaxed to the local minimum in cohesive energy at 0K, the most common B environments are: (i) trigonal prisms (0,3,6) with 9 Fe atom environments; (ii) the (0,5,4), with 8 Fe and 1 B atom environments. These occur in roughly equal proportion. The trigonal prisms are consistent with the main structures of the Fe-rich metastable phases, while the (0,5,4) environments are characteristic of the stable BFe2.tI12 structure in which B-B neighbors occur. In fact we occasionally find a B atom with two B neighbors, resulting in local environments very close to BFe2.
IV.1.3 Boron environments in Fe-rich ternaries
For B-Fe-Y, in the stable compounds BCeCo4.hP12 and BFe14Y2.tP68, as well as B2Nd3Ni13.hP18 structure (which in our calculation is unstable by just 4meV/atom), the B environment is a trigonal prism with Fe at vertices and Y capping the rectangular faces. Interestingly, in the metastable B3Fe23Nd2.cI224 (this lies just 12 meV/atom above the tieplane) the trigonal prisms come in pairs, sharing rectangular faces and creating one B-B bond per pair. In contrast, in the cF116 structure, which is nearly stable in the B-Fe-Zr system, B atoms are surrounded by Fe atoms only.
IV.2 Structure of Fe17Y2
The structure of the compound Fe17Y2 is not precisely known. Multiple structural variants have been observed, and the best structure refinements contain many partially occupied sites. The structures have close structural relationship Coey (1996) to Fe5Y.hP6 (CaCu5 prototype), in which Y atoms center hexagonal columns of Fe atoms. The columns of Y atoms (Å) form a triangular lattice with edge length Å. Starting from this structure, the Fe17Y2 family may be derived by (i) taking the superstructure defined by the vectors ; (ii) applying the substitutional rule Y2Fe. Neighboring Y atoms (separated by either or distances) should never be substituted simultaneously. This rule enforces planar hexagonal lattices of Y atoms, with apparent stacking degrees of freedom Moze et al. (1994). The Th2Zn17.hR19 prototype (also known as ) takes the stacking sequence (we denote 4Å bilayers by capital letters) with Å. The Ni17Th2.hP38 prototype (also known as ) takes the sequence with Å. The two reported refinements of Fe17Y2 (hP44 Yelon and Hadjipanayis (1992) and hP80 Averbuch-Pouchot et al. (1987)) are apparently disordered versions of -Ni17Th2.
Our calculation confirms small energy differences between the stacking variants: we find is 0.9 meV/atom higher in energy than , which in turn is 0.9 meV/atom higher in energy than the the sequence with 16Å stacking period. The sequence, which is the best we have found, leads to fractional occupancy of some Wyckoff positions in qualitative agreement with the hP44 refinement Yelon and Hadjipanayis (1992).
Experimentally reported fractional occupancies, along with occupancies of the stacking sequences we studied, are reported in Table 3. The Y2Fe substitution rule together with our assumption of a disordered “” stacking sequence, constrains site occupancies so that (Y1)+(Y2)=1, and (Fe1)+(Fe2)=1. Thus the hP44 refinement implies some Y vacancies, while the hP80 refinement places extra Fe atoms at Fe1+Fe2. We considered these possibilities, but found both of them energetically unfavorable. Therefore we believe that Fe17Y2 is the correct stoichiometry, and the mismatches in occupancy factors are artifacts of the refinement, arising from stacking disorder.
The absence of well-ordered crystalline samples further supports our proposal that the Fe17Y2 phase could be unstable at low temperatures.
| site | hP44 | hP80 | |||||
|---|---|---|---|---|---|---|---|
| Y1 | 2 | 1 | 1/2 | 3/4 | 2/3 | 0.41 | 0.71 |
| Y2 | 2 | 0 | 1/2 | 1/4 | 2/3 | 0.35 | 0.12 |
| Y3 | 2 | 1 | 1 | 1 | 2/3 | 1.0 | 1.0 |
| Fe1 | 4 | 0 | 1/2 | 1/4 | 1/3 | 0.28 | 0.29 |
| Fe2 | 4 | 1 | 1/2 | 3/4 | 1/3 | 0.71 | 0.86 |
| Feα | 4 | 0 | 0 | 0 | 1/3 | 0 | 0 |
| 21.4 | 21.4 | 20.7 | 21.0 |
IV.3 Glass formation
By inspection of our cohesive energy data we can identify the main crystal phases that are likely to compete with formation of the amorphous solid. In the vicinity of Fe80B20, the structure C6Cr23.cF116 can crystallize with almost no composition shift. However, it may be difficult to nucleate and grow such a complex crystal type during a quench, so a simpler nearby structure such as Fe3B.oP16 may be favored. In the limit of slow cooling, phase separation into pure Fe and Fe2B will occur. In fact, all these structures are reported in annealed samples of Fe-B glasses.
Alloying with Zr can be advantageous because the large and strongly interacting Zr atoms diffuse slowly Widom et al. (2002). Due to its large size, Zr strongly destabilizes the Fe3B.oP16 structure. However, we see in table 4 that Zr actually tends to stabilize slightly the C6Cr23 structure, and also risks formation of the BFe14Nd2.tP68 structure. Stabilization of the C6Cr23 structure may be counteracted with replacement of Y for Zr.
Another danger of alloying with Zr is formation of the highly stable binary B2Zr.hP3. Indeed, in the B-Fe-Zr ternary Villars et al. (1995) even Fe-rich liquids coexist with solid B2Zr. Choosing compositions with B content below the eutectic (17% B) can avoid B2Zr formation. Also, alloying with the less strongly interacting (but still very large) element Y can counteract this. However, it is not advantageous to alloy only with Y because 1) Y atoms diffuse more quickly than Zr as a result of their weaker binding; 2) There are several Fe-rich Fe-Y binary structures (e.g. Fe5Y, Fe17Y2) whose formation should be avoided. A reasonable composition that balances these difficulties is B15Fe75Y3Zr7.
| Fe3B.oP16 | C6Cr23.cF116 | BFe14Nd2.tP68 | quench | |
|---|---|---|---|---|
| B-Fe | -211 (17) | -168 (18) | +215 (268) | -29 (151) |
| B-Fe-Y | -27 (253) | -163 (74) | -115 (0) | -59 (186) |
| B-Fe-Zr | -218 (81) | -253 (16) | -116 (50) | -79 (221) |
IV.4 Canonical-cell models of amorphous approximants
Canonical cell tilings Henley (1991) (CCT) form networks of icosahedral cluster centers for models of icosahedral quasicrystals. They were motivated by the cubic “1/1” approximants of the quasicrystals, in which icosahedral clusters are located at the vertices of BCC lattice, and connected by 2-fold (“”) and 3-fold (“”) inter-cluster linkages. Linkages of -type are longer than -type linkages by the factor 2/=1.15. The -network with global icosahedral symmetry and maximal density of clusters is a tiling of four canonical cells, , , and . An -cell is the two-fold symmetric BCC-tetrahedron, -cell is a skewed rectangular pyramid, cell is a three-fold symmetric tetrahedron and -cell is a trigonal prism. The trigonal prism has equilateral triangular bases of -type linkages and rectangular faces of - and -type linkages.
Consider a model amorphous structure in which the icosahedral clusters are replaced by “large” atoms, and the largest of the cells, the trigonal prism , is decorated by a small atom in the center. Such a model appears to be entirely plausible for B-Fe, since: (i) ideal B atom environments in the -cell produce very nearly the same ratio of B-Fe/Fe-Fe nearest neighbor distances as the BFe3 compounds; (ii) provided the density of -cells is fixed by B atom content, the canonical cells models should yield optimal Fe-Fe connectivity via the and linkages, with / length ratio fixed at the BCC structure value 2/. In the limit of large unit cell size approximating an icosahedral quasicrystal, the B content of this model ranges from to 0.22, covering the best glass-forming composition range.
As a convenient and simple example of the CCT model, we consider smallest cubic approximant model containing all kinds of cells, so called “3/2” tiling with 32 CCT nodes per cubic cell, and space group. It contains 8 -cells centered by B atoms (also 72 -cells, and 32 each of - and -cells), and has composition Fe4B. This ideal model remains practically undistorted upon relaxation, and relaxes to an energy 210 meV/atom above the tie-line. B-Fe and Fe-Fe bond lengths in the model are similar to those found in the metastable crystalline compounds of similar composition. Performing Voronoi analysis we find that the Fe atom polyhedron volume is similar to that of the crystals, but the B atom polyhedron volume is larger. In the CCT model the B atom polyhedron volume is 5.03 Å3, similar to the volume of 4.9Å3 in relaxed amorphous structures but larger than the 4.6-4.7Å3 occurring in the metastable crystalline phases. Because the energies and geometry of the CCT models are close to the amorphous structure, we call the CCT models “amorphous approximants”.
V Conclusions
In conclusion, we present a method for the calculation of low temperature (T=0K) alloy phase diagrams and apply it to the study of the B-Fe-Y-Zr quaternary system. A key distinguishing feature of our approach is the establishment of two databases: one from which we draw promising structures observed in similar chemical systems; the other in which we record our calculated cohesive energies which can be quickly converted into enthalpies of formation. The first database allows us to propose and evaluate candidate structures even in alloy systems that have not been previously studied. The second allows us to quickly add a new chemical element, and re-use, for example, all our B-Fe-Zr data in the study of the B-Fe-Y-Zr quaternary.
As a result we have examined two new ternary systems (B-Y-Zr and Fe-Y-Zr) and the B-Fe-Y-Zr quaternary. We found certain binary phases extending into the new ternary systems, but no ternary phases extending into the quaternary. So far we have not discovered any stable quaternary structure. Even in previously studied binary and ternary systems we find some new results including proposed structures for previously unsolved compounds.
The broad agreement between our calculations and experimentally reported phase diagrams demands that special attention be paid where disagreements exist. These disagreements fall into certain categories: Uncertain reported structure found to have high energy (e.g. BZr.cF8); Well established experimental structure found to have high energy (e.g. Fe17Y2); Structure calculated to be stable not present in published diagram (e.g. B4CoZr in B-Fe-Zr and Co7Y2 in Fe-Y). These disagreements warrant further study, both theoretical and experimental.
On the subject of glass formation, the main motivation for this study, we identify important crystalline competitors to glass-formation and illustrate how they can be destabilized by the addition of appropriately chosen large atoms.
Acknowledgements.
We wish to acknowledge useful discussions with Libo Xie, Yang Wang, Don Nicholson, Joe Poon and Gary Shiflet. This work was supported by DARPA/ONR Grant N00014-01-1-0961.References
- Olson (2000) G. B. Olson, Science 288, 993 (2000).
- Inoue et al. (1990) A. Inoue, T. Zhang, and T. Masumoto, Mat. Trans. JIM 31, 177 (1990).
- Peker and Johnson (1993) A. Peker and W. L. Johnson, Appl. Phys. Lett. 63, 2342 (1993).
- He et al. (1996) Y. He, R. B. Schwarz, and J. I. Archuleta, Appl. Phys. Lett. 69, 1861 (1996).
- Johnson (1999) W. L. Johnson, MRS Bulletin 24, 54 (1999).
- Kresse and Hafner (1993) G. Kresse and J. Hafner, Phys. Rev. B 47, RC558 (1993).
- Kresse and Furthmuller (1996) G. Kresse and J. Furthmuller, Phys. Rev. B 54, 11169 (1996).
- Villars (1997) P. Villars, Pearson’s Handbook, Desk Edition (ASM International, Materials Park, Ohio, 1997).
- Massalski et al. (1990) T. B. Massalski et al., eds., Binary Alloy Phase Diagrams (ASM International, Materials Park, Ohio, 1990).
- Villars et al. (1995) P. Villars, A. Prince, and H. Okamoto, Handbook of ternary alloy phase diagrams (ASM International, Materials Park, Ohio, 1995).
- Gaskell (1978) P. H. Gaskell, Nature 276, 484 (1978).
- Elser and Henley (1985) V. Elser and C. L. Henley, Phys. Rev. Lett. 55, 2883 (1985).
- Coey (1996) J. M. D. Coey, ed., Rare-Earth Iron Permanent Magnets (Oxford, Oxford, 1996).
- Blochl (1994) P. Blochl, Phys. Rev. B 50, 17953 (1994).
- Kresse and Joubert (1999) G. Kresse and D. Joubert, Phys. Rev. B 59, 1758 (1999).
- Perdew and Wang (1992) J. P. Perdew and Y. Wang, Phys. Rev. B 45, 13244 (1992).
- Vosko et al. (1980) S. H. Vosko, L. Wilk, and M. Nussair, Can. J. Phys. 58, 1200 (1980).
- Moroni et al. (1997) E. . Moroni, G. Kresse, J. Hafner, and J. Furthmuller, Phys. Rev. B 56, 15629 (1997).
- Kresse and Furthmuller (2003) G. Kresse and J. Furthmuller (2003), URL http://cms.mpi.univie.ac.at/vasp.
- Barber et al. (1996) C. B. Barber, D. P. Dobkin, and H. T. Huhdanpaa, ACM Trans. Math. Software 22, 469 (1996), see web site http://www.qhull.org.
- Hafner (1987) J. Hafner, From Hamiltonians to Phase Diagrams (Springer-Verlag, Berlin, 1987).
- de Boer et al. (1988) F. R. de Boer et al., Cohesion in metals:transition metal alloys (North-Holland, Amsterdam, 1988).
- Boom et al. (1983) R. Boom, F. R. de Boer, A. K. Niessen, and A. R. Miedema, Physica 115B, 285 (1983).
- Asta et al. (1999) M. Asta et al., Phys. Rev. B 59, 14271 (1999).
- Sluiter and Kawazoe (2002) M. H. F. Sluiter and Y. Kawazoe, Europhys. Lett. 57, 562 (2002).
- V. Ozolins and Zunger (1998) C. W. V. Ozolins and Z. Zunger, Phys. Rev. B 58, R5897 (1998).
- (27) WWW site http://databases.fysik.dtu.dk/index.php.
- (28) WWW site http://phase3d.nims.go.jp.
- (29) WWW site http://www-lab.imr.tohoku.ac.jp/ marcel/enthalpy/enthlp.html.
- (30) Structure and energy data is available on the WWW at http://alloy.phys.cmu.edu.
- Hoard et al. (1970) J. L. Hoard et al. (1970).
- Hughes et al. (1963) R. E. Hughes, C. H. L. Kennard, K. G. Sullenger, H. A. Weakliem, D. E. Sands, and J. L. Hoard, J. Am. Chem. Soc. 85, 361 (1963).
- Callmer (1977) B. Callmer, Acta Cryst. B 33, 1951 (1977).
- Slack et al. (1988) G. A. Slack, C. J. Hejna, M. F. Garbauskas, and J. S. Kasper, J. Sol. State Chem. 76, 52 (1988).
- Sjostedt and Nordstrom (2002) E. Sjostedt and L. Nordstrom, Phys. Rev. B 66, 014447 (2002).
- Herper et al. (1999) H. C. Herper, E. Hoffmann, and P. Entel, Phys. Rev. B 60, 3839 (1999).
- Ching et al. (1990) W. Y. Ching et al., Phys. Rev. B 42, 4460 (1990).
- Madelung (1992) O. Madelung, ed., Landolt and Bornstein, New Series, Group IV, vol. 5 (Springer-Verlag, Berlin, 1992).
- Egami and Waseda (1984) T. Egami and Y. Waseda, J. Noncryst. Solids 64, 113 (1984).
- Okamoto (2000) H. Okamoto, ed., Desk Handbook: Phase Diagrams for Binary Alloys (ASM International, Materials Park, Ohio, 2000).
- Okamoto and Massalski (2000) H. Okamoto and T. B. Massalski, chapter in Okamoto (2000) (2000).
- Okamoto and Massalski (1991) H. Okamoto and T. B. Massalski, J. Phase Equilibria 12, 148 (1991).
- Coehorn (1989) R. Coehorn, Phys. Rev. B 39, 13072 (1989).
- Moze et al. (1994) O. Moze et al., Phys. Rev. B 50, 9293 (1994).
- Glaser and Post (1953) F. W. Glaser and B. Post, Trans. AIME 197, 1117 (1953).
- Champion and Hagege (1992) Y. Champion and S. Hagege, J. Mat. Sci. Lett. 11, 290 (1992).
- Vajeeston et al. (2001) P. Vajeeston, P. Ravindran, C. Ravi, and R. Asokamani, Phys. Rev. B 73, 045115 (2001).
- Mihalkovič and Widom (2003) M. Mihalkovič and M. Widom, in Proceedings of the MRS Fall Meeting, edited by E. Belin (Materials Research Society, 2003).
- Watson and Bennett (1991) R. E. Watson and L. H. Bennett, Phys. Rev. B 43, 11642 (1991).
- Nold et al. (1981) E. Nold, P. Lamparter, H. Olbrich, G. Rainer-Harbach, and S. Steeb, Z. Naturforsch. 86a, 1032 (1981).
- Cowlam (1996) N. Cowlam, J. Non-cryst. Solids 205-207, 567 (1996).
- Yelon and Hadjipanayis (1992) W. B. Yelon and G. C. Hadjipanayis, IEEE Trans. Mag. 28, 2316 (1992).
- Averbuch-Pouchot et al. (1987) M. T. Averbuch-Pouchot, R. Chevalier, J. Deportes, B. Kebe, and R. Lemaire, J. Mag. Mag. Mat. 68, 190 (1987).
- Widom et al. (2002) M. Widom et al., MRS Conf. Proc. ??, ??? (2002).
- Lu et al. (2003) Z. P. Lu, C. T. Liu, and W. Porter, Appl. Phys. Lett. 83, 2581 (2003).
- Poon (2003) S. J. Poon, Unpublished (2003).
- Henley (1991) C. L. Henley, Phys. Rev. B 43, 993 (1991).