Infrared Signature of the Superconducting State in Pr2-xCexCuO4
Abstract
We measured the far infrared reflectivity of two superconducting Pr2-xCexCuO4 films above and below . The reflectivity in the superconducting state increases and the optical conductivity drops at low energies, in agreement with the opening of a (possibly) anisotropic superconducting gap. The maximum energy of the gap scales roughly with as . We determined absolute values of the penetration depth at 5 K as for and for . A spectral weight analysis shows that the Ferrell-Glover-Tinkham sum rule is satisfied at conventional low energy scales .
pacs:
74.25.Gz, 74.72.JtSince the discovery of High- superconductivity, considerable efforts have been made to describe and understand the response of the superconducting phase. Over the years, measurements have been carried out in larger temperature and doping ranges, hoping to gain new insight into the problem.
The discovery of electron-doped cupratesTokura ; Takagi gave access to the mirror image of the hole doped phase diagram with respect to the Mott insulator state. Since then, significant work has been made looking for the differences and similarities in systems with either type of carrier.FournierReview The general phase diagram presents global symmetry, yet the magnetic properties show clear differences, the most obvious being the much broader antiferromagnetic phase on the electron doped side.
On the hole-doped side the main results from infrared spectroscopy can be summarized as: (i) in the normal state, indirect evidence of the pseudogap phase has come from analysis of the inverse quasiparticle lifetime , which is depleted over a range ;Timusk (ii) the system evolves smoothly from the normal state into the superconducting state with no typical energy scaling with ;Orenstein (iii) for most dopings these materials are in the clean limit;Puchkov and (iv) a non conventional pairing mechanism is supported by some evidence that high energy states contribute to the formation of the condensate in the underdoped regime.Santander ; Molegraaf ; Homes1
Recent studies above , in the electron-doped side, have concluded through direct spectral weight analysis that a high energy partial gap opened in the normal state.Zimmers ; Onose1 ; Onose2 However very little is known about the optical properties in the superconducting state, most likely due to the low energy associated with the superconducting gap.Homes2 ; Lupi ; Singley2001 Indeed, most studies rely on the Raman scattering of Nd2-xCexCuO4 (NCCO) and Pr2-xCexCuO4 (PCCO) at optimal doping (maximum ) .Kendziora1 ; Kendziora2 ; Blumberg
In this paper, we take advantage of the large surface and good homogeneity of Pr2-xCexCuO4 films to explore the changes induced by superconductivity in the far-infrared spectra. Our data shows an enhanced reflectivity at low frequencies when going into the superconducting state, on an energy scale entirely different from that of the normal state gap.Zimmers ; Onose1 ; Onose2 This feature is translated as a spectral weight loss in the real part of the optical conductivity. Comparing one overdoped to one optimally doped sample we show that the energy scale associated with the superconducting gap roughly scales with .
Two Pr2-xCexCuO4 films were epitaxially grown by pulsed-laser deposition on SrTiO3 and annealed in reducing atmosphere.FournierSample The optimally doped sample is obtained with , has K and is 3780 Å thick. The sample with is in the overdoped regime, has K and a thickness of 3750 Å. The critical temperatures were obtained by electrical transport and are defined by the zero resistance. Thin films are extremely homogeneous in the Ce concentration and their large surface to volume ratio makes them easy to anneal.
Near normal incidence infrared and visible reflectivity spectra were taken between and in a Bruker IFS 66v interferometer at ESPCI. This data was extended to the very far-infrared (–) at Brookhaven National Laboratory utilizing a Bruker IFS 113v interferometer. The films had an exposed area to the infrared light of about 5 mm in diameter. At ESPCI, gold mirrors were used as a reference below and silver mirrors above . The data is corrected for the absolute reflectivity of Au and Ag. The reflectivity measured at BNL uses an in-situ overcoating of the sample by gold as a reference.Homes3 Measures taken at ESPCI and at BNL agree within 0.2 %, setting our estimate of error in the absolute reflectivity. The relative accuracy of the measurement (between two consecutive temperatures, for instance) is estimated to be better than 0.1 %.
Data was taken at several temperatures in the whole spectral range but in this paper we are only going to compare the far-infrared spectrum (below ) just above to the one at 5 K. The normal state properties and the full spectral range are discussed elsewhere.Zimmers
The high reflectivity of the film below makes the substrate contribution negligible in this range. Substrate contributions to the reflectivity cannot however be neglected above . To get rid of this response, we measured the reflectivity of SrTiO3 at the same temperatures in order to extract its optical properties. We then searched for a dielectric function for the film that describes the reflectivity of the whole system using a standard thin film model.Santander1 The dielectric function obtained for the film was used to generate its bulk reflectivity above at all temperatures. The reflectivity spectra beyond are identical within the accuracy of the measurement, from 25 K, just above , down to the lowest temperature.
The overall bulk reflectivity of PCCO can then be obtained by combining the measured data below to the bulk simulation above .Overlap Finally, we applied standard Kramers-Kronig analysis to such reconstructed spectra in order to extract the optical conductivity of PCCO. Below we used a Hagen-Rubens () extrapolation for the normal state reflectivity and a superconductor extrapolation () below . Above we used a constant up to followed by a free electron termination.

Figure 1 shows the real part of the optical conductivity () for (top panel) and (bottom panel). The insets in this figure show the measured far-infrared reflectivity. In all panels the dashed line is taken just above and the solid line at 5 K. In both compounds the far infrared reflectivity increases, corresponding to a depletion in the superconducting at low frequencies.
In Fig. 2 we plot the ratio between superconducting and normal reflectivity (left panel) and conductivity (right panel) for the (dashed line) and (solid line) samples. We note that there is an increase in the low energy reflectivity at for x = 0.15 and for . The corresponding decreases in the optical conductivity occurs at and .
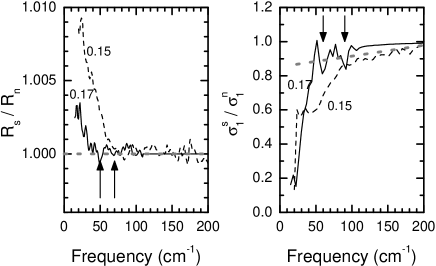
In a -wave BCS superconductor a rise in the low frequency reflectivity is associated with an isotropic superconducting gap (). However the BCS reflectivity is much flatter and closer to unity than what is seen in our data. Nevertheless, the reflectivity rise is compatible with the onset of an anisotropic gap. Indeed, the two strongest arguments against the observation of the gap in cuprates are (i) the energy range where the reflectivity increases does not vary with doping and (ii) cuprates are thought to be in the clean limit making the observation of a gap difficult. The first argument is clearly not applicable to our data. To counter the second point we can look at the low frequency scattering rate just above . In the optimally doped sample we have and in the overdoped material . These values are of the same order of the frequency where the reflectivity increases. It is then reasonable to assign the reflectivity rise and the conductivity drop to the superconducting gap. In the absence of a specific model for such a gap, we can only estimate the maximum gap value from the frequencies where the low energy reflectivity or conductivity in the superconducting state differs from the ones above . If we use the values obtained from we have a ratio of 6 for and 5.6 for . This value is probably an overestimate of the gap energy. Considering the frequencies obtained from the reflectivity, the ratio is 4.7 for both samples, in closer agreement to the values inferred from the Raman symmetry in NCCO samples.Kendziora1 ; Kendziora2 ; Blumberg
To further quantify the superconducting properties of PCCO, we looked at the -sum rule. It follows from charge conservation and states that
| (1) |
where is the vacuum impedance, the charge density, and and the electronic charge and mass respectively.
Infinite conductivity in the superconducting state is represented by a peak at the origin in . The -sum rule then implies that the spectral weight of the peak must come from finite frequencies, hence the decrease in . In fact, Ferrell, Glover and Tinkham (FGT)FGT1 ; FGT2 have shown that the spectral weight lost at finites frequencies of in the superconducting state is recovered in the superfluid weight.
To verify the FGT sum rule we need to determine the superfluid weight. One way to calculate it is to use the imaginary part of the optical conductivity.Dordevic In the superconducting state one can write as
| (2) |
where is the superconducting plasma frequency. then follows from Kramers-Kronig as
| (3) |
and we define as the first term on the right hand side of Eq. 3.
Kramers-Kronig of the reflectivity data yields directly and . Because is obtained only for finite frequencies, it equals . We can thus apply Eq. 3 and calculate .

Figure 3 shows that for both samples is indeed fairly constant below and corresponds to for and for . The contributions to errors in come from (i) the uncertainties in fitting the low frequency to a constant value; and (ii) different extrapolations used in the Kramers-Kronig calculations. The absolute value of the superconducting penetration depth at 5 K can be calculated using and yield for and for . These values are in good agreement with the ones obtained by microwave absorption.Kokales ; Snezhko
We can now verify the FGT sum rule by comparing the spectral weight lost in to the superconducting plasma frequency calculated above. To do so, we define a partial differential sum rule
| (4) |
where the superscripts and refer to the normal and superconducting states respectively. One should read as the contribution from states up to to the the superconducting plasma frequency, i.e., .
Figure 4 shows for both films. To correctly obtain , one must integrate from but our data only goes down to . To get the area between and , we fitted the normal state using a Drude peak. For lack of a good extrapolation, the superconducting was set to below . Inspection of Fig. 1 shows that this approximation is reasonable for the overdoped sample. However it will largely overestimate in the optimally doped compound. In that case we used a constant extrapolation to zero frequency. The dashed lines in Fig. 4 are the superconducting plasma frequencies calculated from Fig. 3. The shaded areas indicate the error in these values.

Figure 4 is showing how far one must integrate the conductivity to obtain from . Within error bars the FGT sum rule is fulfilled in both samples below (25 meV). A similar analysis in underdoped Bi2Sr2CaCu2O8-δ shows that one must integrate Eq. 4 to very high energies (2 eV) in order to recover the spectral weight of the condensate.Santander ; Molegraaf A similar effect was also seen in YBa2Cu3O6.5 where the integration must be carried up to 0.5 eV to satisfy the FGT sum rule.Homes1 This energy range is characteristic of the boson spectrum responsible for the pairing mechanism which led to the conclusion that the pairing mechanism was unconventional.Norman ; Hirsch ; Benfatto ; Stanescu ; Ashkenazi ; Carbotte In our PCCO samples, Fig. 4 shows that the states contributing to the formation of the superconducting plasma frequency lie at energies comparable to the phonon spectrum.
The energy scale over which the condensate is recovered as well as the superconducting gap value are much smaller than the magnitude of the normal state (pseudo) gap observed around 100 meV.Onose1 ; Onose2 ; Zimmers This is in striking contrast with hole doped cuprates where the area loss in the real part of the conductivity, due to superconductivity, occurs over an energy scale which is similar to the one associated with the pseudogap state. This might imply that the normal state gap in electron doped cuprates has a different microscopic origin from the pseudogap in hole doped cuprates.
In conclusion, we have measured the optical conductivity of one optimally doped and one overdoped Pr2-xCexCuO4 film. The reflectivity increase at low frequencies can be associated with the superconducting gap maximum and its value scales with as . The superconducting penetration depth at 5 K was determined to be for the optimally doped sample and for the overdoped one. The partial differential sum rule shows that the superfluid condensate is built from states below 25 meV compatible with a more conventional low energy pairing mechanism.
The authors thank Dr. V.N. Kulkarni for RBS / Channeling measurements and C.P. Hill for help in the sample preparation. The work at University of Maryland was supported by NSF grant DMR-0102350. The Work at Brookhaven National Laboratory was supported by DOE under contract DE-AC02-98CH10886.
References
- (1) Y. Tokura, H. Takagi and S. Uchida, Nature (London) 337, 345 (1989).
- (2) H. Takagi, S. Uchida and Y. Tokura, Phys. Rev. Lett. 62, 1197 (1989).
- (3) P. Fournier et al. in The Gap Symmetry and Fluctuations in High-Tc Superconductors, edited by J. Bok (Series B: Physics Vol. 371, NATO ASI Series, 1998)
- (4) T. Timusk and B. Statt, Rep. Prog. Phys 62, 61-122 (1999).
- (5) J. Orenstein et al., Phys. Rev. B 42, 6342 (1990).
- (6) A.V. Puchkov, D.N. Basov, and T. Timusk, J. Phys. Condens. Matter 8, 10049 (1996).
- (7) A.F. Santander-Syro et al., Euphys. Lett. 62, 568 (2003).
- (8) H.J.A. Molegraaf et al., Science 295, 2239 (2002).
- (9) C.C. Homes et al., Phys. Rev. B 69, 024514 (2004).
- (10) A. Zimmers et al., in preparation.
- (11) Y. Onose et al., Phys. Rev. Lett. 87, 217001 (2001).
- (12) Y. Onose et al., Phys. Rev. B 69, 024504 (2004).
- (13) C.C. Homes et al., Phys. Rev. B 56, 5525 (1997).
- (14) S. Lupi et al., Phys. Rev. Lett. 83, 4852 (1999).
- (15) E.J. Singley et al., Phys. Rev. B 64, 224503 (2001).
- (16) C.C. Homes et al., Appl. Optics 32, 2976 (1993).
- (17) C. Kendziora et al., Physica C 341-348, 2189 (2000).
- (18) C. Kendziora et al., Physica C 364-365, 541 (2001).
- (19) G. Blumberg et al., Phys. Rev. Lett. 88, 107002 (2002).
- (20) P. Fournier et al., Physica C 297, 12 (1998).
- (21) A.F. Santander-Syro et al., condmat/0405264.
- (22) In the overlapping range, measurement and simulation agree within 0.1 %.
- (23) R.A. Ferrell, and R.E. Glover, Phys. Rev. 109, 1398 (1958).
- (24) M. Tinkham, and R.A. Ferrell, Phys. Rev. Lett. 2, 331 (1959).
- (25) S.D. Dordevic et al., Phys. Rev. B 65, 134511 (2002).
- (26) J.D. Kokales et al., Phys. Rev. Lett. 85, 3696 (2000).
- (27) A. Snezhko et al., Phys. Rev. Lett. 92, 157005 (2004).
- (28) M.R. Norman, and C. Pépin, Phys. Rev. B 66, 100506(R) (2002).
- (29) J.E. Hirsch and F. Marsiglio, Phys. Rev. B 62, 15131 (2000).
- (30) L. Benfatto et al., condmat/0305276.
- (31) T. Stanescu, and P. Phillips, condmat/0301254.
- (32) J. Ashkenazi, condmat/0308153.
- (33) J.P. Carbotte, and E. Schachinger, condmat/0404192.