Continuous and correlated nucleation during nonstandard island growth at Ag/Si(111)-77 heteroepitaxy
Abstract
We present a combined experimental and theoretical study of submonolayer heteroepitaxial growth of Ag on Si(111)- at temperatures from 420 K to 550 K when Ag atoms can easily diffuse on the surface and the reconstruction remains stable. STM measurements for coverages from 0.05 ML to 0.6 ML show that there is an excess of smallest islands (each of them fills up just one half-unit cell – HUC) in all stages of growth. Formation of 2D wetting layer proceeds by continuous nucleation of the smallest islands in the proximity of larger 2D islands (extended over several HUCs) and following coalescence with them. Such a growth scenario is verified by kinetic Monte Carlo simulation which uses a coarse-grained model based on a limited capacity of HUC and a mechanism which increases nucleation probability in a neighbourhood of already saturated HUCs (correlated nucleation). The model provides a good fit for experimental dependences of the relative number of Ag-occupied HUCs and the preference in occupation of faulted HUCs on temperature and amount of deposited Ag. Parameters obtained for the hopping of Ag adatoms between HUCs agree with those reported earlier for initial stages of growth. The model provides two new parameters - maximum number of Ag atoms inside HUC, and on HUC boundary.
pacs:
81.15.Aa, 68.35Bs, 68.35.FxI Introduction
Heteroepitaxial growth of metals on silicon surfaces has been studied for decades and morphologies of various grown structures were reported Tanishiro et al. (1996); Custance et al. (2001); Tosch and Neddermayer (1988); Vitali et al. (1999); Sobotík et al. (2000, 2002). Reconstruction of oriented semiconductor surfaces determines the mobility of deposited adatoms and substantially influences growth mechanism. Recently reported experimental studies on self-organised growth of arrays of ordered metal islands – quantum dots – on the Si(111)-77 surface Vitali et al. (1999); Li et al. (2002) stimulate need of detailed understanding of mechanisms controlling the growth. Heteroepitaxy of Ag on the Si(111)-77 surface represents one of frequently studied problems due to nonreactivity of Ag with the reconstructed surface, abrupt interface and negligible interdiffusion of both elements. The growth mode is of the Stranski-Krastanov type – 3D islands are formed on a 2D Ag transition layer (wetting layer) grown on the 77 silicon surface.
Our initial STM study of Ag/Si heteroepitaxy at low coverage Sobotík et al. (2000) showed a growth mechanism affected by trapping Ag adatoms in triangular units of the 77 reconstruction – half unit cells (HUCs). The HUCs are of two types: ’faulted’, FHUC (containing a structural fault according to the DAS model Takayanagi et al. (1985)) and ’unfaulted’, UHUC. For deposited Ag atoms, the two types of HUCs represent potential wells with different depths . This leads to preferential nucleation in the FHUCs (the preference is defined as a ratio of FHUCs containing Ag adatoms to all occupied HUCs). In the successive work Mysliveček et al. (2001) we investigated processes of adatom diffusion, nucleation and island formation at the beginning of the Ag growth for a deposited amount ML (1 ML atoms/cm2), both experimentally and theoretically. We developed and used a simple coarse-grained model for the kinetic Monte Carlo (KMC) simulations. Fitting of experimental data provided values eV, eV and frequency prefactors .
Recently, we extended our STM measurements to coverages up to 0.6 MLSobotík et al. (2002). In this regime a discontinuous 2D film – wetting layer Sobotík et al. (2001) – is formed. We observed large 2D islands completely covering several HUCs. We did not observe any island to overgrow the HUC boundaries at its perimeter. This results in triangularly jagged island shapes. There was a considerable number of stable Ag clusters - each of them formed inside a HUC. We denoted such islands as 1-HUC islands. These islands were observed for coverages up to 0.6 ML and for high temperatures (540 K) as well. Statistical analysis of island population on the surface revealed a number of 1-HUC islands much higher than a value expected by the ”standard” model of island film growthVenables (1984) in which island density saturates and then all adatoms are captured by existing islands.
We suggested a possible growth mechanism compatible with our observations: A single 1-HUC island grows by adatom capturing until a maximum number of adatoms which can be accommodated in a HUC is reached - an 1-HUC island is saturated. The saturated and isolated island does not capture diffusing adatoms any more. It leads to an increase of Ag adatom concentration around such islands and results in enhanced nucleation of new islands in proximity of saturated HUCs (correlated nucleation). Larger islands grow by coalescence of smaller saturated islands.
In this paper, we verify the above nonstandard growth scenario by a combined experimental and theoretical study. We performed STM experiments in a temperature range when Ag atoms can easily diffuse on the surface and the structure remains stable. We measured dependences of several structure related quantities (object densities, preferences of occupation, island size distribution) on deposited amount, substrate temperature and deposition flux. We show that the results of measurements can be explained by KMC simulation using a modified coarse-grained model developed from the one we used for low coverage growth Mysliveček et al. (2001). The new model, which takes into account limited capacity of HUCs and correlated nucleation, explains both morphological and statistical properties of island growth and coalescence on the reconstructed Si(111)- surface.
II Experiments
Series of samples with various amounts of deposited Ag from 0.05 ML to 0.6 ML were prepared at temperatures from 420 K to 550 K at deposition rate MLs-1. Another series with Ag amounts from 0.05 ML to 0.3 ML were deposited at K and deposition rate MLs-1. Ag was evaporated from a tungsten filament in an ultra-high vacuum chamber, the deposited amount was measured by a quartz thickness monitor with an absolute accuracy of 10 %. Sb doped Si(111) substrates with a miscut of 0.1∘ and resistivity of 0.005 – 0.01 cm were heated by passing dc current (temperature calibrated with accuracy of 10 K). Other experimental details (substrate treatment, thickness monitor and temperature calibration etc.) have been already reported elsewhere Mysliveček (2000); Mysliveček et al. (2001). Before STM measurements, deposited films relaxed at least 1 hour at room temperature (RT). Experimental procedures were performed at pressure Pa. We used an STM of our design and construction with electrochemically polished tungsten tips.
III Experimental results
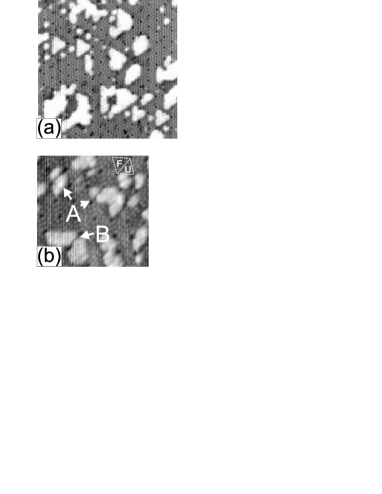
Fig. 1a shows an example of morphology of Ag islands grown at substrate temperature 490 K as observed in STM. Following morphological features has been found by analysis of a large number of images taken from various samples:
-
(i)
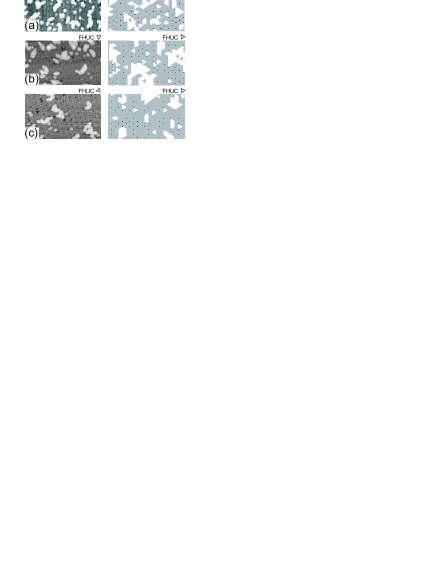
Ag forms 2D islands of various sizes bordered always by dimer rows of the reconstruction. The dimer rows at island boundary are not filled by Ag atoms, dimer rows inside larger islands are filled (overgrown) by Ag atoms – see detail A on Fig. 1b.
-
(ii)
We often observed islands covering adjacent HUCs but clearly separated by the dimer row - see detail B on Fig. 1b.
- (iii)
-
(iv)
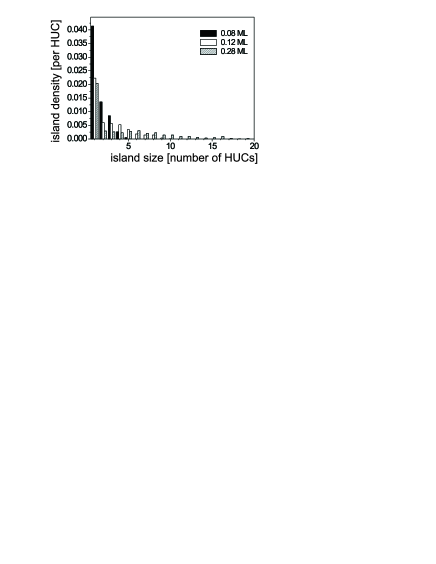
An important feature is excess of 1-HUC islands in island size distribution even at very low deposition rates, higher temperatures and coverages up to 0.6 ML mag . This is illustrated in Fig. 2 which shows the island size distribution for different coverages (see also Fig. 1 and Fig. 2 in Ref. Sobotík et al., 2002). The basic size unit is an area of one HUC. The 1-HUC islands clearly dominate in all distributions.
The 1-HUC islands grow preferentialy in FHUCs and in proximity of larger islands rather than in vacant areas of the surface (Fig. 1a). The formation of the wetting layer proceeds as continuous nucleation of new 1-HUC islands.
-
(v)
STM imaging at room temperature does not allow to distinguish number of Ag atoms contained in the 2D Ag island Jarolímek et al. (2001) with exception of the smallest objects – HUCs containing 1 or 2 atoms.
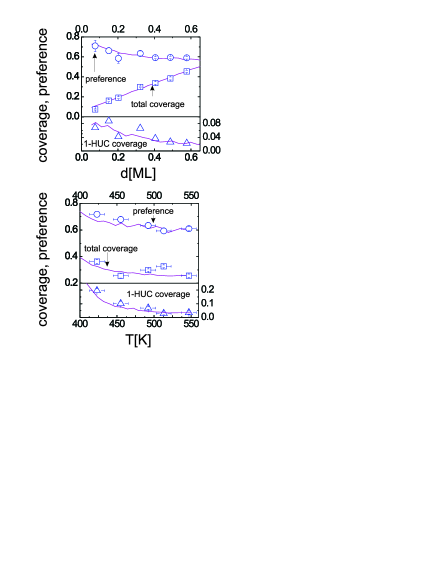
Following quantities were obtained by statistical analysis of STM images: preference ; island size distribution (island size is measured in numbers of HUCs covered by the island); total coverage – the relative number of occupied HUCs (ratio of the occupied HUCs to the all HUCs on the surface), and 1-HUC coverage – the relative number of 1-HUC islands (defined similarly). Ag objects are nonempty HUCs as well as islands larger than a HUC. When no Ag islands larger than a HUC are present , where is density of Ag objects ( number of objects normalized to the number of all HUCs on the surface. The preference reflects existence of two different potential wells on the surface.
We measured dependences of and on deposited amount (upper panel in Fig. 3) and substrate temperature (lower panel in Fig. 3). In the studied range of deposition parameters the total coverage is proportional to the deposited amount of Ag and decreases only slightly with the increasing substrate temperature. When islands larger than 1-HUC begin to grow, preference decreases with both the deposited amount and the substrate temperature. However, it remains larger than 0.6 due to continuous nucleation of new 1-HUC islands preferably in FHUCs.
IV Simulation models
IV.1 Original model
A coarse-grained KMC model with an algorithm derived from Ref. Clarke et al., 1991 was successfully applied for simulation of early stages of nucleation Mysliveček et al. (2001). The model uses HUCs as basic units of the surface. Events included in the model correspond to the following growth scenario: Ag atoms arrive at the surface in random positions with a rate given by flux F. Diffusion of Ag adatoms on the Si substrate is modelled by thermally activated hops to neighboring HUCs. Depending on the HUC type, there are two different contributions to activation energy from interaction with the substrate. A frequency prefactor is assumed (for simplicity) to be the same for FHUCs and UHUCs. The transient mobility of impinging Ag adatoms was included into the model to explain and simulate the short-range ordering of Ag objects and the low value of the total coverage at temperatures too low for sufficient adatom mobility between HUCs Vas ; E.Vasco et al. (2003) (however, in a temperature range, when Ag atoms can easily diffuse on the surface, this mechanism is not much important for the grown morphologies). Hopping adatoms can create nuclei inside HUCs. Let be a number of Ag atoms in a HUC. The model assumes existence of a critical nucleus size . Nuclei of more than Ag atoms are stable. Nuclei with the size can decay with activation energy proportional to . Hopping rate of an Ag atom out of a HUC is approximated as , where represents effective Ag-Ag interaction and is Boltzmann’s constant. The values eV, eV, eV, critical nucleus size , and the frequency prefactor for hopping out of HUCs, , were obtained in the Ref. Mysliveček et al., 2001. The original model has been used only for low coverages where real limits of capacity of HUCs cannot be reached. HUCs were treated like potential wells with unlimited capacity. When higher amount of Ag is deposited this simplification has to be replaced by a certain restriction.
IV.2 Model with a simple constraint
The simplest way how to introduce a limitation of capacity is its direct implementation within a ”standard” growth scenario Venables (1984) for growth simulations. At the beginning of growth the density of Ag nuclei reaches a saturated value and the islands grow simply by capturing hopping adatoms. Each HUC can accommodate Ag atoms at the most and the next deposited or diffusing atom is forced to sit to the nearest HUC occupied by less than Ag atoms. Hence, an island containing more than adatoms overgrows HUC boundaries and extends over neighboring HUCs.
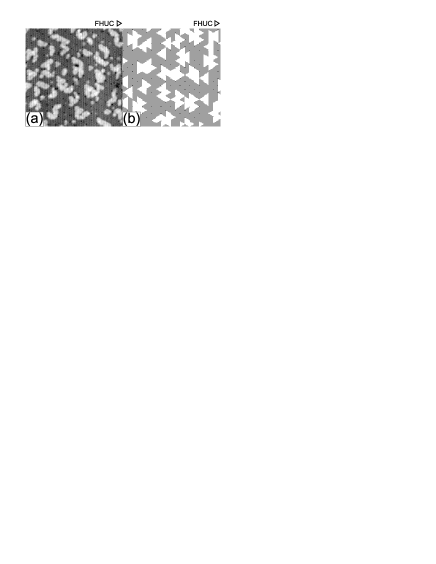
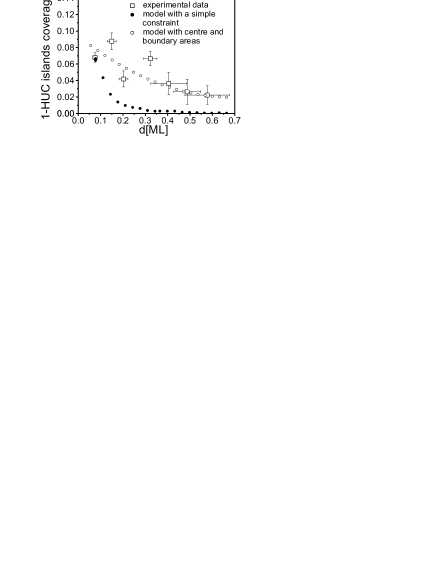
We tried to fit experimental data using the above simple modification. The same model and parameter values as in Ref. Mysliveček et al., 2001 were used, only limited capacity of a HUC, , was included. The value was determined by fitting the experimentally obtained dependence of the relative number of occupied HUCs, , on deposited amount . The fit provided the value of . However, the morphology obtained by using ”standard” mechanism differs from the experimental data – Fig. 4. Only a few 1-HUC islands are visible in the simulated layer. A statistical analysis of the experimental results reveals excess of 1-HUC islands in comparison with the simulated growth – Fig. 5. Therefore, the concept of limited capacity needs to be implemented in a more subtle way taking into account the role of 1-HUC islands in agreement with the scenario suggested in Ref. Sobotík et al., 2002 and detailed experimental observations presented in Sec. III.
IV.3 Model with centre and boundary areas - final model
During the growth a 1-HUC island captures more and more diffusing adatoms until its size reaches a saturated value given by the limited capacity of the HUC. The saturated 1-HUC Ag island cannot further grow by adatom capture. The value is assumed to be the same for islands in both types of HUCs. When a diffusing adatom meets the saturated HUC, it hops fast out leaving dimer row unoccupied. This event is simulated by means of setting the energy barrier for hopping out of saturated HUCs close to zero value.
Larger islands grow by coalescence with 1-HUC islands only by the following mechanism: Boundaries between adjacent HUCs can be filled only if the cells are saturated. Such two HUCs can coalesce with assistance of a certain number of hopping adatoms, , completing each HUC. In the simulation, the adjacent saturated HUCs can incorporate new adatoms until the boundary areas in HUCs (dimer rows separating adjacent HUCs) are filled by Ag atoms. The maximum number of atoms in a HUC with all the boundary areas filled is then . Therefore, in the computer model, each HUC is formally divided into one centre and three boundary areas. The boundary area can accept Ag atoms if the centre areas of both adjacent HUCs are saturated – each contains Ag atoms (i.e. a saturated 1-HUC island).
Each hopping event in the computer model is selected with probability determined by activation energy calculated with respect to a number of Ag atoms at a given position (HUC). We started with simulations in which the hopping probability was not affected by occupancy of a destination site (HUC). These simulations provided high population of 1-HUC islands but fitting of model parameters failed in achieving quantitative agreement with the experimentally measured dependences. The concentration of 1-HUC islands obtained by the simulations was much higher than the experimentally observed value. The experimentally observed increase of 1-HUC island density in proximity of larger islands was not reproduced by the model.
The enhanced nucleation of a new island in proximity of the saturated one (in an adjacent HUC) can be explained physically by an increase of time spent by a diffusing Ag adatom in the close neighborhood of saturated HUC. This might be caused by an interaction of Ag adatom with Ag atoms in saturated HUC. Another reason may be a change of the barrier for diffusion over the boundary of saturated HUC due to relaxation of Si atoms. The effect is modeled by decrease of the barrier for hopping into the saturated HUC by . It increases probability of nucleation near the saturated island. The correlated nucleation would also imply decrease of the concentration of 1-HUC islands because during further growth more 1-HUC islands will join larger islands. This modification implies the need to use a model with hopping rates depending on a final position. The introduction of anisotropy for hopping makes the code technically a bit more complicated (a hop-oriented code has to be employed).
V Simulation results and discussion
Simulations with the final model (the model with centre and boundary areas) reproduce well growth morphologies observed in the experiment. Figures 6a and 6b show examples of real and simulated growth morphologies for two temperatures K, K and for the rate of deposition MLs-1. Comparison of corresponding figures shows that an excess of 1-HUC islands is well reproduced for both temperatures.
We carefully fitted the experimental data presented in Fig. 3. To simplify the fitting, we assumed and eV as obtained in the previous work Mysliveček et al. (2001). We varied three parameters , , and and at the same time we were changing values and within error bars of the previous work to find the best fit.
We found that the fitting of experimental data using the final model give values () s-1 and eV (at the fixed value s-1 the values can be determined with an accuracy of 0.02 eV) and the difference eV. The values are in a good agreement with our previous results Mysliveček et al. (2001). In addition the model provided energy related to effective interaction with saturated HUC, eV, and numbers of Ag atoms , and . Maximum number of Ag atoms accommodated in a HUC with all three boundary areas filled is . It is larger than a rough estimate reported in Ref. Sobotík et al., 2002 (compare also with a value of resulted from the ”standard” growth model). The value of is consistent with a number of potential minima in a HUC – 18 – proposed in Ref. Cho and Kaxiras, 1997.
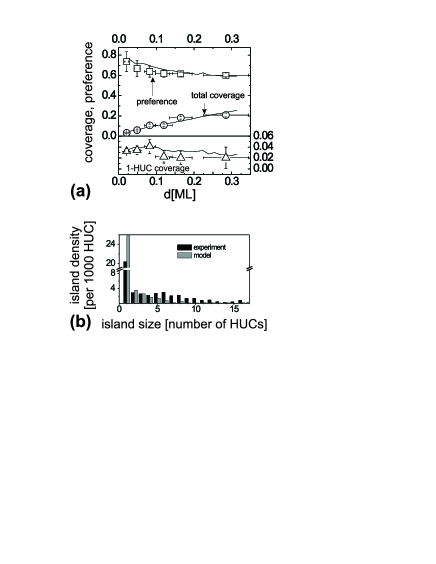
The validity of the final model and the values of the parameters were further tested for quite different growth condition - very low deposition rate MLs-1. STM image in left part of Fig. 6c shows that there is excess of 1-HUCs even in this regime. Morphology obtained by simulation under the same growth conditions in right part of Fig. 6c have similar features. A series of samples provided dependences (see Fig. 7a) similar to those shown in Fig. 3. In the same Figure, we show results obtained by calculation using the final model with the parameters given above. There was no additional fitting. We can see that the agreement is quite good. The model explains well excess of 1-HUC islands in the size distribution also for this much lower deposition rate - see a reasonable agreement between experimental data and simulation (Fig. 7b).
STM images of layers grown at various conditions show that a mean size of large irregular Ag islands is limited. During further growth the islands connect into a network – the wetting layer. The morphology of the irregular islands and wetting layer depend on growth temperature Sobotík et al. (2002, 2001) and are driven by epitaxial strain. The current model does not take into account the strain which plays an important role in the formation of wetting layer. Therefore, the model cannot be used for simulation of growth above 0.6 ML of deposited metal but it allows to assess the structural properties of filling individual HUCs.
VI Conclusions
Combined study of submonolayer growth of Ag on Si(111)-() by series of STM measurements and kinetic Monte Carlo simulations allowed to determine microscopic mechanism of growth in the regime of island coalescence. The surface reconstruction strongly affects nucleation and growth of islands. Islands do not extend laterally but by fast connection of preformed blocks – saturated HUCs - by filling dimer rows. Key feature of growth is slow and continuous nucleation of new small nuclei occupying the inner parts of HUC preferably in proximity of already saturated HUCs.
Both surface morphologies and quantitative measurements can be reproduced by KMC simulations using a model extending the coarse-grained model utilized for simulation of initial stages of growth. It turned out that it was necessary to resolve the inner part of HUC and its boundary. Comparison with experiment confirmed the applicability of this model for interpretation of growth for a large range of deposition parameters (temperature, deposition rate, time) and for deposited amount up to ML. Correlated nucleation in proximity of saturated HUCs is obtained by introduction of effective interaction decreasing energy barrier for a hop into the saturated HUC by eV. The model can be used for simulations up to the coverage when epitaxial strain significantly influences growth of larger islands.
The model allowed to assess maximum numbers of Ag atoms per HUC in a 2D island: for an isolated 1-HUC island ; for a larger island (covering HUCs) the saturated number of Ag atoms filling one of the three boundary areas is and the maximum number of Ag atoms per HUC is ().
We expect that the mechanism of growth on reconstructed Si(111)-() for other nonreactive metals is similar and that the model can be used as a starting point for modelling heteroepitaxial growth in other systems and for fitting corresponding parameters.
VII Acknowledgement
This work was supported by the Grant Agency of the Czech Republic – project 202/01/0928 and by the Ministry of Education, Youth and Sports of Czech Republic – project FRVŠ 2735/2003.
References
- Tanishiro et al. (1996) Y. Tanishiro, K. Kaneko, H. Minoda, K. Yagi, T. Sueyoshi, T. Sato, and M. Iwatsuki, Surf. Sci. 358, 407 (1996).
- Custance et al. (2001) O. Custance, I. Brihuega, J.-Y. Veuillen, J. Gomez-Rodriguez, and A. Baro, Surf. Sci. 482-485, 878 (2001).
- Tosch and Neddermayer (1988) S. Tosch and H. Neddermayer, Phys. Rev. Let. 61, 349 (1988).
- Vitali et al. (1999) L. Vitali, M. G. Ramsey, and F. P. Netzet, Phys. Rev. Let. 83, 316 (1999).
- Sobotík et al. (2000) P. Sobotík, I. Ošt’ádal, J. Mysliveček, and T. Jarolímek, Surf. Sci. 454-456, 847 (2000).
- Sobotík et al. (2002) P. Sobotík, I. Ošt’ádal, and P. Kocán, Surf. Sci. 507-510, 389 (2002).
- Li et al. (2002) J.-L. Li, J.-F. Jia, X.-J. Liang, X. Liu, J.-Z. Wang, Q.-K. Xue, Z.-Q. Li, J. S. Tse, Z. Zhang, and S. B. Zhang, Phys. Rev. Lett. 88, 066101 (2002).
- Takayanagi et al. (1985) K. Takayanagi, Y. Tanishiro, and S. Takahashi, J. Vac. Sci. Technol. A, 1502 (1985).
- Mysliveček et al. (2001) J. Mysliveček, P. Sobotík, I. Ošt’ádal, T. Jarolímek, and P. Šmilauer, Phys. Rev. B 63, 045403 (2001).
- Sobotík et al. (2001) P. Sobotík, I. Ošt’ádal, T. Jarolímek, and F. Lavický, Surf. Sci. 797, 482 (2001).
- Venables (1984) J. A. Venables, Rep. Prog. Phys. 47, 399 (1984).
- Mysliveček (2000) J. Mysliveček, PhD Thesis Charles University Prague (2000).
- (13) We do not observe any clean evidence of selection of magic island sizes as in the case of Si growth on Si(100), see. B. Voigtlnder, M. Kstner, and P. Šmilauer, Phys. Rev. Lett. 81, 858 (1998).
- Jarolímek et al. (2001) T. Jarolímek, J.Mysliveček, P. Sobotík, and I. Ošt’ádal, Surf. Sci. (2001).
- Clarke et al. (1991) S. Clarke, M. R. Wilby, and D. D. Vvedensky, Surf. Sci. 225, 91 (1991).
- (16) To explain this, an alternative mechanism of correlated diffusion [17] was suggested. Both mechanisms can give in principle satisfactory results. Only furher experimental data together with the theoretical effort can clarify this issue.
- E.Vasco et al. (2003) E.Vasco, C.Polop, and E. Rodríguez-Caas, Phys. Rev. B 67, 235412 (2003).
- Cho and Kaxiras (1997) K. Cho and E. Kaxiras, Europhys. Lett. 39, 287 (1997).