Compressibility of CeIn5 and CeIn8 (Rh, Ir and Co) Compounds
Abstract
The lattice parameters of the tetragonal compounds CeIn5 and CeIn8 (Rh, Ir and Co) have been studied as a function of pressure up to 15 GPa using a diamond anvil cell under both hydrostatic and quasihydrostatic conditions at room temperature. The addition of In2 layers to the parent CeIn3 compound is found to stiffen the lattice as the 2-layer systems (average of bulk modulus values is 70.4 GPa) have a larger than CeIn3 (67 GPa), while the 1-layer systems with the are even stiffer (average of is 81.4 GPa). Estimating the hybridization using parameters from tight binding calculations shows that the dominant hybridization is in nature between the Ce and In atoms. The values of at the pressure where the superconducting transition temperature reaches a maximum is the same for all CeIn5 compounds. By plotting the maximum values of the superconducting transition temperature versus for the studied compounds and Pu-based superconductors, we find a universal versus behavior when these quantities are normalized appropriately. These results are consistent with magnetically mediated superconductivity.
pacs:
61.10.Nz,62.50.+p,51.35.+a, 71.27.+a,74.70.TxI Introduction
Ce based heavy fermion (HF) and antiferromagnetic (AF) compounds have been the subject of intensive investigations due to their unconventional magnetic and superconducting properties. In these compounds the electronic correlations, the magnetic ordering temperature and the crystal field effects are sensitive to pressure, and pressure induced superconductivity near a quantum critical point (QCP) has been observed in a variety of compounds such as CePd2Si2, CeCu2Ge2, CeRh2Si2 and CeIn3. Steglich et al. (1979); Jaccard et al. (1992); Movshovich et al. (1996); Grosche et al. (1996); Mathur et al. (1998) The appearance of superconductivity in these systems and the deviation from Fermi liquid behavior as a function of pressure are still challenging problems to be studied.
CeIn2n+3 (=Rh, Ir and Co) with or 2 crystallize in the quasi-two-dimensional (quasi-2D) tetragonal structures HonCoGaGrin et al. (1979, 1986) The crystal structure can be viewed as (CeIn3)n(In2) with alternating (CeIn3) and (In2) layers stacked along the -axis. By looking at the crystal structure, we would expect that AF correlations would develop in the cubic (CeIn3) layers in a manner similar to bulk CeIn3.Lawrence and Shapiro (1980) The AF (CeIn3) layers will then be weakly coupled by an interlayer exchange interaction through the (In2) layer leading to a quasi-2D magnetic structure. Indeed, in the Rh compounds, the magnetic properties, as determined by thermodynamic,Cornelius et al. (2000) NQR,Curro et al. (2000) and neutron scattering Bao et al. (2000) are less 2D as the crystal structure becomes less 2D going from single layer CeRhIn5 to double layer Ce2RhIn8 (note that as , one gets the 3D cubic system CeIn3). CeRhIn5 and Ce2RhIn8 are antiferromagnets at ambient pressure but are found to superconduct at high pressures.Hegger et al. (2000); Fisher et al. (2002); Mito et al. (2001); Nicklas et al. (2003) The systems CeCoIn5, CeIrIn5 and Ce2CoIn8 display superconductivity at ambient pressure.Fisher et al. (2002); Mito et al. (2001); Petrovic et al. (2001a, b); Chen et al. (2002). The only member of the series that does not display magnetic order or superconductivity at ambient pressures is Ce2IrIn8 that is believed to be near a QCP.Thompson et al. (2001)
While not proven definitively, it is generally believed that the origin of the superconductivity in CeIn2n+3 is magnetic in origin. The value of the superconducting transition temperature in magnetically mediated superconductors is believed to be dependent on dimensionality in addition to the characteristic spin fluctuation temperature. Theoretical models and experimental results suggest that the SC state in CeRhIn5 may be due to the quasi-two dimensional (2D) structure and anisotropic AF fluctuations which are responsible for the enhancement of relative to CeIn3.Pagliuso et al. (2002); Monthoux and Lonzarich (2001) A strong correlation between the ambient pressure ratio of the tetragonal lattice constants and in the CeIn5 compounds is indicative of the enhancement of the superconducting properties by lowering dimensionality (increasing increases ).Pagliuso et al. (2002) In order to explain the evolution of superconductivity induced by pressure and the suppression of AF ordering, it is important to probe the effect of pressure on structure for these compounds and look for possible correlations between structural and thermodynamic properties.
Here we report on high pressure x-ray diffraction measurements performed on CeIn2n+3 (=Rh, Ir and Co) with or 2 up to 15 GPa under both hydrostatic and quasihydrostatic conditions. Previously, we have reported results on CeRhIn5;Kumar et al. (2004) we present a comparative study of the complete set of CeIn2n+3 compounds with emphasis on the behavior near the QCP. While there is no direct correlation between and as an implicit function of pressure in an individual system, the value of at the pressure where reaches its maximum value DOES show linear behavior as previously hypothesized.Pagliuso et al. (2002) Also, the hybridization between the Ce and In atoms is the dominant hybridization in these compounds and takes on the same value for all CeIn5 compounds at the pressure where reaches its maximum value. These results will be compared to isostructural Pu compounds and all of the results are consistent with unconventional, magnetically mediated superconductivity.
II Experiment
CeIn2n+3 single crystals were grown by a self flux technique described elsewhere.Moshopoulou et al. (2001) The single crystals were crushed into powder and x-ray diffraction measurements show the single phase nature of the compound. In agreement with previous results,Moshopoulou et al. (2001); Moreno et al. (2002) the crystals were found to have tetragonal symmetry with cell parameters in agreement with literature values.
The high pressure x-ray diffraction (XRD) experiments were performed using a rotating anode x-ray generator (Rigaku) for the quasihydrostatic runs and synchrotron x-rays at HPCAT, Sector 16 at the Advanced Photon Source for hydrostatic measurements. The sample was loaded with NaCl or ruby powder as a pressure calibrant and either a silicone oil or 4:1 methanol:ethanol mixture (hydrostatic) or NaCl (quasihydrostatic) as the pressure transmitting medium in a Re gasket with a m diameter hole. High pressure was achieved using a Merrill-Basset diamond anvil cell with m culet diameters. The XRD patterns are collected using an imaging plate ( mm2 ) camera with m2 pixel dimensions. XRD patterns were collected up to 15 GPa at room ( K) temperature. The images were integrated using FIT2D software.Hammersley et al. (1996) The structural refinement of the patterns was carried out using the Rietveld method on employing the FULLPROF and REITICA (LHPM) software packages.Rodriguez-Carvajal (1993)
III Results and Discussion

In Fig. 1 we show the XRD patterns for CeCoIn5 obtained at ambient pressure and a hydrostatic pressures of 4.2 GPa with silicone oil used as the pressure transmitting media. In other measurements, diffraction peaks from the Re gasket, pressure markers (NaCl) and the sample are all observed. The known equation of state for NaCl Brown (1999) or the standard ruby fluorescence technique Piermarini et al. (1975) was used to determine the pressure. The refinement of the XRD patterns was performed on the basis of the HonCoGa2n+3 structure with the P4/mmm space group (No. 123). When comparing the crystallographic data and bulk modulus of CeIn3 relative to CeIn2n+3 it is evident that the Ce atom in CeIn2n+3 experiences a chemical pressure at ambient conditions,Hegger et al. (2000); Cornelius et al. (2000) leading one to expect the CeIn2n+3 to be less compressible than CeIn3 as the bulk modulus increases with increasing pressure.

The data have been plotted in Fig. 2 for CeIn5 (=Rh, Ir and Co) and Fig. 3 for CeIn8 (=Rh or Ir) for both quasihydrostatic and hydrostatic measurements (the data for CeRhIn5 has been previously reportedKumar et al. (2004)). Note that the vertical and horizontal scales are the same for all graphs.

Unfortunately, we have not had success growing single crystals of Ce2CoIn8, though others have reported successful growth of single crystals.Chen et al. (2002) Since the maximum volume compression is only of the order of 10%, the data has been fit using a least squares fitting procedure to the first order Murnaghan equation of state
| (1) |
where is the initial bulk modulus and is the pressure derivative of . For the room temperature ( K) data data shown in Figs. 2 and 3, the values of and and the initial linear compressibilities and calculated below 2 GPa are given in Table 1.
| System | (Å3) | (GPa) | (10-3 GPa-1) | (10-3 GPa-1) | |||
| CeRhIn5 | 1 | 163.03 | 1.621 | ||||
| CeIrIn5 | 1 | 163.67 | 1.612 | ||||
| CeCoIn5 | 1 | 160.96 | 1.638 | ||||
| Ce2RhIn8 | 2 | 266.48 | 2.624 | ||||
| Ce2IrIn8 | 2 | 266.26 | 2.610 | ||||
| CeIn3 | 103.10 | 1 |
.
First, we note that the compounds show more anisotropy ( is 15-20% smaller than ) in the the compressibilities than the compounds. As mentioned, the compounds appear to be more 2D than the compounds, making this result somewhat surprising. We also note the deviation from the typical inverse relationship between and ; namely, CeIrIn5 has the largest value of AND the largest ambient pressure volume. These results hint that the valence of Ce and hybridization between the Ce 4f electrons and the conduction electrons needs to be taken into account. Pressure is known to make Ce compounds more tetravalent, and since the tetravalent ion is smaller then the trivalent ion, makes the more tetravalent system less compressible. The explanation for the unexpected difference in the linear compressibilities may lie in the fact that seems to be coupled to as will be discussed later. As a larger favors superconductivity, if pressure reduces less than expected, the compressibility will be lowered and the ratio will increase as seen in CeRhIn5 and CeCoIn As expected, the lattice appears to be stiffer the more 2D the system becomes as the In2 layers in CeIn8 stiffen the structure relative to CeIn3. CeIn3 has a smaller bulk modulus ( GPa)Vedel et al. (1987) than the 2-layer systems (average of is 70.4 GPa) that in turn is smaller than the 1-layer systems (average of is 81.4 GPa). The bulk modulus values compare well with those reported for other HF systems Penney et al. (1982); Spain et al. (1986); Kutty and Vaidya (1987); Wassilew-Reul et al. (1997). The fact that we see no discernible difference between the hydrostatic and quasihydrostatic measurements is likely due to the nearly isotropic compressibilities.
Figs. 2 and 3 also show the ratio of the lattice constants as a function of pressure. The systems display a wide range of behavior from the apparent double peaked structure in CeRhIn5 to the single peaked structure in CeCoIn5 to a monotonic decrease for the other systems. Vertical dashed lines show the pressure where a maximum in has been observed: 2.4 GPa for CeRhIn5,Hegger et al. (2000); Mito et al. (2001) 1.4 GPa for CeCoIn5,Sidorov et al. (2002); Sparn et al. (2002) 2.9 GPa for CeIrIn5,Muramatsu et al. (2003) and 2.4 GPa for Ce2RhIn8.Nicklas et al. (2003)
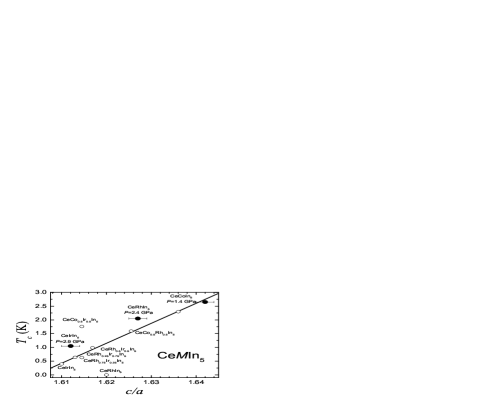
As mentioned, a strong correlation between the ambient pressure ratio and in the CeIn5 compounds has been observed (increasing increases ).Pagliuso et al. (2002) This can be seen in Fig. 4 that is adapted from Pagliuso et al.Pagliuso et al. (2002) (Note that we have corrected a labeling error found in Pagliuso et al.Pagliuso et al. (2002) where two systems are labeled as CeCo0.5Ir0.5In) However, some discrepancies exist, namely magnetic systems like CeRhIn5 whose ratio of 1.62 would lead one to erroneously conclude that superconductivity near 1.0 K should be observed, rather than the experimentally observed AF order at 3.8 K. The reason for this discrepancy can be seen if one considers theoretical treatments of magnetically mediated superconductivity.Monthoux and Lonzarich (2001) Calculations show that superconductivity occurs at a QCP where long range magnetic order is suppressed and the infinite range magnetic correlations give way to short range magnetic correlations that are responsible for the superconductivity. Recent work has shown a similar sort of behavior when a system is near a valence instability and critical density fluctuations give rise to superconductivity.Monthoux and Lonzarich (2004) In either of theses scenarios, one then finds behavior that displays the experimentally observed inverse parabolic behavior with the maximum value of becoming larger as correlations become more 2D in character. Slight deviations from the inverse parabolic behavior observed in CeRhIn5 on the high pressure sideMuramatsu et al. (2001) may be indicative of density fluctuations or a ”hidden” 3D magnetically ordered state.Nicklas et al. (2004) In the magnetic fluctuation scenario, the maximum value of is found at a pressure and depends on the spin fluctuation temperature and the dimensionality of the magnetic interactions. The maximum possible values of will occur for more 2D systems with the highest possible value of . This leads to the natural conclusion that the correct quantities to plot are not the ambient pressure ones, but rather the value of at and the corresponding value of . Note that while one should use the structural information near , we have shown that the versus behavior is similar at room temperature and near leading to the conclusion that the room temperature lattice constants can be used for our analysis.Kumar et al. (2004) This has been done in Fig. 4 where the filled circles correspond to the ratios from the current study where reaches its maximum value at taken from the literature.Hegger et al. (2000); Mito et al. (2001); Sidorov et al. (2002); Sparn et al. (2002); Muramatsu et al. (2003) As can be seen, CeRhIn5 now fits in with the rest of the data quite well. Also, CeIrIn5 and CeCoIn5 both have their values of and enhanced from their ambient pressure values. Note that all of the points from the current study lie on or above the line. These results are consistent with theory and it would be of great interest to measure more values of the maximum as a function of at that pressure to look for universal behavior.
To conclude that the dependence of on in Fig. 4 is due mainly to dimensionality, it is necessary to prove that does not change drastically for the various compounds. To estimate , we have used the tight binding approximation of Harrison to calculate the hybridization between the Ce (or Pu) -electrons and In (or Ga) -electrons and between the Ce -electrons and atom -electrons. As the hybridization can be directly linked to . It can be shown that the and hybridization are given by
| (2) | ||||
where is a constant (for bonds, ); is the mass of an electron; and are tabulated electron wavefunction radii for a particular atom; and is the distance between the atoms in question.Harrison (1980, 1983); Straub and Harrison (1985); Harrison and Straub (1987) We tabulate ambient pressure values along with values at the pressure where reaches its maximum value of both the and the hybridization, summing over all nearest neighbors, in Table 2.
| System | (GPa) | ||||
|---|---|---|---|---|---|
| CeRhIn5 | 0.572 | 2.030 | 2.4 | 0.607 | 2.136 |
| CeIrIn5 | 0.627 | 2.031 | 2.9 | 0.665 | 2.135 |
| CeCoIn5 | 0.307 | 2.066 | 1.4 | 0.317 | 2.130 |
| Ce2RhIn8 | 0.272 | 1.977 | 2.4 | 0.292 | 2.086 |
| Ce2IrIn8 | 0.297 | 1.993 | - | - | - |
| Ce2CoIn8 | 0.147 | 2.018 | - | - | - |
| PuCoGa5 | 0.955 | 5.229 | - | - | - |
Note that though we have done the calculation only for bonds, the inclusion of bonding with higher quantum numbers will simply multiply the final result by a constant (that should approximately be the same for all members of an isostructural series). From Table 2, it is evident that for all of the compounds. This is consistent with the electronic structure calculations of Maehira et al. that consider the hybridization only and get good agreement to measured Fermi surfaces.Maehira et al. (2003) This dominance of the hybridization also gives a natural explanation to some facts regarding the robustness of superconductivity. For site substitution, superconductivity is robust and exists for numerous CeIn5 compositions.Pagliuso et al. (2001, 2002) Substitution of Sn for In, however, has been shown to rapidly suppress superconductivity in CeCo(In1-xSnx)5.Bauer (2004) These results show that the atom serves mainly to affect the spacing between the Ce and In atoms that determine the hybridization, and the sensitivity to Sn substitution shows that disorder of the Ce-In strongly perturbs the interactions leading to superconductivity.
For the CeIn5 series, the values increase in the order RhIrCo. One expects the important parameter describing the magnetic interaction to be the magnetic coupling This is consistent with a Doniach model Doniach (1977a, b) of the competition between the nonmagnetic Kondo state and the magnetic RKKY state shown schematically if Fig. 5 which qualitatively captures the pressure dependent behavior in CeIn5 compounds.

After a system has reached its maximum magnetic ordering temperature, the magnetic order is rapidly suppressed and the system moves toward a QCP. This type of behavior has been seen in numerous Ce compounds.Thompson and Lawrence (1994); Cornelius and Schilling (1994); Cornelius et al. (1997) Near the QCP, many different behaviors can be observed. For the CeIn5 compounds, superconductivity with a characteristic inverse parabolic shape is observed. As shown by the dotted line, magnetic order may or may not coexist in regions with superconductivity. In Fig. 5, the compounds were placed from left to right in order of increasing . The location was chosen to agree with the measured behavior of all three compounds. Namely, CeRhIn5 is an antiferromagnet at ambient pressure while CeIrIn5 and CeCoIn5 are ambient pressure superconductors, and all three display a maximum in as a function of pressure. The inverse parabolic shape of is consistent with the behavior expected for magnetically mediated superconductivity, where the height of the maximum depends on the hybridization and the dimensionality.Monthoux and Lonzarich (2001) The larger maximum value of as a function of pressure for CeCoIn5 with larger (and hence more 2D character) relative to CeIrIn5 then follows naturally. From Fig. 5, one would expect that the pressure to reach the maximum in would increases in order RhIrCo. Surprisingly, both Rh and Ir display the maximum at about the same pressure of 2.4 GPa. This can be explained, however, by noting that CeIrIn5 has the larger bulk modulus so that while the pressure is the same, the volume change is considerably less. A more reasonable variable to use than pressure would be the hybridization From Table 2, the value for the hybridization at the pressure where reaches its maximum value is nearly identical for all three CeIn5 compounds. This gives strong support for the magnetically mediated superconductivity scenario as one would expect that the maximum value of would occur for approximately the same value of and variations in would then be attributed to differences in dimensionality. We note that the values of for the CeIn8 compounds is very similar to the CeIn5 compounds and the progression of increasing being RhIrCo; this is consistent with the progression of ground states from magnetic order (Rh) to heavy fermion (Ir) to superconductivity (Co) in the CeIn8 series. This is in line with the experimental finding of very similar electronic specific heat coefficients ). Cornelius et al. (2001); Moreno et al. (2002); Thompson et al. (2003) Also, in a scenario of magnetically mediated superconductivity, the most obvious route to higher values would be to raise the value of by switching to actinide compounds with larger values, and hence hybridization relative to rare earths. The affect of moving to the actinides is seen in PuCoGa5 that has times larger than the corresponding Ce compounds.
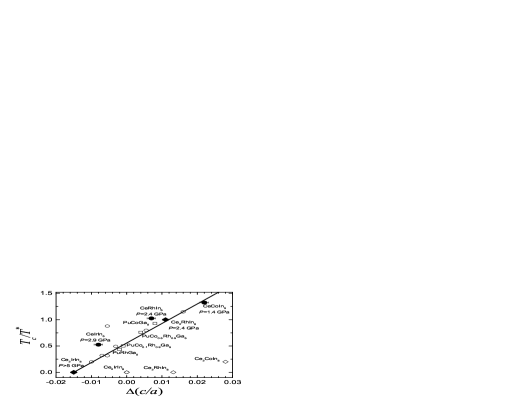
Recently, Pu based superconductivity was observed for the first time in PuCoGa5 above 18 K, an order of magnitude larger than the Ce compounds that also have the HoCoGa5 structure.Sarrao et al. (2002) It was subsequently shown by Wastin et al. that a similar universal linear behavior of versus is observed in PuGa5 compound with nearly the same logarithmic slope as the CeIn5 compounds.Wastin et al. (2003, 2004) While this may at first seem a surprising result, in fact it follows straight from the theoretical conclusions that should scale as a characteristic temperature . That the value is an order of magnitude larger in Pu based compared to Ce based compounds then is a consequence of a value of that is an order of magnitude larger in Pu compounds. This estimate is reasonable in light of the previous discussion showing a significantly larger value of in the Pu compounds remembering that ), and also because the electronic specific heat coefficient is an order of magnitude smaller in Pu compounds relative to Ce compounds and Sarrao et al. (2002) We also note that the CeIn8 compounds at ambient pressure do not seem to not follow the linear versus behavior as only Ce2CoIn8 displays superconductivity at ambient pressure. However, Ce2RhIn8, like CeRhIn magnetically orders at ambient pressure but the application of pressure reveals superconductivity. To further analyze these systems, we plot normalized values of versus in Fig. 6, where is normalized by and is found by subtracting a value . was chosen as 2 K for CeIn8 and CeIn8 as it is approximately for CeCoIn5,Nakatsuji et al. (2002) and as discussed previously, we don’t expect much variation in for these compounds. K was used for PuGa5 as we expect an order of magnitude increase in for Pu compounds relative to Ce compounds. was chosen in such a way to shift the curves on top of each other. The values of and are given in Table 6.
| System | ||
|---|---|---|
| CeIn5 | ||
| PuGa5 | ||
| CeIn8 |
The normalized values are plotted in Fig. 6. The universality is readily apparent with all of the pressure points lying on or above the straight line. That the points lie on or above the line for the ambient pressure points is likely due to higher values of for the optimal pressure data relative to ambient pressure data rendering the assumption of a single value to normalize all data tenuous. The ambient pressure ”misplacement” of Ce2RhIn8 (AF order at ambient pressure) now can be explained by the pressure induced superconductivity and the universal line now goes through the high pressure CeIn8 data. While Ce2IrIn8 does not display superconductivity, the value of reaches a nearly constant value above 5 GPa and we have plotted a point assuming at high pressure. This assumption gains validity as these results would predict that superconductivity will not be seen in Ce2IrIn8 under pressure as falls below the x-intercept of the versus line. Also, Ce2CoIn8 should see a dramatic enhancement of under pressure; if doesn’t change as a function of pressure, this estimate for the maximum in would be around 3 K which is slightly larger than what is seen in CeCoIn5 under pressure.
IV Conclusions
We have studied the elastic properties of CeIn2n+3 (=Rh, Ir and Co) with or 2 under hydrostatic and quasihydrostatic pressures up to 15 GPa using x-ray diffraction. The addition of In2 layers to the parent CeIn3 compound is found to stiffen the lattice. By plotting the maximum values of the superconducting transition temperature versus we are able to expand upon the proposed linear relationship between the quantities by Pagliuso et al.Pagliuso et al. (2002) We have also found that the dominant hybridization is between the Ce (or Pu) electrons and In (or Ga) electrons . Also, the value of where reaches its maximum is nearly identical for all three CeIn5 compounds. These results explain the lack of superconductivity in Ce2IrIn8 and predict that should increase dramatically in Ce2CoIn8 at high pressure. Comparing the results to Pu-based superconductors shows a universal versus behavior when these quantities are normalized by appropriate quantities consistent with what is expected of magnetically mediated superconductivity.
Acknowledgements.
Work at UNLV is supported by DOE EPSCoR-State/National Laboratory Partnership Award DE-FG02-00ER45835. Work at LANL is performed under the auspices of the U.S. Department of Energy. HPCAT is a collaboration among the UNLV High Pressure Science and Engineering Center, the Lawrence Livermore National Laboratory, the Geophysical Laboratory of the Carnegie Institution of Washington, and the University of Hawaii at Manoa. The UNLV High Pressure Science and Engineering Center was supported by the U.S. Department of Energy, National Nuclear Security Administration, under Cooperative Agreement DE-FC08-01NV14049. Use of the Advanced Photon Source was supported by the U. S. Department of Energy, Office of Science, Office of Basic Energy Sciences, under Contract No. W-31-109-Eng-38.References
- Steglich et al. (1979) F. Steglich, J. Aarts, C. D. Bredl, W. Lieke, D. Meschede, W. Franz, and H. Schäfer, Phys. Rev. Lett. 43, 1892 (1979).
- Jaccard et al. (1992) D. Jaccard, K. Behina, and J. Sierro, Phys. Lett. A 163, 475 (1992).
- Movshovich et al. (1996) R. Movshovich, T. Graf, D. Mandrus, J. D. Thompson, J. L. Smith, and Z. Fisk, Phys. Rev. B 53, 8241 (1996).
- Grosche et al. (1996) F. M. Grosche, S. R. Julian, N. D. Mathur, and G. G. Lonzarich, Physica B 223-224, 50 (1996).
- Mathur et al. (1998) N. D. Mathur, F. M. Grosche, S. R. Julian, I. R. Walker, D. M. Freye, R. K. Haselwimmer, and G. G. Lonzarich, Nature 394, 39 (1998).
- Grin et al. (1979) Y. N. Grin, Y. P. Yarmolyuk, and E. I. Gladyshevskii, Sov. Phys. Crystallogr. 24, 137 (1979).
- Grin et al. (1986) Y. N. Grin, P. Rogl, and K. Hiebl, J. Less-Common Met. 121, 497 (1986).
- Lawrence and Shapiro (1980) J. M. Lawrence and S. M. Shapiro, Phys. Rev. B 22, 4379 (1980).
- Cornelius et al. (2000) A. L. Cornelius, A. J. Arko, J. L. Sarrao, M. F. Hundley, and Z. Fisk, Phys. Rev. B 62, 14181 (2000).
- Curro et al. (2000) N. J. Curro, P. C. Hammel, P. G. Pagliuso, J. L. Sarrao, J. D. Thompson, and Z. Fisk, Phys. Rev. B 62, R6100 (2000).
- Bao et al. (2000) W. Bao, P. G. Pagliuso, J. L. Sarrao, J. D. Thompson, Z. Fisk, J. W. Lynn, and R. W. Erwin, Phys. Rev. B 62, R14621 (2000).
- Hegger et al. (2000) H. Hegger, C. Petrovic, E. G. Moshopoulou, M. F. Hundley, J. L. Sarrao, Z. Fisk, and J. D. Thompson, Phys. Rev. Lett. 84, 4986 (2000).
- Fisher et al. (2002) R. A. Fisher, F. Bouquet, N. E. Phillips, M. F. Hundley, P. G. Pagliuso, J. L. Sarrao, Z. Fisk, and J. D. Thompson, Phys. Rev. B 65, 224509 (2002).
- Mito et al. (2001) T. Mito, S. Kawasaki, G. q. Zheng, Y. Kawasaki, K. Ishida, Y. Kitaoka, D. Aoki, Y. Haga, and Y. Onuki, Phys. Rev. B 63, 220507(R) (2001).
- Nicklas et al. (2003) M. Nicklas, V. A. Sidorov, H. A. Borges, P. G. Pagliuso, C. Petrovic, Z. Fisk, J. L. Sarrao, and J. D. Thompson, Phys. Rev. B 67, 020506 (2003).
- Petrovic et al. (2001a) C. Petrovic, P. G. Pagliuso, M. F. Hundley, R. Movshovich, J. L. Sarrao, J. D. Thompson, Z. Fisk, and P. Monthoux, J. Phys.:Condens. Matter 13, L337 (2001a).
- Petrovic et al. (2001b) C. Petrovic, R. Movshovich, M. Jaime, P. G. Pagliuso, M. F. Hundley, J. L. Sarrao, Z. Fisk, and J. D. Thompson, Europhys. Lett. 53, 354 (2001b).
- Chen et al. (2002) G. Chen, S. Ohara, M. Hedo, Y. Uwatoko, K. Saito, M. Sorai, and I. Sakamoto, J. Phys. Soc. Jpn. 71, 2836 (2002).
- Thompson et al. (2001) J. D. Thompson, R. Movshovich, Z. Fisk, F. Bouquet, N. J. Curro, R. A. Fisher, P. C. Hammel, H. Hegger, M. F. Hundley, M. Jaime, et al., J. Magn. Magn. Mater. 226, 5 (2001).
- Pagliuso et al. (2002) P. G. Pagliuso, R. Movshovich, A. D. Bianchi, M. Nicklas, N. O. Moreno, J. D. Thompson, M. F. Hundley, J. L. Sarrao, and Z. Fisk, Physica B 312-313, 129 (2002).
- Monthoux and Lonzarich (2001) P. Monthoux and G. G. Lonzarich, Phys. Rev. B 63, 054529 (2001).
- Kumar et al. (2004) R. S. Kumar, H. Kohlmann, B. E. Light, A. L. Cornelius, V. Raghavan, T. W. Darling, and J. L. Sarrao, Phys. Rev. B 69, 014515 (2004).
- Moshopoulou et al. (2001) E. G. Moshopoulou, Z. Fisk, J. L. Sarrao, and J. D. Thompson, J. Solid State Chem. 158, 25 (2001).
- Moreno et al. (2002) N. O. Moreno, M. F. Hundley, P. G. Pagliuso, R. Movshovich, M. Nicklas, J. D. Thompson, J. L. Sarrao, and Z. Fisk, Physica B 312-313, 274 (2002).
- Hammersley et al. (1996) A. P. Hammersley, S. O. Svensson, M. Hanfland, A. N. Fitch, and D. Haüsermann, High Pressure Research 14, 235 (1996).
- Rodriguez-Carvajal (1993) J. Rodriguez-Carvajal, Physica B 192, 55 (1993).
- Brown (1999) J. M. Brown, J. Appl. Phys. 86, 5801 (1999).
- Piermarini et al. (1975) G. J. Piermarini, S. Block, J. D. Barnett, and R. A. Forman, J. Appl. Phys. 46, 2774 (1975).
- Vedel et al. (1987) I. Vedel, A. M. Redon, J. M. Mignot, and J. M. Leger, J. Phys. F: Metal Phys. 17, 849 (1987).
- Penney et al. (1982) T. Penney, B. Barbara, T. S. Plaskett, H. E. J. King, and S. J. LaPlaca, Solid State Commun. 44, 1199 (1982).
- Spain et al. (1986) I. L. Spain, F. Steglich, U. Rauchschwalbe, and H. D. Hochheimer, Physica B 139-140, 449 (1986).
- Kutty and Vaidya (1987) A. P. G. Kutty and S. N. Vaidya, in Theoretical and Experimental Aspect of Valence Fluctuations and Heavy Fermions, edited by L. C. Gupta and S. K. Malik (Plenum, New York, 1987), p. 621.
- Wassilew-Reul et al. (1997) C. Wassilew-Reul, M. Kunz, M. Hanfland, D. Haüsermann, C. Geibel, and F. Steglich, Physic B 230-232, 310 (1997).
- Sidorov et al. (2002) V. A. Sidorov, M. Nicklas, P. G. Pagliuso, J. L. Sarrao, Y. Bang, A. V. Balatsky, and J. D. Thompson, Phys. Rev. Lett. 89, 157004 (2002).
- Sparn et al. (2002) G. Sparn, R. Borth, E. Lengyel, P. G. Pagliuso, J. L. Sarrao, F. Steglich, and J. D. Thompson, Physica B 319, 262 (2002).
- Muramatsu et al. (2003) T. Muramatsu, T. C. Kobayashi, K. Shimizu, K. Amaya, D. Aoki, Y. Haga, and Y. Onuki, Physica C 388-389, 539 (2003).
- Monthoux and Lonzarich (2004) P. Monthoux and G. G. Lonzarich, Phys. Rev. B 69, 064517 (2004).
- Muramatsu et al. (2001) T. Muramatsu, N. Tateiwa, T. C. Kobayashi, A. Shimizu, K. Amaya, D. Aoki, H. Shishido, Y. Haga, and Y. Onuki, J. Phys. Soc. Jpn. 70, 3362 (2001).
- Nicklas et al. (2004) M. Nicklas, V. A. Sidorov, H. A. Borges, P. G. Pagliuso, J. L. Sarrao, and J. D. Thompson, Phys. Rev.B 70, 020505(R) (2004).
- Harrison (1980) W. A. Harrison, Electronic Structure and the Properties of Solids (Freeman, San Francisco, 1980).
- Harrison (1983) W. A. Harrison, Phys. Rev. B 28, 550 (1983).
- Straub and Harrison (1985) G. K. Straub and W. A. Harrison, Phys. Rev. B 31, 7668 (1985).
- Harrison and Straub (1987) W. A. Harrison and G. K. Straub, Phys. Rev. B 36, 2695 (1987).
- Wastin et al. (2003) F. Wastin, P. Boulet, J. Rebizant, E. Colineau, and G. H. Lander, J. Phys.:Condens. Matter 15, S2279 (2003).
- Kalychak et al. (1989) Y. M. Kalychak, V. I. Zaremba, V. M. Baranyak, V. A. Bruskov, and P. Y. Zavalii, Izv. Acad. Nauk SSSR Metally 1, 209 (1989).
- Maehira et al. (2003) T. Maehira, T. Hotta, K. Ueda, and A. Hasegawa, J. Phys. Soc. Jpn. 72, 854 (2003).
- Pagliuso et al. (2001) P. G. Pagliuso, C. Petrovic, R. Movshovich, D. Hall, M. F. Hundley, J. L. Sarrao, J. D. Thompson, and Z. Fisk, Phys. Rev. B 64, 100503(R) (2001).
- Bauer (2004) E. D. Bauer (2004), private Communication.
- Doniach (1977a) S. Doniach, in Valence Instability and Related Narrow Band Phenomena, edited by R. D. Parks (Plenum, New York, 1977a).
- Doniach (1977b) S. Doniach, Physica B 231-234, 231 (1977b).
- Thompson and Lawrence (1994) J. D. Thompson and J. M. Lawrence, Handbook on the Physics and Chemistry of Rare Earths (North-Holland, Amsterdam, 1994), vol. 19, chap. 133, pp. 383–477.
- Cornelius and Schilling (1994) A. L. Cornelius and J. S. Schilling, Phys. Rev. B 49, 3955 (1994).
- Cornelius et al. (1997) A. L. Cornelius, A. K. Gangopadhyay, J. S. Schilling, and W. Assmus, Phys. Rev. B 55, 14109 (1997).
- Cornelius et al. (2001) A. L. Cornelius, P. G. Pagliuso, M. F. Hundley, and J. L. Sarrao, Phys. Rev. B 64, 144411 (2001).
- Thompson et al. (2003) J. D. Thompson, M. Nicklas, A. Bianchi, R. Movshovich, A. Llobet, W. Bao, A. Malinowski, M. F. Hundley, N. O. Moreno, P. G. Pagliuso, et al., Physica B 329, 446 (2003).
- Sarrao et al. (2002) J. L. Sarrao, L. A. Morales, J. D. Thompson, B. L. Scott, G. R. Stewart, J. R. F Wastin, P. Boulet, E. Colineau, and G. H. Lander, Nature 420, 297 (2002).
- Wastin et al. (2004) F. Wastin, P. Boulet, E. Colineau, J. Rebizant, G. H. Lander, J. D. Thompson, J. L. Sarrao, and L. A. Morales (2004).
- Nakatsuji et al. (2002) S. Nakatsuji, S. Yeo, L. Balicas, Z. Fisk, P. Schlottmann, P. G. Pagliuso, N. O. Moreno, J. L. Sarrao, and J. D. Thompson, Phys. Rev. Lett. 89, 106402 (2002).