Crucial role of sidewalls in velocity distributions in quasi-2D granular gases
Abstract
Our experiments and three-dimensional molecular dynamics simulations of particles confined to a vertical monolayer by closely spaced frictional walls (sidewalls) yield velocity distributions with non-Gaussian tails and a peak near zero velocity. Simulations with frictionless sidewalls are not peaked. Thus interactions between particles and their container are an important determinant of the shape of the distribution and should be considered when evaluating experiments on a constrained monolayer of particles.
pacs:
81.05.Rm, 45.70.-n, 05.20.Dd, 05.70.LnGranular materials can mimic the behavior of different states of matter, including a gaskadanoff ; williams ; biot ; goldhirsch . Since collisions with grains are inelastic, the gaseous steady state can only be maintained by external forcing. Despite much recent work, the form of the velocity distribution for a driven granular gas remains an open question — velocity distribution functions found in experiment mustard ; nature ; urbach ; urbach2 ; urbach3 ; losert ; kudrolli ; kudrolli3 ; wolpert ; aranson ; rouyer , simulation aranson ; moon ; pagnani ; barrat ; barrat2 ; brey , and theory ernst ; BNK ; antal ; puglisi differ significantly.
The velocity distribution function for elastic particles in equilibrium is Gaussian. Distributions obtained for inelastic granular gases are typically not Gaussian and are often fit to a function of the form
| (1) |
where and are fitting parameters, and mustard ; losert ; aranson ; rouyer ; barrat2 ; brey ; moon . Several experiments and simulations with different geometries and forcing mechanisms have found losert ; aranson ; rouyer ; barrat2 although Gaussian distributions () have also been observed nature ; urbach3 . Simulations have revealed distributions that are not described by a single function but instead display a crossover from at low velocity to at high velocities brey ; moon . The value has been obtained for the large velocity limit for the special case of a gas of inelastic frictionless particles with homogeneous stochastic forcing and no gravity ernst .
Many experiments have been conducted on monolayers of particles urbach ; urbach2 ; urbach3 ; losert ; kudrolli ; kudrolli3 ; wolpert ; rouyer because limiting the motion in one dimension allows the use of a video camera to record the entire velocity field. Since velocities in the suppressed direction can never be fully eliminated, these systems are quasi-2-dimensional (2D), not strictly 2D. In such confined geometries, particles can make as many or more collisions with the wall as with other grains during one driving cycle. Collisions with walls may then influence the shape of the velocity distribution function. We find that the confining sidewalls play a major role in determining the velocity distribution function, which we obtain from experiments and simulations on a vertically oscillating monolayer of spheres whose motion is suppressed in one horizontal direction.
Experiment. Our experimental setup, which is similar to that in rouyer , used stainless steel balls of diameter mm, contained between vertical sidewalls (Plexiglas plates) with a separation of . The container had an interior horizontal dimension of and vertical dimension of . It oscillated with a frequency Hz, and the peak non-dimensional acceleration was , which corresponds to an amplitude . The container was evacuated ( Pa) to avoid hydrodynamic interactions. Each run used new balls that were cleaned in ethanol and sonicated. In our experiment particles gained energy only through collisions with the bottom of the container (in earlier measurements at rouyer , particles collided with the top as well as the bottom of the container, which was not evacuated). Particle motions were recorded by a digital camera (Phantom v4, Vision Research) at a rate of frames per second. Particle displacements were resolved with an accuracy of mm (). Statistical properties were obtained by averaging over drive cycles and 20 different phases in the cycle.
Simulation. An event-driven algorithm described in bizon was used for the simulation, which was conducted for the same , , and sidewall separation as the experiment. The parameters characterizing ball-ball interactions were the minimum coefficient of restitution , the coefficient of sliding friction , and the rotational coefficient of restitution . The coefficient of restitution varies with relative normal velocity () as described in bizon : the coefficient of restitution is the maximum of and . The TC model of Luding and McNamara luding was also used to prevent inelastic collapse by setting the coefficient of restitution to unity if a particle was involved in another collision within seconds of the previous one. For interactions between balls and the container (both the sidewalls and bottom), we used the same values for and , but we varied the coefficient of sliding friction with the wall from (no sidewall or bottom friction) to . To reproduce the experiment, particles were simulated in a box of height , width , and plate separation . The entire box was oscillated vertically so the particles collided with moving sidewalls, in addition to the bottom, as in the experiment.
Steady-state distributions. Collisions of particles with the bottom plate inject energy mainly into vertical motion. Energy is transferred into the horizontal direction directly through particle-particle collisions and through collisions of rotating particles with the bottom. Close to the bottom plate the areal density and the probability distributions for the horizontal and vertical components of velocity ( and ) vary considerably during each oscillation of the plate. However, far above the plate the density and velocity distributions become time independent, as has been shown by Moon et al. moon . Here we examine distribution functions for , which is in the steady state region – the density and horizontal velocity distribution functions change by less than during each cycle.
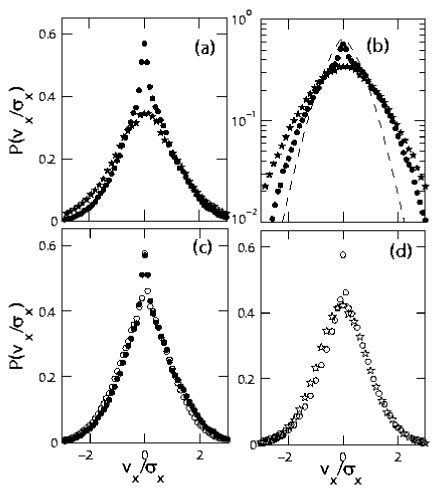
Our measured and simulated distributions are shown in Fig. 1. For clean particles in the experiment and non-zero wall friction in the simulation, the velocity distributions have an unusual characteristic: a sharply peaked maximum, a feature that has been observed before urbach ; kudrolli but has not been fully explored. (For , the shape of the distribution changes slightly with height in the box and phase of the driving cycle, but the sharp peak is always present.) We find that the peak disappears when we add approximately kg of graphite powder (a lubricant) to the kg of steel spheres goldman . The distributions observed with and without graphite both differ from those in rouyer (cf. Fig. 1(b)).
Experiment and simulation are compared in Fig. 1(c). For , the simulation results agree well with the experiment. The peak of the velocity distribution in the simulation decreases as is decreased, and the peak disappears completely for , as Fig. 1(d) shows.
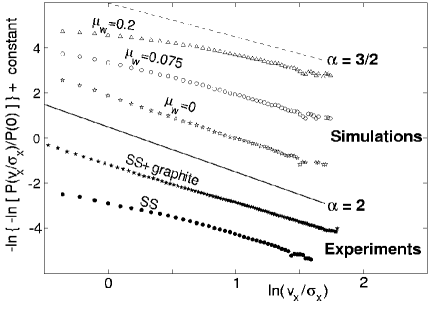
The distributions obtained from experiments on stainless steel particles with graphite and simulations with are described by a straight line on graphs like those in Fig. 2. The slope of such a graph yields the magnitude of the exponent in . In simulations without sidewall friction, , the exponent obtained is . An exponent of is found for the velocity distribution of stainless steel particles with graphite. The peaked distributions are not described by a single value of , but we can compare estimates of a local value of in the range : we obtain 1.8 for clean stainless steel particles, while in the simulation, increases from 1.3 with sidewall friction to with .
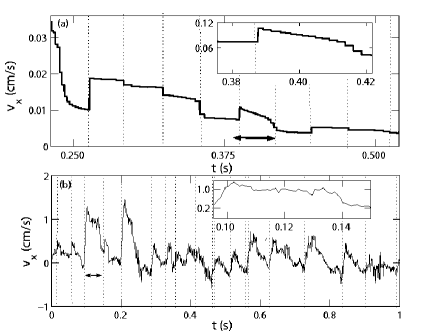
Single Particle Dynamics. We have shown that interactions with sidewalls strongly affect the functional form of the velocity distribution. This result is supported by our observations in simulations that in the steady state region, a ball collides with the wall typically three times as often as it collides with another ball. To isolate the effects of ball-wall collisions, we have conducted experiments and MD simulations on a single particle in an oscillating container (Fig. 3). Because there are no collisions with other particles, the particle’s motion is determined only by collisions with the bottom plate and the sidewalls. Figure 3(a) shows the time evolution of the horizontal velocity for a particle in a simulation with and . Each time a particle bounces on the bottom plate, some of the angular momentum of the particle can be transferred into linear momentum in the horizontal direction. These collisions would produce the only changes in if there were no interaction with the sidewalls, but Fig. 3(a) reveals more frequent smaller changes, which correspond to collisions with the sidewall. The staircase-like decrease in velocity (see inset) corresponds to a particle’s rattling between the sidewalls, losing energy at every collision. Thus the effect of the sidewalls is to damp the horizontal velocity. The ultimate fate of a single particle, regardless of its initial , is to bounce vertically on the bottom plate with .
The horizontal velocity measured for a single particle in the experiment is shown in Fig. 3(b). Collisions with the bottom plate, determined to be when the vertical component of velocity changes sign, are indicated by the dotted vertical lines. If there were no influence of the sidewalls, the horizontal velocity would remain constant between these lines. The behavior of the particle between collisions with the bottom plate is more complicated than in the simulation, but it is still clear that the horizontal velocity is damped by collisions with the walls. The damping of the horizontal motion of a single particle illustrated by Fig. 3 explains why the velocity distribution for a gas of particles has a peak at (Fig. 1). The over-populated high energy tails arise because for a distribution with a given variance, the increase in the central peak must be balanced by an increase for .
Single Particle Model. Features of the velocity distributions obtained from experiment and simulation are well described by a discrete map model with a damped driven single particle. The particle’s velocity is initially drawn from a Gaussian distribution of variance unity. The velocity at iteration n+1 is given by . For one percent of the iterations, randomly selected, we replace the velocity with a velocity drawn from a Gaussian distribution with variance unity. The velocity probability distribution is constructed from iterations. The exponential decay of the particle velocity between iteration steps corresponds to the numerous sidewall collisions that occur between excitations by the plate, and the random replacements of the particle’s velocity mimic plate collisions that transfer horizontal momentum to the particle.
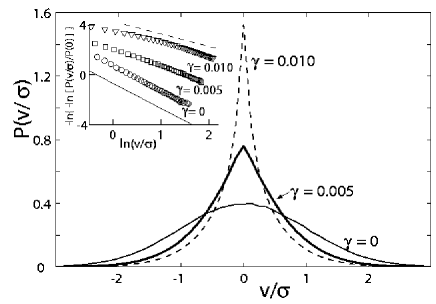
This model captures the qualitative behavior of the velocity distributions found in both experiment and simulations, as Fig. 4 illustrates. For finite damping, , the distribution is strongly peaked at , while in the absence of damping, , the distribution is Gaussian. Further, damping affects the tails of the distribution: as damping is decreased to zero, double logarithmic plots of the distribution become less curved and the slope increases from 1.3 to 2, just as in the MD simulation (Fig. 2).
The single particle model is similar to a model by Puglisi et al. puglisi that includes damping of the particle velocities. Increasing the damping in their model also led to non-Gaussian velocity distributions, but a strong peak around was not reported. This peak might be absent in their model because particles were driven not by discrete heating events but by continuous white noise, which for strong damping led to Gaussian behavior around in their model.
Conclusions. The kinetic theory of granular gases is often studied in experiments on confined monolayers of grains because the behavior of all grains for all times can be recorded. However, we have found that the ball-wall friction associated with the confinement should be included in interpreting experiments on monolayers in quasi-2D geometries, including vertical rouyer , inclined kudrolli , and horizontal layers urbach ; nature . Indeed, in an experiment with the last geometry the velocity distribution was peaked for a smooth plate urbach , but the peak disappeared when the smooth plate was replaced with a rough plate, which drove horizontal as well as vertical motion urbach3 . Similarly, a recent experiment with a layer of light particles on top of a layer of heavy particles yielded a non-Gaussian distribution for the heavier particles, but Gaussian statistics were found for the lighter particles nature . The interactions between the particles and the container in these quasi-2D systems may have been principal determinants of the shape of velocity distributions and therefore should be taken into consideration.
We thank Fred MacKintosh, Sung Joon Moon, and Erin Rericha for helpful discussions. This work was supported by the Engineering Research Program of the Office of Basic Energy Sciences of the U.S. Department of Energy (Grant No. DE-FG03-93ER14312), The Texas Advanced Research Program (Grant No. ARP-055-2001), and the Office of Naval Research Quantum Optics Initiative (Grant N00014-03-1-0639).
References
- (1) Y. Du, H. Li, L. P. Kadanoff, Phys. Rev. Lett. 74, 1268 (1995).
- (2) D. R. M. Williams, F. C. MacKintosh, Phys. Rev. E 54, R9 (1996).
- (3) J. Talbot and P. Viot, Phys. Rev. Lett. 89, 064301 (2002).
- (4) I. Goldhirsch and G. Zanetti, Phys. Rev. Lett. 70, 1619 (1993).
- (5) C. Huan, X. Yang, D. Candela, R.W. Mair, and R.L. Walsworth, Phys. Rev. E 69, 041302 (2004).
- (6) G. W. Baxter and J. S. Olafsen, Nature 425, 680 (2003).
- (7) J. S. Olafsen and J. S. Urbach, Phys. Rev. Lett. 81, 4369 (1998).
- (8) J. S. Olafsen and J. S. Urbach, Phys. Rev. E 60, R2468 (1999).
- (9) A. Prevost, D. A. Egolf and J. S. Urbach, Phys. Rev. Lett. 89, 084301 (1999).
- (10) W. Losert, D. G. W. Cooper, J. Delour, A. Kudrolli and J. P. Gollub, Chaos 9, 682 (1999).
- (11) A. Kudrolli and J. Henry, Phys. Rev. E 62, R1489 (2000).
- (12) D.L. Blair and A. Kudrolli, Phys. Rev. E 67, 041301 (2003).
- (13) A. Kudrolli, M. Wolpert, and J. P. Gollub, Phys. Rev. Lett. 78, 1383 (1997).
- (14) I.S. Aranson and J.S. Olafsen, Phys. Rev. E 66, 061302 (2002).
- (15) F. Rouyer and N. Menon, Phys. Rev. Lett. 85, 3676 (2000).
- (16) R. Pagnani, U.M. Bettolo Marconi, and A. Puglisi, Phys. Rev. E 66, 051304 (2002).
- (17) A. Barrat and E. Trizac, Phys. Rev. E 66, 051303 (2002).
- (18) A. Barrat and E. Trizac, Eur. Phys. J. E 11, 99 (2003).
- (19) J.J. Brey and M.J. Ruiz-Montero, Phys. Rev. E 67, 021307 (2003).
- (20) S. J. Moon, J. B. Swift, and H. L. Swinney, Phys. Rev. E 69, 031301 (2004).
- (21) T.P.C. van Noije and M.H. Ernst, Granular Matter 1, 57 (1998).
- (22) E. Ben-Naim and P.L. Krapivsky, Phys. Rev. E 61, R5 (2000).
- (23) T. Antal, M. Droz, and A. Lipowski, Phys. Rev. E 66, 062301 (2002).
- (24) A. Puglisi, V. Loreto, U. Marini Bettolo Marconi, and A. Vulpiani, Phys Rev. E 59, 5582 (1999).
- (25) C. Bizon, M. D. Shattuck, J. B. Swift, W. D. McCormick and H. L. Swinney, Phys. Rev. Lett. 80, 57 (1998).
- (26) S. Luding and S. McNamara, Granular Matter 1, 113 (1998).
- (27) D. I. Goldman, M. D. Shattuck, S. J. Moon, J.B. Swift and H. L. Swinney, Phys. Rev. Lett. 90, 104302 (2003).