Nuclear Magnetic Resonance Studies of -Stabilized Plutonium
Abstract
Nuclear Magnetic Resonance studies of Ga stabilized -Pu reveal detailed information about the local distortions surrounding the Ga impurities as well as provides information about the local spin fluctuations experienced by the Ga nuclei. The Ga NMR spectrum is inhomogeneously broadened by a distribution of local electric field gradients (EFGs), which indicates that the Ga experiences local distortions from cubic symmetry. The Knight shift and spin lattice relaxation rate indicate that the Ga is dominantly coupled to the Fermi surface via core polarization, and is inconsistent with magnetic order or low frequency spin correlations.
.1 Introduction
The investigavtion of the low temperature properties of plutonium and its compounds has experienced a renaissance in recent years, and several important experiments have revealed unusual correlated electron behavior sarraoPuCoGa5nature ; SmithBoringLANL ; LashleySpecificHeat . The 5f electrons in elemental plutonium are on the boundary between localized and itinerant behavior, so that slight perturbations in the Pu-Pu spacing can give rise to dramatic changes in the ground state character. In fact, Pu exhibits six allotropic forms in the solid state, with varying degrees of symmetry. The inability for band structure calculations to predict all six of these forms is testament to the complexity of the correlated electron behavior wills ; sarasov . -Pu, which exists between 576K and 720K, is the most technologically important form, and can be stabilized down to by doping with Al, Ga or In, which substitute for the Pu sites hecker . In particular, Pu1-xGax possesses the fcc structure and physical properties of -Pu for . It is not obvious why the small amount of the secondary element will stabilize the electronic structure of the phase, although clearly the slight perturbation reflects the itinerant-localization instability of the parent material.
Several theories have emerged to try to explain the stability of the phase. One technological challenge of band calculations in Pu is the ability to predict local versus itinerant behavior for the five 5f electrons, because the theoretical approaches for these two extremes are fundamentally different. These models typically predict either non-magnetic ground states, or ones where local Pu moments are retained wills ; magneticPutheory . In principle, such predictions can be tested by various experimental techniques.
Nuclear magnetic resonance (NMR) is ideal for probing magnetic correlations and local structure. 239Pu has a nuclear spin , so in principle it can serve as a direct probe of the magnetic correlations via the hyperfine interaction between the nuclear () and the electronic () spins. However, for 4f and 5f nuclei, is usually quite large (on the order of 1000 kOe/), so that fluctuations of of the electron spin relax the nuclei so fast that their signal is rendered invisible. On the other hand, the hyperfine coupling to the nuclei of the secondary element (Al, Ga or In) are typically one to three orders of magnitude smaller, so by measuring the secondary nuclei one can gain considerable insight into the spin dynamics of the system.
One of the challenges facing band theorists calculating the electronic structure of -Pu is the role of the secondary atoms. Recent x-ray absorbtion fine structure (XAFS) studies suggest that Pu lattice distorts locally around the Ga sites conradson . Clearly, these local distortions are caused by the electronic system, and should be captured by band structure calculations. Therefore, a detailed experimental study of these local distortions puts important constraints on any theory. NMR is also ideal for probing these local distortions, and serves as a complement to the XAFS data. Nuclei with spin experience electric quadrupolar interactions between the quadrupolar moment of the nuclei and the local electric field gradient (EFG), , where is the crystal field potential. Ga () is therefore sensitive to the EFG at the impurity site.
In this paper we present Knight shift (), spin lattice relaxation rate (), and linewidth () data on the Ga nucleus in a polycrystal sample of Pu1-xGax for between 4K and 100K. In the early 1970’s, Fradin, Brodsky, and coworkers at Argonne performed the first NMR experiments on -Pu stabilized with Al Fradin1970 . They found no evidence for any magnetic transition or the formation of local moments. Our work on Ga stabilized -Pu provide the only new data since the pioneering work of Fradin, and we find similar behavior. The Knight shift and data behave as in a typical conductor, and we find no evidence for either local moments at the Ga sites, or for strongly temperature dependent spin fluctuations fluss . On the other hand, we do not find that the EFG at the Ga site vanishes, as expected for a site with cubic symmetry. Rather, the Ga spectrum is inhomogeneously broadened by a distribution of EFGs. This result suggests that there are local lattice distortions with a symmetry lower than cubic at the Ga impurities.
.2 Experimental
In order to avoid radiological contamination of the NMR probe, we constructed an epoxy assembly to encapsulate the NMR coil as well as the Pu sample. However, since the Pu is subject to both self-heating as well as rf heating due to induced surface currents by the NMR pulses, it is crucial to establish a solid thermal contact to the sample. We therefore bored out the epoxy along the axis of the NMR coil, and secured frits (metallic screens) at the ends to allow the cold He gas to enter along the axis of the coil and establish a thermal contact with sample. The mesh of the frits is sufficiently fine to prevent any external contamination. This design allows us to cool the sample down to 2K with no significant heating problems, as measured by the nuclear polarization.
The Hamiltonian of the Ga nuclei is given by:
| (1) |
where is the gyromagnetic ratio, is the external field, , , is the quadrupolar moment of the Ga, and are the components of the EFG tensor. The hyperfine interaction is given by , where the sum is over the various spin contributions (conduction electrons, local spins). For a site with cubic symmetry, vanishes, so the effective Hamiltonian for the Ga nuclei in -Pu is simply:
| (2) |
where
| (3) |
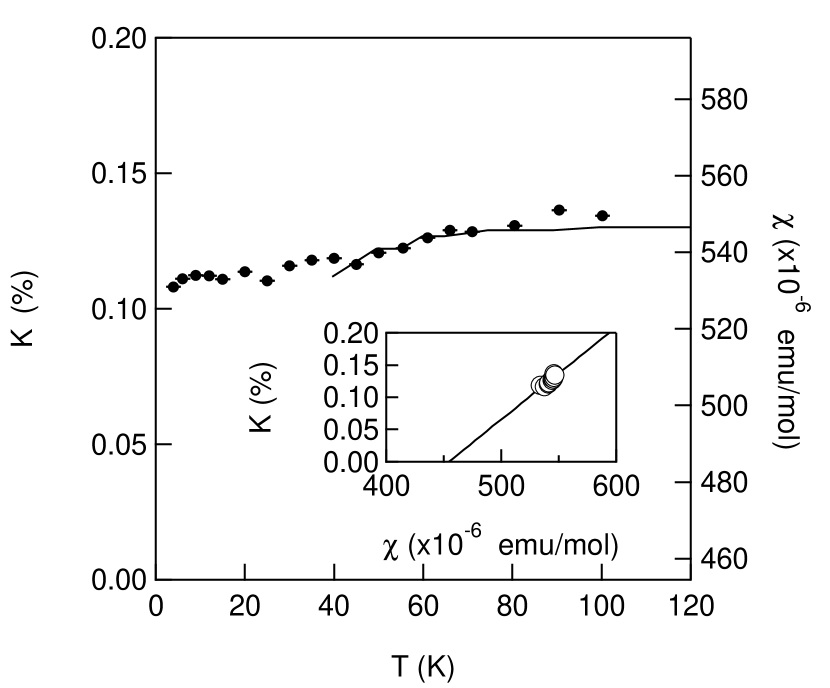
is a temperature independent orbital shift contribution, and is the hyperfine coupling to the component of the electronic susceptibility, .
In Fig. (1) we show the Ga spectrum at 4K. Note that this spectrum consists of all three nuclear transitions (), since the quadrupolar Hamiltonian does not lift the degeneracy. The spectrum is broadened, however, by a distribution of EFG’s, as we discuss below. The center of the resonance is somewhat lower in frequency than that of pure Ga metal, indicating a different Knight shift. We fit the spectra between 4K and 100K to a Gaussian; and the rms second moment, , are shown in Figs. (2,3). If we assume a single component of magnetic susceptibility, then following Eq. (3), we extract and by plotting versus , where is an implicit parameter (see inset of Fig. (2). We find and kOe/.

.3 Spin Lattice Relaxation
The spin lattice relaxation measures the time scale for the nuclear spin system to acquire an equilibrium Boltzmann distribution among the energy levels. Transitions between the nuclear levels are induced by time dependent fluctuating fields that are perpendicular to . The spin lattice relaxation rate, is give by:
| (4) |
where is the spatial Fourier transform of the hyperfine coupling in the perpendicular direction, is the dynamical -dependent susceptibility, and the sum is over the Brillouin zone. In this case, we expect that is isotropic and -independent, thus the spin lattice relaxation rate is sensitive to fluctuations for all , and any magnetic correlations or magnetic order should be reflected in .
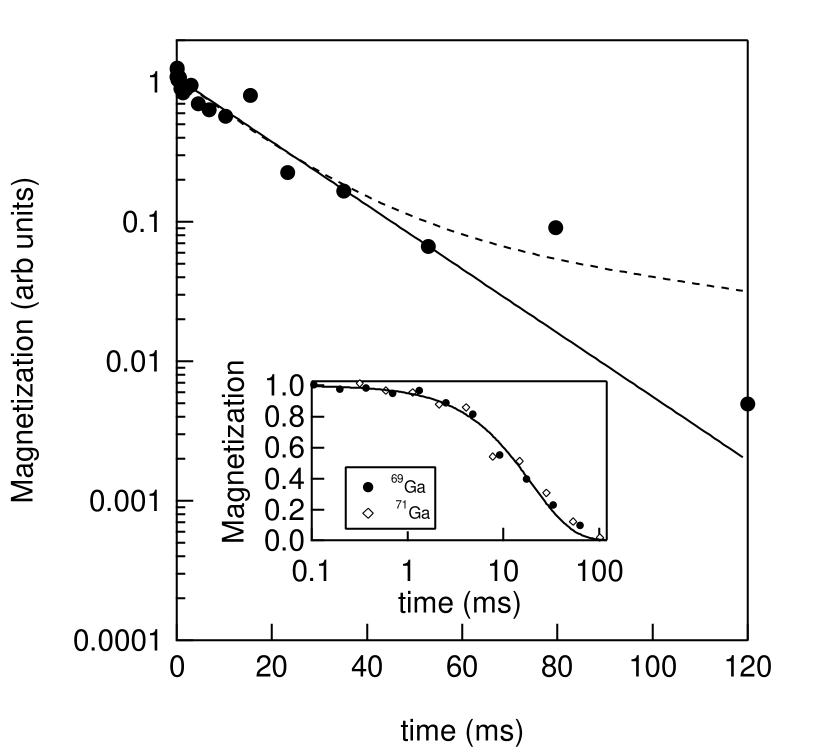
We measured the 69Ga by inversion recovery. In Fig. (4) we show data at 4K, which shows a single exponential. In principle, the recovery of the Ga can be more complex. However, since the satellites overlay the central transition (strictly speaking, the pulses have a bandwidth much greater than the EFG distribution) all nuclear levels are inverted by the pulses, and the recovery function simplifies to a single exponential of the form:
| (5) |
where , , and are fit parameters. If the EFG were actually much greater, and the satellite transitions () were either too broad to observe, or missing from the spectra for some reason, then the recovery of the observed central transition () would be of the form:
| (6) |
Clearly, as observed in Fig. (4), the data indicate a single exponential, which supports the conclusion that the Ga is located at cubic site. In the inset, we compare the relaxation of the 71Ga with that of the 69Ga. The time scale for the 71Ga has been scaled by (see Eq. (4)); the fact that the data for both sets of isotopes fall onto the same line indicates a magnetic relaxation mechanism, rather than a quadrupolar one (as might be expected for structural fluctuations, for example).
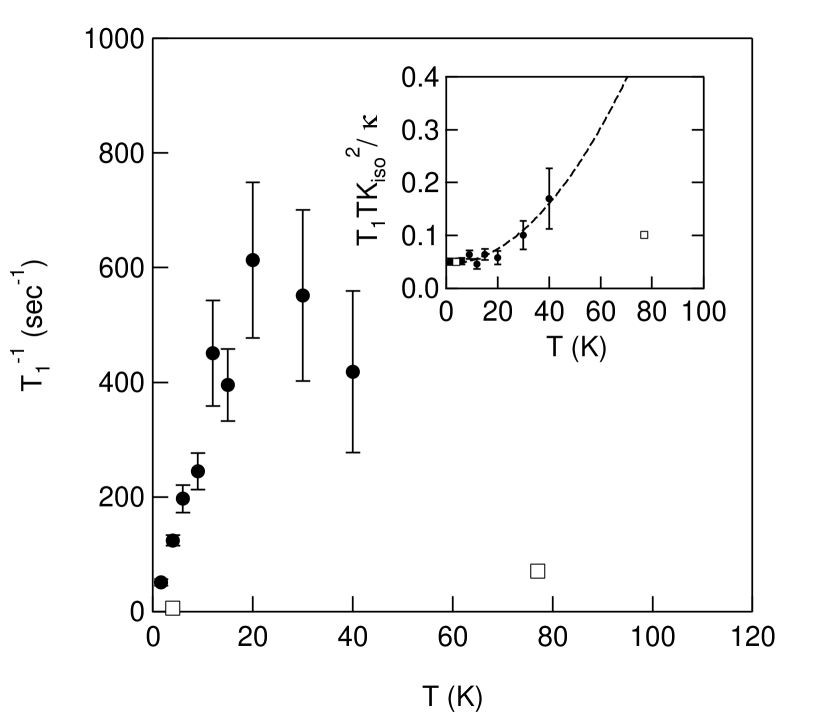
In Fig. (5) we show the temperature dependence of . In conductors where the dominant relaxation mechanism is by scattering with the conduction electrons via a single contact interaction, such as in the alkali earth metals, the Knight shift and the are related korringa : , where the Korringa constant is given by: . For convenience, we define , so for the simple case, is unity. Clearly this quantity approaches a constant value at low temperatures, as seen in the inset of Fig. (5). This result suggests the absence of magnetic correlations or magnetic order of the Pu spins, which would likely contribute a strong temperature dependence to .
The fact that suggests that hyperfine interaction in -Pu is more complex than in the alkali earth metals. Electron-electron correlations can give rise to an increase in , however is seen only in systems with a single hyperfine coupling pines ; CPSbook . The fact that suggests that there is more than one hyperfine coupling mechanism to the conduction electrons. In particular, if there were two hyperfine couplings, and , to two different conduction bands, then the Knight shift would be given by the sum , whereas the spin lattice relaxation rate would be given by the sum of the squares , so that naively one might expect . If and have different signs, then the measured ratio can be less than unity, as we observe. In fact, the measured suggests . A second, negative hyperfine coupling via core polarization is common in transition metals such as Platinum clogston . Given the complex electronic structure of -Pu, and the result that the f electrons have itinerant behavior, such a result is not surprising fradin ; joyce .
As seen in the inset, has a quadratic temperature dependence; we fit the data to . In transition metals, is a measure of the energy scale on which the density of states has structure away from the Fermi energy. Specifically, Yafet and Jaccarino find , where is the density of states jaccarino . Comparison with photoemission data or band structure calculations is difficult, however, since meV is less than their typical energy resolution joyce ; wills .
.4 Inhomogeneous Broadening

We now turn to the width of the NMR line. In principle, the resonance can be broadened by inhomogeneities in , by magnetic interactions with the other nuclei in the system, by local magnetic moments on the Pu sites, and by quadrupolar effects. The magnet has a homogeneity of 10ppm, so field inhomogeneities can be neglected. Let us define as the second moment of the NMR line spectrum. For a nucleus with we expect quite generally:
| (7) |
where is the contribution from magnetic moments in the system, is the contribution from non-zero EFG’s at the nuclear site, is the contribution from the anisotropic susceptibility and demagnetization fields in the powder, and is the second moment of the nuclear dipole interaction. Note that corresponds to like spin coupling (for example 69Ga-69Ga coupling) and corresponds to unlike spin coupling (69Ga-71Ga and 69Ga-239Pu) CPSbook . These quantities can be calculated for the fcc Pu lattice with randomly located Ga atoms, and depend on the orientation of the field with respect to the crystal parameters CPSbook . For our polycrystalline sample, the broadening is an average over the unit sphere; since varies by less than 50% over the unit sphere we have chosen the (100) field direction for concreteness. We find , , and . As seen in Fig. (3), the spectral broadening is much greater than the dipolar coupling. In order to determine the field dependent contribution, we measured the linewidth as a function of applied field, as seen in Fig. (7). Fitting the data to Eq. (7) we find G, a value still greater than than dipolar second moment, so the NMR spectrum must be inhomogeneously broadened by G kHz.
To test for inhomogeneous broadening we performed a hole burning test by saturating a narrow fraction of the line. We applied a low power pulse to the system prior to a broad-band echo sequence; the spectrum is shown in Fig. (6). Clearly, the full spectrum consists of the superposition of several narrow intrinsic lines. Note that the rms second moment for the ”hole” is 6.7G, a value on the order of the field independent broadening, but still greater than the calculated value. However, the excitation pulse in this case was still greater than the hole linewidth (but narrower than tha full spectral linewidth) , so it is doubtful that the measured hole linewidth reflects the intrinsic linewidth.

The inhomogeneous broadening arises either from magnetic moments in the system, or from a distribution of EFGs. In the latter case, we utilize the measured hyperfine coupling to estimate the size of the putative magnetic moment as . Such moments would not be detected in bulk susceptibility measurements. However, neither nor show any significant temperature dependence, as one might expect if these local moments were present in the system.
In fact, the most likely source of inhomogeneous broadening is from a distribution of EFGs which contribute the the quadrupolar linewidth. One way to test for this is to compare the linewidth of the 71Ga to that of the 69Ga. However, we find the surprising result that the 71Ga width is 76% larger than that of the 69Ga, whereas the quadrupolar moment of the 71Ga is 40% smaller! (Note, however, that the measured ’s (see Eq. 7) of the two isotopes do follow the ratio of the gyromagnetic ratios, as expected.) The reason for this discrepancy may be related to the fact that the sample had been held at temperatures K for several days prior to the measurements of the 71Ga. At these temperatures, the damage to the lattice inflicted by the radioactive decay of the Pu atoms is not annealed out, and is reflected in resistivity measurements fluss . One expects that the EFG will reflect lattice damage, thus it is reasonable that the inhomogeneous broadening is due to lattice distortions. In this case, the 4kHz broadening would correspond to a distribution of kHz in the local EFG at the Ga site.
Any perturbation from cubic symmetry at the Ga site will give rise to a finite EFG and consequently contribute to the line breadth. XAFS studies of the Pu-Ga distances in -Pu indicate that the lattice contracts slightly around the Ga impurities conradson , however it is not clear how the EFG will be modified as a result. Further studies are needed to determine what fraction of the quadrupolar line broadening arises from radioactive damage and what arises from lattice contraction around the Ga impurities.
.5 Decay of the Echo Envelope
The decay of the echo envelope can provide information about the like-spin coupling and the intrinsic linewidth. The spin echo is acquired by applying the pulse sequence , and occurs at a time after the first pulse. The integral of the spin echo is plotted versus in the inset of Fig. (3). In the limit where is highly anisotropic, so that the like-spin nuclear coupling is much larger in a particular direction, the form of the echo decay can be solved exactly in terms of pennington ; recchia ; curroslichter . In this case, the echo decay is Gaussian:
| (8) |
where . However, for the dipolar couplings discussed here, we are not in such a limit, and one cannot write down an exact form for the echo decay fine . Nevertheless, we find that the echo decay is indeed Gaussian with a time constant s. This value corresponds to a second moment of 0.105G2, a factor 10 times larger than calculated. Even though we do not have an exact form for the echo decay for dipolar couplings, one would expect a priori that the measured echo decay constant would be within an a factor of 2-3 of the like-spin second moment. Therefore, the fact that we find such a disparity is surprising. If the like-spin coupling is in fact larger than we estimated, then this result suggests one of three causes: (i) there exist indirect couplings between the Ga (unlikely due to their large spatial distances), or (ii) the effective Ga-Ga distance is smaller, as might be expected for Ga clustering, or (iii) the unlike Pu spins are fluctuating quickly, so that there is a fluctuating field at the Ga site that contributes to the dephasing of the Ga spins currocouplingHighTc . XAFS studies of the Ga distribution suggest that the Ga is distributed uniformly, so the most likely explanation for the enhanced echo decay rate is (iii) conradson . In fact, we do expect that the Pu nuclear spins have a very fast spin lattice relaxation rate, since they must have a large hyperfine coupling.
.6 Conclusions
Ga NMR in -Pu provides information both about the local structure and distribution of the Ga atoms, as well as the electronic spin fluctuations. We find that for 1.7 atomic percent doping, -Pu shows little evidence for local magnetic moments at the Pu sites, but that the hyperfine coupling between the Ga and the conduction electrons probably contains a contact as well as a core polarization term. Furthermore, the NMR spectrum is inhomogeneously broadened by a distribution of EFG’s at the cubic symmetric Ga site. More detailed studies of the linewidth as a function of doping should yield important information about the Ga distribution. It is worth noting that these experiments were conducted at temperatures lower than the proposed Kondo temperature of 200-300K fournier . Therefore, further studies at higher temperatures may shed light on the presence of spin fluctuations.
This work was performed at Los Alamos National Laboratory under the auspices of the US Department of Energy. We thank J. Sarrao, J. Thompson, J. Wills, M. Fluss, and C. P. Slichter for enlightening discussions.
References
- (1) J. L. Sarrao, L. A. Morales, J. D. Thompson, B. L. Scott, G. R. Stewart, F. Wastin, J. Rebizant, P. Boulet, E. Collneau, and G. H. Lander, Nature 420, 297 (2002)
- (2) A. M. Boring and J. L. Smith, Los Alamos Science 26 90 (2000)
- (3) J.C. Lashley, J. Singleton, A. Migliori, J.B. Betts, R. A. Fisher, J. L. Smith, and R.J. McQueeney, Phys. Rev. Lett. 91 205901 (2003)
- (4) J. M. Wills et al., cond-mat/0307767 and references therein.
- (5) S. Y. Savrasov, G. Kotliar and E. Abrahams, Nature 410 793 (2001)
- (6) S. S. Hecker, Los Alamos Science 26 90 (2000)
- (7) J. Bouchet, B. Siberchicot, F. Jollet and A. Pasturel, J. Phys.: Condens. Matter 12 1723 (2000)
- (8) S. D. Conradson, Appl. Spec. 52 252 1999)
- (9) F. Y. Fradin and M. B. Brodsky, Intern. J. Magnetism 1 89 (1970)
- (10) S. Meot-Reymond, and J. M. Fournier, Jour. Alloys and Compounds; 232 119 (1996)
- (11) J. Korringa, Physica 16 601 (1950)
- (12) D. Pines, Solid State Physics 1, ed. by F. Seitz and D. Turnbull (Academic, New York, 1955)
- (13) C. P. Slichter, Principles of Magnetic Resonance, 3rd. Ed. (Springer Verlag, New York, 1990)
- (14) A. M. Clogston, V. Jaccarino, and Y. Yafet, Phys. Rev. 134 650 (1964)
- (15) A. J. Arko, J. J. Joyce, L. Morales, J. Wills, J. Lashley,F. Wastin and J. Rebizant, Phys. Rev. B. 62 1773 (2000)
- (16) Y. Yafet and V. Jaccarino, Phys. Rev. 133 1630 (1964)
- (17) F. Y. Fradin in Plutonium and Other Actinides, edited by H. Blank and R. Lindner, (North-Holland, Amsterdam, 1976)
- (18) B. D. Wirth, A. J. Schwartz, M. J. Fluss, M.J. Caturla, M. A. Wall, W. G. Wolfer, MRS Bulletin 26 679 (2001); M. J. Fluss, et al., in press J. Alloys Comp.
- (19) C. H. Pennington and C. P. Slichter, Phys. Rev. Lett. 66, 381 (1991)
- (20) R. E. Walstedt and S- W. Cheong, Phys. Rev. B 51, 3163 (1995); C. H. Recchia, K. Gorny and C. H. Pennington, Phys. Rev. B 54, 4207 (1996)
- (21) N. J. Curro and C. P. Slichter, J. Mag. Res. 130, 186 (1998)
- (22) B. V. Fine, cond-mat/9707249
- (23) N. J. Curro, J. Phys. Chem. Solids 63 2181 (2002)