Fragmentation of a circular disc by projectiles
Abstract
The fragmentation of a two-dimensional circular disc by lateral impact is investigated using a cell model of brittle solid. The disc is composed of numerous unbreakable randomly shaped convex polygons connected together by simple elastic beams that break when bent or stretched beyond a certain limit. We found that the fragment mass distribution follows a power law with an exponent close to independent of the system size. We also observed two types of crack patterns: radial cracks starting from the impact point and cracks perpendicular to the radial ones. Simulations revealed that there exists a critical projectile energy, above which the target breaks into numerous smaller pieces, and below which it suffers only damage in the form of cracks. Our theoretical results are in a reasonable agreement with recent experimental findings on the fragmentation of discs.
pacs:
46.50.+aFracture mechanics, fatigue and cracks and 62.20.MkFatigue, brittleness, fracture, and cracks and 64.60.-iGeneral studies of phase transitions1 Introduction
Fragmentation of finite size systems is a widespread phenomenon in nature which is of considerable scientific and industrial interest. Despite the intense research in various fields of science and technology, complete analysis and understanding of fragmentation has not yet been achieved. In industry comminution, or the process of size reduction of granular materials, is very important. There is particular interest in the net energy required to achieve a certain size reduction and the energy distribution of fragments during the fragmentation process. For different comminution operations like crushing and grinding, early laws were developed by Von Rittinger, Kick and Bond mineral , having a relatively narrow size range of applicability. Many experimental and simulational studies have been undertaken to extend our understanding of fragmentation to a wider range of situations.
Fragmentation occurs over a wide range, from the collisional evolution of asteroids asteroids to the fragmentation of molecules critical ; cluster . At intermediate scales, there is the degradation of materials comprising small agglomerates employed in process industries such as pharmaceuticals, chemicals, fertilizers and detergents. There are also many geological examples associated with the use of explosives for mining such as oil shale industry, coal heaps etc. It was found in many cases that the probability density function of fragment masses follows a power law
| (1) |
Several numerical cluster ; diehl ; agglomerate ; discrete ; transition ; twodisc ; granulate ; britt ; droplet ; aspect ; branching ; univer and experimental asteroids ; ice ; eggs ; composite ; proton ; self ; scaling ; platelike ; glassplate studies have been performed on the fragmentation of solids and particle agglomerates induced by impact under different conditions. In all of these studies one obtains for the fragment mass distribution with an exponent depending on the dimensionality of the system, i.e. in higher dimensions usually a larger value of is obtained asteroids ; critical ; cluster ; diehl ; agglomerate ; discrete ; transition ; twodisc ; granulate ; britt ; droplet ; aspect ; branching ; univer ; ice ; eggs ; composite ; proton ; self ; scaling ; platelike ; glassplate . Table 1 summarizes the most important numerical and experimental results on impact fragmentation.
Recently, “lateral experiments” where a hypervelocity projectile strikes the side of a plate was carried out by T. Kadono platelike . Moreover, another experiment was carried by T. Kadono and M. Arakawa glassplate by shooting a cylindrical aluminum projectile with a diameter of 15mm and height of 10mm on thin Pyrex glass plate targets. They calculated the cumulative number of fragments larger than a given mass, and found that the resulting function was a power law with an exponent of about . This function is the integral of , so their results correspond to . They found two types of crack pattern during fragmentation process: radial cracks initiating from the impact point and cracks perpendicular to the radial ones. They considered that the radial cracks formed prior to the perpendicular ones platelike ; glassplate .
| Numerical Results | Exponent |
| Explosion of disc-shaped solids discrete ; granulate | 2.0 |
| Impact of a projectile into a block discrete ; granulate | 1.98 |
| Collision of two discs transition ; twodisc | 1.75 - 2.27 |
| Lennard-Jones solid in d=2 diehl ; univer ; ching | 1.4-1.5 |
| Experimental Results | Exponent |
| Collisional disruption of ice ice | |
| Fragmentation of shells eggs | 1.35 |
| Fragmentation of dry clay plates | |
| (for large fragments) composite ; self | 1.12 - 1.27 |
| Fragmentation of dry clay plates | |
| (for small fragments) composite | 1.5 - 1.67 |
| Proton-nucleus collision proton | 2.6 |
| Free fall of glass rods glassrod | 1.2-1.8 |
| Impact on glass tubes scaling | 1.5 |
| Fragmentation of plaster plates platelike | 1.1 - 1.3 |
| Fragmentation of glass plates glassplate | 1.7 |
| Peripheral Au + Au collisions Au | 2.2 |
In the present paper we have studied the lateral impact of a projectile into the right hand side of a disk following the experiments of Refs. platelike ; glassplate . Here we have taken a particle composed of numerous unbreakable, undeformable, randomly shaped polygons which are bonded together by elastic beams. This model has been used before for the study of the fragmentation process in different physical situations discrete ; transition ; twodisc ; granulate . The contacts between the elements (polygons) can be broken according to a physical breaking rule, which takes into account the stretching and bending of the connections. Based on simulations of the model, we performed a detailed study of the failure evolution at different impact energies and of the nature of the crack propagation during the fragmentation process. We also study the statistics of average fragment mass and average largest mass, the energy and velocity distributions of fragments during the fragmentation process when changing the imparted energy.
We have given an outline of the theoretical background of the model in Sec. 2, a short description of the basic mechanism of fragmentation process and crack propagation is presented in Sec. 3. The numerical results at different initial conditions are given in Sec. 4, where the velocity, energy and mass distribution of fragments, and the transition from damage to fragmentation are studied.
2 The model
To study fragmentation of granular solids, we performed molecular dynamic simulations (MD) in two dimensions. In order to better capture the complex structure of real solids, we used arbitrarily shaped convex polygons that interact with each other elastically. The model consists of three major parts, namely, the construction of a Voronoi cellular structure, the introduction of the elastic behavior, and finally the breaking of the solid.
The Voronoi construction, which is a random tessellation of the plane into convex polygons, was used to reflect the grain structure of the solid. One puts a random set of points onto the plane and then assigns each point that part of the plane which is nearer to it than to any other point. In our case, the initial configuration of the polygons was constructed using a vectorizable random lattice, which is a Voronoi construction with reduced disorder rand_lattic . One advantage of the Voronoi tessellation is that the number of neighbors of each polygon is limited which makes the computer code faster and allows us to simulate larger systems. We generate a square block of Voronoi cellular structure from which we cut out a disk, special care being taken to get a smooth outer surface. With different seed values of the Voronoi generator, different samples are obtained with differently shaped Voronoi cells. Previously this model has been applied to study fragmentation of solids in various experimental situations discrete ; transition ; twodisc ; granulate .
In the model the polygons are rigid bodies with three degrees of freedom in two dimensions: the two coordinates of the center of mass and the rotation angle. They are neither breakable nor deformable but they can overlap when pressed against each other. The overlap represents local deformation of the grains. Usually the overlapping polygons have two intersection points which define the contact line. In order to simulate the elastic contact force, we introduce a repulsive force between touching polygons. This force is proportional to the overlapping area divided by a characteristic length (, where , are the radii of circles of the same area of polygons), multiplied by a spring constant that is proportional to the elastic modulus divided by the characteristic length. The direction of the force is chosen to be perpendicular to the contact line of the polygons. Further, damping and friction of the touching polygons according to Coulomb’s friction law are also implemented.
To bond the particles together, the centers of mass of neighboring polygons are joined together with beams that exert an attractive, restoring force but can break in order to model the fragmentation of the solid. The cross section of the beams is the length of the common side of the neighboring polygons and the length is the distance between the centers of mass of the two polygons. The Young’s modulus of the beams and of the particles are independent of each other. The beams can be broken according to a physical breaking rule of the form of the von Mises plasticity criterion, which takes into account the stretching and bending of the connection
| (2) |
where is the longitudinal strain of the beam, and are the rotation angles at the two ends of the beams, and and are the threshold value of the two breaking modes. The breaking condition is checked at each iteration time step and those beams where condition (2) holds are removed from the calculation, and never restored. The surface of the grains on which beams are broken represents cracks. The energy stored in the broken beams represents the energy needed to create these new crack surfaces inside the solid.
The time evolution of the system is obtained by numerically solving Newton’s equations of motion of the individual polygons (Molecular Dynamics). For the solution of the equations we use a Gear Predictor-Corrector scheme of fifth order, which means that we have to keep track of the coordinates and all their derivatives up to fifth order.
| Parameters | symbol | Unit | Value |
|---|---|---|---|
| Density | |||
| Grain Young’s modulus | |||
| Beams Young’s modulus | |||
| Time step | |||
| Failure elongation | 3 | ||
| Failure bending | degree |
3 Fragmentation process and Crack Propagation
In the present paper we apply our model to explore the properties of the fragmentation process of a circular disc due to an impacting projectile. On the right hand edge of the disk, one polygon is chosen to be the center of the projectile. Then neighboring polygons are detected (shown in black in color in the figure). These polygons are all given a large initial velocity, directed towards the center of the disk, whose magnitude is obtained from the specified projectile energy.
 |
 |
| (a) | (b) |
 |
 |
| (c) | (d) |
 |
|
| (e) |
 |
 |
| (a) | (b) |
 |
| (c) |
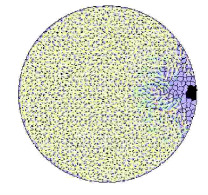
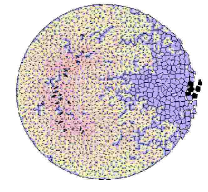
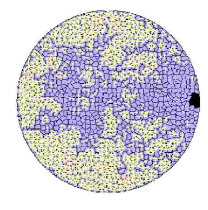
In Fig. 1 we present the fragmentation process obtained by simulation of a disk of radius cm and a projectile energy of erg. When the disk is struck by the projectile, a high compression wave is formed at the impact site, where practically all the beams are broken and all the fragments are single polygons. As the compression wave moves towards the center of mass, radial cracks form initiating from the impact point (see Fig. 1a). The amplitude of the initial compressive elastic pulse remaining after primary damage strongly depends on the initial imparted energy and the amount of primary damage that occurred in the contact zone. The pulse reflects at the free boundary with opposite phase generating an incoming elongation wave (Fig. 1b). A high stretched zone appears near the opposite boundary, which gives rise to high breakage of beams and the propagation of cracks oriented perpendicularly to the radial ones, Fig. 1c discrete . When almost all beams are broken in this zone, the incoming elongation wave moves further towards the impact point while simultaneously extending the cracks perpendicular to the radial ones. When the wave reaches the impact zone, the remaining energy is converted to kinetic energy of the fragments. So, at the end of the simulation many single polygons are flying away, back towards the origin of the projectile (Fig. 1d). At the end of the simulation we collected all the debris and reconstructed the disc to investigate the final crack pattern, see Fig. 1e.
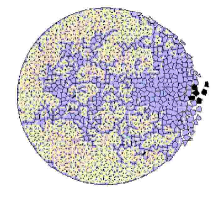
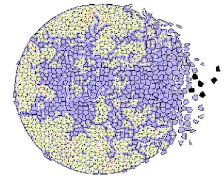
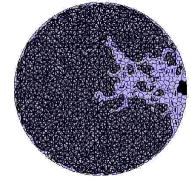
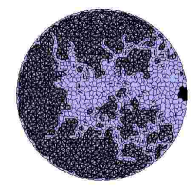
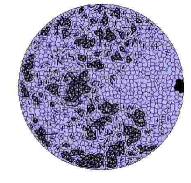
The final reconstructed state of crack pattern at the end of the fragmentation process obtained at different projectile energies is shown in Fig. 2. It is observed that at very low energy (Fig. 2a) mostly radial cracks are present which are the consequence of the expansion of the sample perpendicular to the direction of the projectile. In the energy range where solely radial cracks occur the disc practically keeps its integrity and suffers only damage in the form of cracks. Transverse cracks appear when the imparted energy approaches a certain critical value (Fig. 2b). At very high projectile energy (Fig. 2c), a large number of radial as well as transverse cracks form and the disc breaks into numerous smaller pieces.
Finally, two kinds of crack patterns are recognized: radial cracks initiating from the impact point and cracks perpendicular to the radial ones. The radial cracks developed prior to the perpendicular ones. The crack propagation and the final crack pattern obtained by simulations are consistent with the experimental results platelike ; glassplate .
4 Results
4.1 Transition from damage to fragmentation
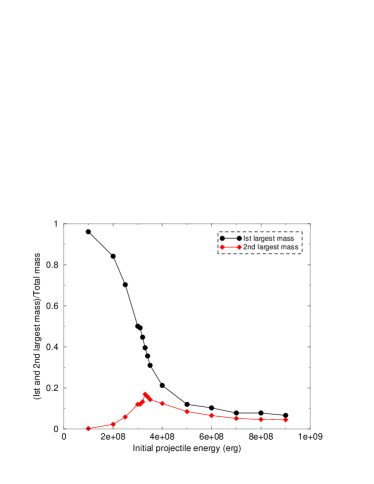
Previous studies on fragmentation identified a transition from damage, where the target maintains its identity, to fragmentation, where it is broken into many small pieces. The existence of these two states in the impact fragmentation of discs is confirmed by Fig. 3 where the mass of the largest and second largest fragment normalized by the total mass are plotted as a function of the projectile energy . At low energies the largest fragment contains nearly all the original mass, and all other fragments are much smaller. Thus, there are two classes of fragments: the largest mass is the almost intact target, and the other fragments are small pieces that were chipped off from the target by the projectile in the vicinity of the impact point. The target has only been damaged, not destroyed. At high energy however, the two largest fragments have comparable masses and they are much smaller than the total mass indicating a complete break up of the disc. In this energy range the target has been entirely destroyed by the projectile.
The transition between the two states occurs at a critical energy , which can be precisely defined as the energy that maximizes the second largest fragment. Its value was determined erg for the system size cm, and erg for cm. It is important to note that the curve of the mass of the largest fragment has a curvature change from convex to concave, the position of which coincides with the maximum of the second largest mass, i.e. with the critical energy .
 |
To analyze in more detail the final state of the fragmentation process, we evaluated the so called single event moments of fragment masses defined as
| (3) |
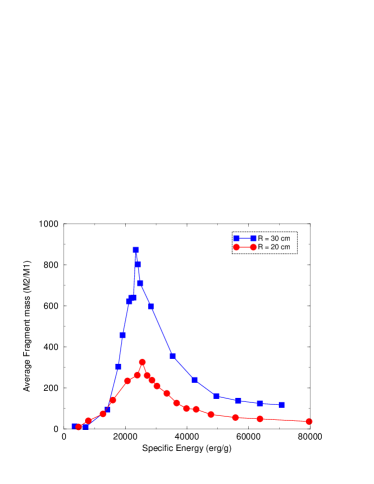
where denotes the total number of fragments and is the largest fragment mass. We evaluated the average fragment mass defined as the ratio of the second and first moments . In Fig. 4 is plotted as a function of the initial projectile energy for system sizes cm and cm, where each point represents an average over 20 simulations. The system again shows two distinct regimes, i.e., damaged and fragmented states, separated by a sharp maximum of at the critical energy . It is important to note that the transition point is nearly independent of the system size when plotted as a function of the specific energy, i.e., the ratio of initial projectile energy to initial total mass (see Fig. 4 a). It can also be observed that increasing the system size makes the peak of sharper, i.e. the width of the peak decreases while the height increases, which is typical for continuous phase transitions.
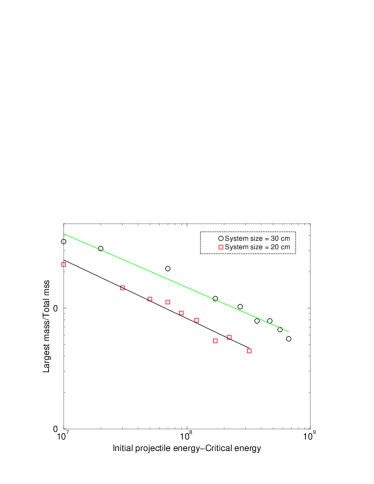
In order to characterize the behavior of the fragmenting system in the vicinity of the critical point we plotted the normalized mass of the largest fragment (where is the mass of the target) obtained at different imparted energies as a function of the distance from the critical point for . The value of was varied until a straight line was obtained on a double logarithmic plot which also provided an independent way of determination of from the previous ones. Fig. 5 shows that the functional form
| (4) |
is obtained above the critical point with a value of practically coinciding with the value determined previously. The value of the exponent was obtained as for cm and for cm. The two values are almost the same with a precision of implying that is independent of the system size.
4.2 The Fragment Mass Distribution
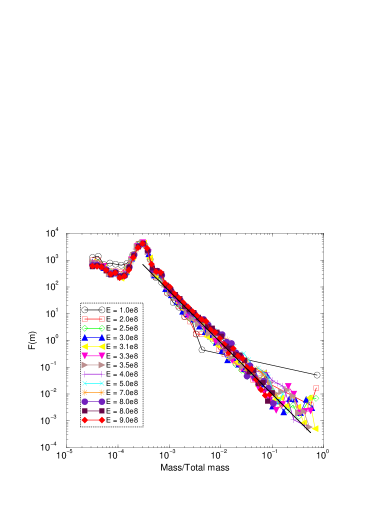 |
The fragment mass histograms are presented in Fig. 6 for the system size cm at varying initial projectile energy . is a probability density function so that its integral is unity. In order to resolve the shape of the distributions at a wide range of values, logarithmic binning was used, i.e., the binning is equidistant on logarithmic scale. The histograms have a maximum at small fragment sizes due to the existence of single unbreakable polygons. Below the critical energy the distributions have a peak at large fragments which gradually disappears when approaching the critical point due to the break up of large damaged pieces into smaller fragments. At the critical point becomes asymptotically a power law over almost three orders of magnitude of . For the two system sizes studied the exponents are found to be practically equal and close to , consistent with previous numerical works discrete ; transition ; twodisc ; granulate . More precisely, one obtains and for cm and cm, respectively. Above the critical point slight deviations from the power law can be observed in the regime of large fragments due to the finite size of the system. Since the effect is rather weak no definite form of this cut-off function could be deduced, while in other types of fragmenting systems an exponential cut-off function was obtained branching ; univer ; eggs .
4.3 Velocity distribution
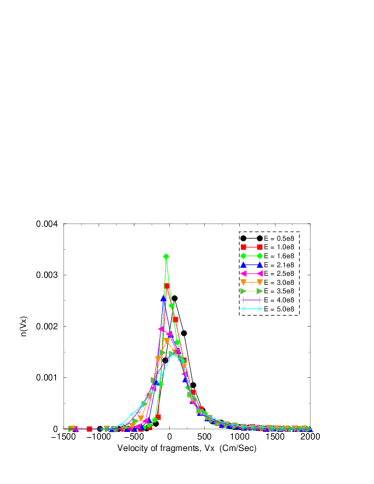
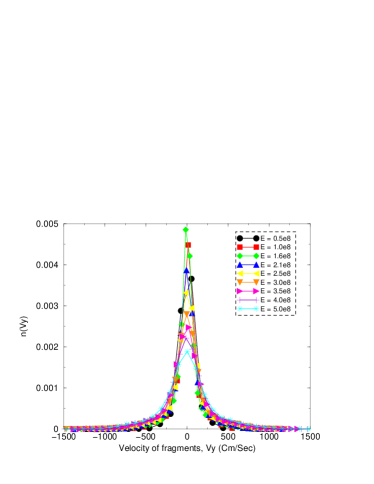
In Fig. 7 the probability distribution functions and of the - and -components of the final fragment velocities are plotted. The initial projectile velocity is in the negative direction. One surprising feature of the -component of the velocities is that the majority of fragments are moving in the positive direction, i.e., opposite to the initial direction of the projectile, and therefore opposite to the total momentum of the system. This probably occurs because numerous high speed fragments are ejected from the impact site, as shown in Fig. 1d. To satisfy momentum conservation, the fewer, more massive fragments must be moving in the opposite direction. Thus, mass and velocity are correlated, which is important to remember when we consider the energy distributions.
The distribution of the -component of the velocity is symmetric about as expected from the symmetry of the initial conditions. As the energy increases, the distribution broadens.
It is worth noting that the maximum of is largest when the projectile energy is equal to , which implies that many fragments are formed with low kinetic energy at the critical point. Hence, at the critical energy the efficiency of fragmentation is highest because the largest fraction of the imparted energy is used for cracking. Similar behavior is also observed in case of except that the maximum moves away from when the input energy approaches the critical energy from below, and then moves back towards as the projectile energy increases because the intensity of the elongation wave increases gradually beyond the critical point.
4.4 Fragment energies
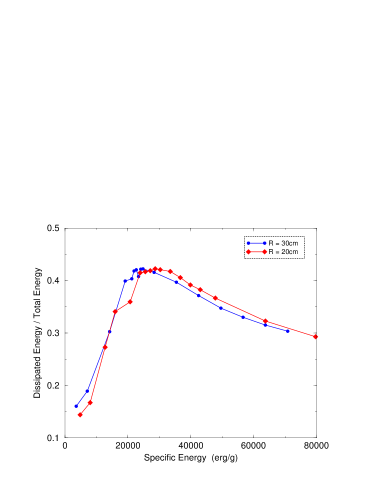
The efficiency of fragmentation can be quantified by the ratio of the energy dissipated by cracking to the imparted energy . In Fig. 8 the ratio is plotted as a function of the specific energy . Obviously, the number of broken bonds, and hence, is a monotonically increasing function of the imparted energy , however, the ratio shows a maximum at the critical energy independent of the system size, see Fig. 8. The highest fraction of used for cracking at the critical point can be estimated in the figure to be .
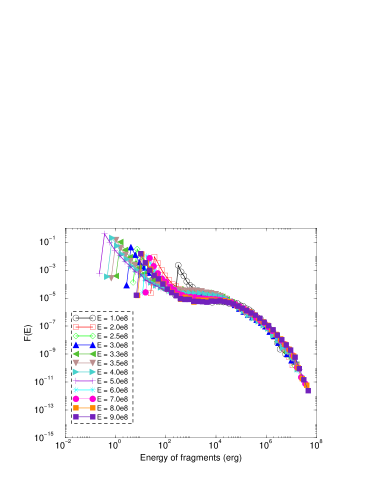
In Fig. 9, we show the energy distribution of the fragments. Unlike the mass distributions, there is no clear power law form. At large energies, it seems that holds, but a closer examination shows that the graphs are curved, not straight, in this region.
5 Conclusions
Motivated by recent experimental findings platelike ; glassplate , we have simulated the fragmentation of a disk by lateral impact of a projectile. The target was modeled as an assembly of unbreakable, undeformable polygons bound together by elastic beams. The simulation permits us to follow the fragmentation process in detail, allowing us to explain the crack patterns observed experimentally platelike ; glassplate . As the projectile energy increases a transition transition occurs from damage, where the target is not destroyed, to fragmentation, where the target is broken into many pieces. The transition clearly shows up in the behavior of the largest two fragments and the average fragment mass as a function of the imparted energy. We also found that the mass distribution obeys a power law over several orders of magnitude, with an exponent close to , in agreement with previous numerical results discrete ; transition ; twodisc ; granulate and experimental findings ice ; composite ; proton ; platelike ; glassplate ; Au on the fragmentation of two-dimensional objects. On the other hand, the energy distribution shows no such power law.
As far as the design of comminution processes is concerned, this work points out the importance of identifying the critical energy that separates damage and fragmentation. To maximize efficiency, such processes should be designed to deliver energies just above . If the energy is too low, the target must be struck several times in order to achieve a significant size reduction. If the energy is too high, much of it will be wasted, as size reduction does not increase much above the critical energy. Size reduction is usually not done with high speed projectiles, but rather through collisions with hard balls or with walls. Therefore, consideration of these circumstances is important.
References
- (1) A. M. Gaudin, Principle of Mineral Dressing, (Tata Mcgraw-Hill Publication, 1971).
- (2) D. L. Turcotte, Jour. Geophys. Res. 91 B2, 1921 (1986).
- (3) B. Farizon, M. Farizon, M. J. Gaillard, F. Gobet, M. Carre, J. P. Buchet, P. Scheier, and T. D. Mark, Phys. Rev. Lett. 81, 19 4108 (1998).
- (4) B. Farizon, M. Farizon, M. J. Gaillard, F. Gobet, C. Guillermier, M. Carre, J. P. Buchet, P. Scheier, and T. D. Mark, Eur. Phys. J. D 5, 5 (1999).
- (5) A. Diehl et al. Phys. Rev. E 62, 4742 (2000).
- (6) C. Thornton, K. K. Yin, and M. J. Adams, J. Phys. D 29, 424 (1996).
- (7) F. Kun and H. J. Herrmann, Comput. Meth. Appl. Mech. Eng. 138, 3 (1996).
- (8) F. Kun and H. J. Herrmann, Phys. Rev. E 59, 2623 (1999).
- (9) F. Kun and H. J. Herrmann, Int. Jour. Mod. Phys. C 7, 837 (1996).
- (10) G. A. D’Addetta, F. Kun, E. Ramm, and H. J. Herrmann, From solids to granulates - Discrete element simulations of fracture and fragmentation processes in geomaterials, Continuous and discontinuous modelling of cohesive-frictional materials, pp. 231-258 (2001), Lecture Notes in Physics (LNP) 568,Springer Verlag, Berlin.
- (11) J. Åström, M. Kellomäki and J. Timonen, Phys. Rev. E 55, 4757 (1997).
- (12) W. T. Ashurst and B. L. Holian, Phys. Rev. E 59, 6742 (1999).
- (13) H. Inaoka, E. Toyosawa, and H. Takayasu, Phys. Rev. Lett. 78, 3455 (1997).
- (14) J. Åström and J. Timonen, Phys. Rev. Lett. 78, 3677(1997).
- (15) J. A. Aström, B. L. Holian, and J. Timonen, Phys. Rev. Lett. 84, 3061 (2000).
- (16) E. S. C. Ching, Y. Y. Yiu, and K. F. Lo, Physica A 265 119 (1999).
- (17) M. Arakawa, Icarus 142, 34 (1999).
- (18) F. Wittel, F. Kun, H. J. Herrmann, and B. H. Kröplin, Fragmentation of shells, cond-mat/0402461.
- (19) A. Meibom and I. Balslev, Phys. Rev. Lett. Vol. 76, 2492 (1996).
- (20) A. S. Hirsch, A. Bujak, J. E. Finn, L. J. Gutay, R. W. Minich, N. T. Porile, R. P. Scharenberg, and B. C. Stringfellow, Phys. Rev. C 29, 508 (1984).
- (21) L. Oddershede, P. Dimon, and J. Bohr, Phys. Rev. Lett. 71, 3107 (1993).
- (22) E. S. C. Ching, S. L. Lui, and Ke-Qing Xia, Physica A 287, 83 (2000).
- (23) H. Katsuragi, D. Sugino, and H. Honjo Phys. Rev. E 68, 046105 (2003).
- (24) T. Kadono, Phys. Rev. Lett. 78, 1444 (1997).
- (25) T. Kadono and M. Arakawa, Phys Rev. E 65, 035107(R) (2002).
- (26) C. Moukarzel and H. J. Herrmann, Jour. Stat. Phys. 68, 911 (1992).
- (27) J. Pan, S. D. Gupta, and M. Grant, Phys. Rev. Lett. 80, 1182 (1998).
- (28) P. F. Mastinu et al, Phys. Rev. Lett. 76 2646 (1996).
- (29) H. J. Tillemans and H. J. Herrmann, Physica A 217, 261 (1995).
- (30) A. V. Potapov and C. S. Campbell Fourth year progress report, International Fine Particle Research Institute , Dept. of Mech. Eng., University of southern California, USA.