Interplay of structural and electronic phase separation in single crystalline La2CuO4.05 studied by neutron and Raman scattering
Abstract
We report a neutron and Raman scattering study of a single-crystal of La2CuO4.05 prepared by high temperature electrochemical oxidation. Elastic neutron scattering measurements show the presence of two phases, corresponding to the two edges of the first miscibility gap, all the way up to 300 K. An additional oxygen redistribution, driven by electronic energies, is identified at 250 K in Raman scattering (RS) experiments by the simultaneous onset of two-phonon and two-magnon scattering, which are fingerprints of the insulating phase. Elastic neutron scattering measurements show directly an antiferromagnetic ordering below a Néel temperature of K. The opening of the superconducting gap manifests itself as a redistribution of electronic Raman scattering below the superconducting transition temperature, K. A pronounced temperature-dependent suppression of the intensity of the (100) magnetic Bragg peak has been detected below . We ascribe this phenomenon to a change of relative volume fraction of superconducting and antiferromagnetic phases with decreasing temperature caused by a form of a superconducting proximity effect.
pacs:
74.25.Gz, 74.72.Dn, 78.30.Er, 75.25.+z, 74.50.+r.I INTRODUCTION
The development of different kinds of charge inhomogeneities at low temperature is a well known intrinsic property of many strongly-correlated-electron systems. Recent studies of Matsuda et al.Matsuda on very lightly doped La2-xSrxCuO4 show that even at the system demonstrates an electronic phase separation in which regions of hole-rich and hole-free phases are formed. This observation indicates the possibility for charges to create nonuniform phasesEmery in spite of low doping and an expected uniform distribution of Sr-dopants.
Oxygen-doped La2CuO4+δ presents a system in which charge inhomogeneities exist on the background of phase-separated oxygen interstitials,Jorg with an intimate interrelation of structural (excess oxygen) and charge subsystems. The discoverygran87 of high- superconductivity in samples of nominally pure La2CuO4 led to the first evidence of charge disproportionation in this material. The connection between superconductivity and the hole-rich phase with a finite concentration of interstitial oxygen was directly proved by annealing in high pressure oxygen.schi88 It was reported that after annealing, the superconducting volume fraction had been increased.Jorg Although the average concentration of charge carriers, roughly estimated as , was moderate, the relatively high temperature of the superconducting phase transition, K, was achieved even at .
Many investigations of La2CuO4+δ have focused on the structural aspects of the phase separation phenomena (for reviews, see Refs. Proc, ; JMT_rev, ). The powder neutron diffraction measurements by Jorgensen et al.Jorg showed that at low temperature, samples contained two very similar orthorhombic phases, a primary one with , and a second, oxygen-rich phase that was superconducting. At high temperatures, only a single phase was present, with a reversible oxygen phase separation occurring (in one sample) at 320 K. The development of electrochemical-oxidation techniquesGrenier ; Chou1 ; Radael1 has made it possible to determine the - phase diagram of La2CuO4+δ, the most prominent feature of which is a miscibility gap in the regionRadael2 . Elastic neutron scattering from large electrochemically-oxygenated single crystals revealed a new kind of periodicity in oxygen-rich regions—an ordering of the interstitially-occupied oxygen layers along the -axis, commonly referred to as staging behavior.Wells ; Xiong These results indicated that the phase diagram of La2CuO4+δ at higher oxidation levels includes new miscibility gaps separating regions of staged phases.Birgeneau
It is generally presumed that the first miscibility gap is driven by a tendency for holes doped into antiferromagnetic CuO2 planes to phase separate.Emery The phase separation is screened by the mobile oxygen interstitials. The existence of hole-poor and hole-rich phases at lower temperatures is demonstrated by the observations of, respectively, antiferromagnetic order and superconductivityansa89 ; hamm90 ; vakn94 ; however, the ordering temperatures are lower than the structural phase transition temperature for the interstitials. One motivation for the present work is to test more directly the connection between the electronic and interstitial phase separation transitions through the use of Raman scattering, which is sensitive to the presence of a correlated-insulator phase through two-magnon and two-phonon scattering.
Another aspect that we explore is the effect of quenched disorder. In samples of La2CuO4+δ prepared by electrochemical intercalation of oxygen in an aqueous solution, a reversible phase separation is generally observed.Wells ; Xiong In the oxygen-rich phase, the oxygen interstitials exhibit staging order, indicating substantial mobility of the oxygens. Modest reductions in the superconducting transition temperature, , can be achieved by rapid cooling.Chou2 In contrast, crystals intercalated electrochemically in a molten salt at relatively high temperature can exhibit a large distribution of lattice parameters at room temperature,Barilo indicative of quenched disorder. Previous studiesBalag ; Pomja of such crystals have indicated low oxygen mobility and depressed s of 15 to 25 K.
The sample that we study here has, as we will demonstrate, a fine-grained mixture of oxygen-poor and oxygen-rich domains, with substantial strain, at 300 K and below. Neutron diffraction indicates the gradual onset of antiferromagnetic order below 210 K, while is measured to be 24 K. These low transition temperatures, together with the absence of staging order of the interstitials in the oxygen-rich phase, indicate that quenched disorder has pinned the interstitial distributions within the first miscibility gap.Birgeneau
The first surprise that we observe is that the Raman signature of an insulating, antiferromagnetically-correlated phase does not appear until the sample is cooled below K, even though a significant degree of oxygen phase separation is already evident. As we will discuss, this result suggests that, contrary to expectations, the miscibility gap is driven largely by lattice, rather than electronic, energies. Such behavior is consistent with a study of miscibility gaps in the related system La2-xSrxNiO4+δ, where the structural phase diagram is found to depend only on the concentration of interstitials and not on the net hole concentration.huck03
The second surprise is a reduction of the antiferromagnetic Bragg peak intensity on cooling through K. A somewhat similar reduction in intensity has been observed in association with an electronic phase-separation phenomenon in La2-xSrxCuO4 with .Matsuda In the latter case, the lost intensity reappears as diffuse incommensurate scattering; however, we do not see such a response in our oxygen-doped sample. Instead, we suggest that the measurement indicates a reduction in the net volume of antiferromagnetic phase due to a superconducting proximity effect. Such a proximity effect may be necessary for the superconducting phase to propagate through the finely mixed insulating and metallic phases.
Behavior of this type, associated with quenched structural disorder, has been discussed recently by Dagotto and collaborators.Dagotto ; Burgy Their model calculations show some general features of competition between two ordered phases placed on the background of intrinsic inhomogeneities. Extended to manganites, this model predicts a colossal magnetoresistance effect. In the case of underdoped cuprates at low temperatures with competing superconductivity and antiferromagnetism, the authors claim that one can expect a “colossal superconducting proximity effect.”Burgy Previously, such a phenomenon has been observed in underdoped YBa2Cu3O6+δ.Decca
The rest of the paper is organized as follows. A description of experimental details is given in the next section. The results are presented and discussed in Sec. III. Our conclusions are summarized in Sec. IV.
II EXPERIMENTAL DETAILS
As is now well known, the way of preparing La2CuO4+δ plays an important role with regard to the physical properties of this material and more especially its superconducting properties. Electrochemical oxidation has been shownGrenier to be a reliable and controlled method to induce an oxygen surplus. Using this process, oxygen atoms can be inserted into La2CuO4 at interstitial positions of the La2O2 layers leading to the formation of mobile holes of concentration in the CuO2 planes. Our crystal was prepared differently from the usual electrochemical-oxidation method in which the intercalation process occurs in an aqueous solution at a temperature of 100∘C and lower.Grenier ; Chou1 ; Radael1 ; Wells ; Xiong The oxygenation of our sample was performed electrochemically in a NaOH melt at C, with an electrical current density of 10 mA/cm2 for minutes. These are the same conditions used for crystal L2 in Ref. Zakh, . The oxygen excess was estimated to .
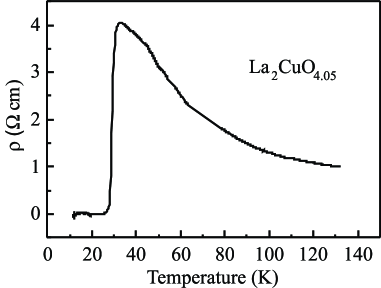
In-plane resistivity measurements on our sample, Fig. 1, show semiconducting behavior. If this were a single-phase sample, then given the large magnitude of the resistivity at , one would not expect it to go superconducting.fuku96 ; semb01 The crystal was also characterized by SQUID magnetometry. The superconducting transition temperature was found to be K (see inset in Fig. 4).
Elastic neutron scattering measurements were performed on the BT-2 triple-axis spectrometer at the NIST Center for Neutron Research. The sample was approximately 0.2 cm3 in size. After orienting the crystal on a holder, it was put into an Al can with He exchange gas, and then mounted on the cold finger of a closed-cycle He refrigerator. All of the diffraction measurements were performed using an incident neutron energy of 13.7 meV, with either one or two pyrolytic graphite filters in the incident beam to suppress neutrons at harmonic wavelengths. The resolution was varied by changing the horizontal collimators, as necessary.
Raman scattering measurements were carried out in quasi-backscattering geometry using the 514.5 nm argon-laser line. A piece of the same sample used for the neutron measurements was mounted on the holder of a He-gas-flow cryostat. The incident laser beam of 10 mW power was focused onto a spot of 0.1 mm diameter on the mm2 sample surface area. The scattered light was analyzed with a DILOR XY triple spectrometer combined with a nitrogen-cooled CCD detector.
To check the influence of the sample surface condition, the Raman measurements were performed both on the as-grown surface and on the mirror-like surface obtained by polishing and chemically etching in isopropanole and acetone. As no significant differences were observed, we report here the measurements performed on the polished surface. We note that the penetration depth of the laser light is about 2000 Å in cuprate superconductors.thom89 ; ShermanRev
The crystal structure of stoichiometric La2CuO4 is orthorhombic () at room temperature and tetragonal () above about 515K. The orthorhombic distortion is small and this allows us to assume tetragonal symmetry as is usually done in Raman studies of La-cuprates.Coop1 ; Coop2 The - and -axes were taken to be along the CuO bonds, with perpendicular to the CuO2 plane. Within the tetragonal point group , the geometry couples to excitations of symmetry, to symmetry, and to the combination of and symmetries. If and denote axes rotated by 45∘ from and , then geometry allows coupling to excitations with symmetry and geometry to a combination of and components. The spectra reported here were measured in the , , , and scattering configurations.
III RESULTS AND DISCUSSIONS
III.1 Structural data
For single crystals prepared electrochemically in an aqueous solution of NaOH, an ordering of the oxygen interstitials in oxygen-rich phases has been observed.Wells ; Xiong The interstitials separate into domains such that, in a given domain, interstitials are present only in every layer. This “staged” structure is easily identified by the presence of specific superlattice peaks. We expected that it should be possible to identify the oxygen content of the intercalated phase by characterizing the superlattice peaks. Surprisingly, neutron diffraction measurements on the present crystal revealed an absence of such superlattice peaks at all temperatures. On the other hand, measurements of fundamental Bragg peaks indicate the presence of two phases, with lattice parameters consistent with oxygen-rich and oxygen-poor phases.
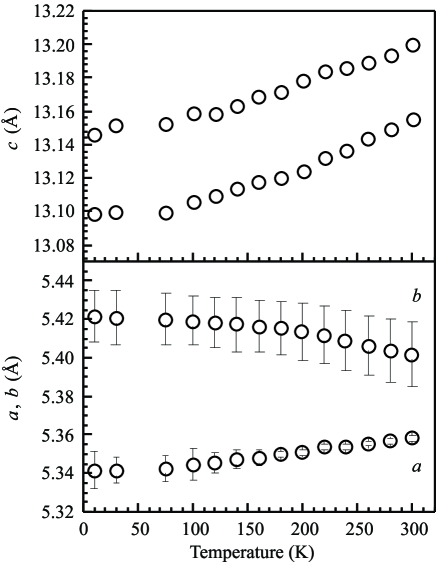
The presence of two phases is most clearly indicated by reflections, and we have focused on the (006). Although two distinct peaks cannot be resolved, the observed peak is quite broad and asymmetric. Fitting with two gaussian peaks yields the lattice parameters shown in Fig. 2(a). These results are consistent with previous studies of phase-separated samples.Radael2 ; Wells The phase with the larger lattice parameter should be the oxygen-rich phase. The difference between lattice parameters changes little with temperature, suggesting that the oxygen phase separation temperature, , is well above 300 K.
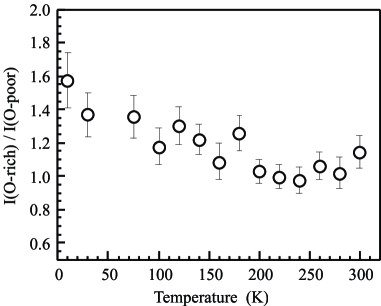
The relative intensities of the two fitted (006) peaks are shown as a function of temperature in Fig. 3. Assuming similar structure factors, there are comparable amounts of the two phases, with slightly more of the oxygen-rich phase. The temperature dependence of the relative intensities might indicate changes in the volume fractions; however, it is also possible that the changes are due to relief from extinction associated with strain. For the oxygen-rich phase, the widths of the (002), (006), and (008) Bragg peaks increase with momentum transfer, indicating a substantial amount of strain. This strain is expected to have an impact on the phase separation and oxygen ordering dynamics; it indicates a significant amount of quenced disorder. If we assume that the fitted peak widths obtained at (002) are due purely to particle-size broadening (ignoring resolution and strain), then we get a lower limit of 600 Å for the diameters of the oxygen-poor and oxygen-rich domains.
A scan through (200)/(020) shows two peaks. (These reflections are seen along the same direction because of twinning.) One should expect to see three peaks due to the difference in orthorhombicity found previously for the oxygen rich and poor phases.Radael2 The observed peaks are slightly asymmetric at low temperature, but a fit with more than two peaks is not stable over a broad temperature range. The lattice parameters obtained from the 2-peaks fits are shown in Fig. 2(b). The error bars reflect the distribution of lattice parameters determined from the peak widths after correcting for the calculated resolution. The width of the distribution is comparable to the splitting in for the two phases found by Radaelli et al.Radael2 The temperature dependence of structural superlattice peaks at (012) appears to be consistent with a very gradual decrease in orthorhombic splitting with increasing temperature.
III.2 Onset of insulating state and features of magnetic order
Raman spectra of La2CuO4.05 at different temperatures in the and polarization configurations are shown in Figs. 4 and 5, respectively. For both configurations, one can see very strong two-phonon scattering at low temperature, but very little at 295 K. (Note that there are no single phonon excitations above cm-1.) In addition, one can see strong two-magnon scatteringlyon88 of symmetry at cm-1 in the configuration when the two-phonon scattering is strong.
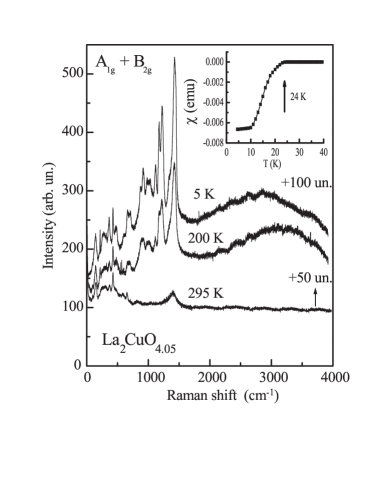
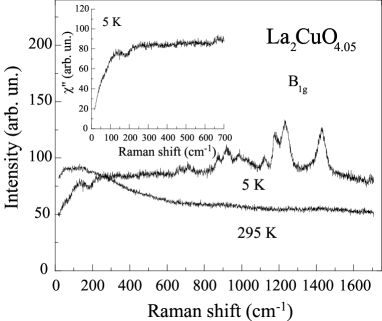
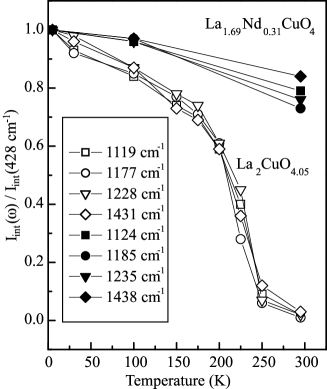
In Raman studies of La2-xSrxCuO4, Sugai and coworkersSug89 ; Sug90 have shown that strong two-magnon and two-phonon scattering peaks appear together in the antiferromagnetic-insulator phase at , but both are dramatically reduced in doped phases with . Thus, it appears that the two-phonon signal, along with the two-magnon scattering, is a useful indicator of the insulating phase. To test the temperature dependence of this signature, we performed measurements on the insulator La1.69Nd0.31CuO4.Wagener The temperature-dependent intensities of several two-phonon peaks, relative to the intensity of the single-phonon peak at 428 cm-1, are plotted in Fig. 6. We see that there is only a modest decrease in the intensity ratio between 5 K and 295 K.
The two-phonon intensity ratios for the La2CuO4.05 sample are also plotted in Fig. 6. Compared to the insulator, the relative two-phonon signal decreases more rapidly with increasing temperature, dropping rapidly toward zero near 250 K. We interpret these results as indicating the absence of an insulating phase for K, and the rapid appearance of the insulating phase for .
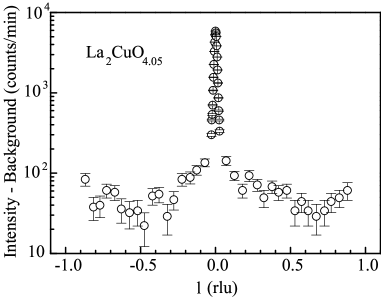
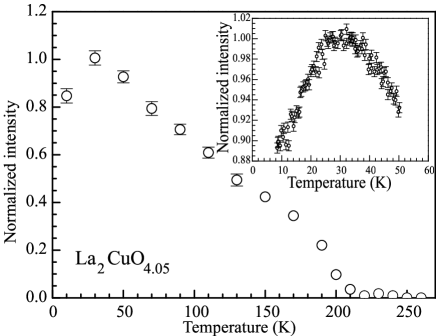
To detect the onset of antiferromagnetic order, we rely on neutron scattering measurements. Figure 7 shows a scan along through the magnetic Bragg peak at , measured at K. Besides the Bragg peak, there is also broad diffuse scattering along the antiferromagnetic rod. The temperature dependence of the (100) magnetic peak is shown in Fig. 8. The Néel temperature appears to be approximately 210 K, which is significantly lower than Tr. This magnetic ordering temperature is also lower than the more typical value of K found for the hole-poor phase in two-phase samples,JMT_rev thus indicating that the quenched disorder causes some frustration of the phase separation.
III.3 Analysis of the phase separation transitions
The neutron diffraction measurements indicate the presence of two phases near the two edges of the first miscibility gapRadael2 all the way up to 300 K. In previous studies, the oxygen-poor phase has been identified as an antiferromagnetic insulator, based on detection of antiferromagnetic order at lower temperatures; however, in our case the Raman spectra indicate that an antiferromagnetic insulating phase does not appear until the temperature drops below . How can we reconcile these observations?
Due to long-range Coulomb interactions, it is clear that some degree of electronic phase separation must occur concomitantly with the development of two phases with different interstitial concentrations. At the same time, the antiferromagnetic phase of lightly-doped La2CuO4 is quite sensitive to hole content, with dropping rapidly to zero at and the transport properties varying rapidly with in this regime.Kastner ; Ando Hence, the oxygen-poor phase at may correspond to . On cooling through , the electronic energies favoring expulsion of holes from the antiferromagnetic phaseEmery become important and drive a slight increase in the degree of phase separation, resulting in the onset of detectability of signatures of the antiferromagnetic phase. We presume that the slight adjustment of interstitial segregation at this point was masked in the diffraction experiments by the large strain effects.
The idea that the initial, high-temperature phase separation is driven largely by lattice energies rather than electronic energies is consistent with a recent studyhuck03 of room-temperature structural phase diagrams in the related system La2-xSrxNiO4+δ. With , pure La2NiO4+δ is known to have a complicated phase diagram with multiple miscibility gaps.JMT_rev If these phase separations were driven dominantly by electronic energies, then on co-doping with Sr, one would expect the phase boundaries to scale with the net hole content, . To the contrary, diffraction measurements on numerous samples clearly show that the phase boundaries depend almost exclusively on (at least for ). Thus, it appears that the lattice strain energies associated with interstitial oxygens must play an important role in the phase separation phenomena.
III.4 Competition between superconductivity and antiferromagnetism
The variation of the (100) magnetic peak intensity at low temperature is shown in the inset of Fig. 8. On cooling, the intensity appears to hit a plateau at about 35 K, and then below it decreases. This effect looks similar to that observedMatsuda in antiferromagnetic La2-xSrxCuO4 with , and in oxygenated La2CuO4 with extremely low Néel temperature ( K).suppression2 ; suppression1 However, in contrast to those observations, a corresponding increase in the diffuse magnetic scattering was not observed in our case.
The drop in the (100) magnetic peak intensity at low temperature is quite remarkable. We propose that the observed effect may involve a change in the relative volume fraction of metallic and insulating phases for temperatures below the superconducting phase transition. At such low temperatures the mobility of excess oxygen is negligible, so the changes should be largely electronic in nature. It appears that a form of superconducting proximity effect may be involved. The model calculations of Burgy et al.Burgy indicate that such a phenomenon may occur when a system with quenched disorder is below a normal-state percolative threshold. We note that the in-plane resistivity of our crystal (Fig. 1) looks qualitatively quite similar to calculated curves in Fig. 4(b) of Ref. Burgy, .
III.5 Features of the superconducting state
Since the discovery of high-temperature superconductivity, many experimental techniques, such as quasiparticle tunneling, angle-resolved photoemission, microwave absorption, IR and Raman spectroscopy, etc., have been used with the aim to clear up the nature of the superconducting gap (SCG). Raman scattering established itself as a powerful method to study this problem. At room temperature all cuprates exhibit a broad and rather flat background that is usually attributed to electronic excitations. As the temperature decreases below Tc, the frequency distribution of the electronic background changes reflecting the opening of the SCG. This renormalization consists of the formation of a broad peak associated with the pair-breaking process at the energy 2 together with the decrease of the scattering intensity at energies lower than 2. Unlike conventional superconductors with an isotropic gap, where no scattering is expected for frequencies , the low frequency depletion in high-temperature superconductors (HTSC’s) is not complete. Moreover, the peak frequency positions and renormalization of the scattering intensity below is different for , , and symmetry components. An appropriate choice of the polarizations of incident and scattered light in the RS experiment can reveal the SCG anisotropy and the symmetry of the order parameter.
Most of the RS experiments imply that the SCG in HTSC’s is strongly anisotropic.Coop1 ; Coop2 ; Hackl88 ; Hackl89 ; Stauff ; Dever94 ; Chen1 ; Chen2 ; Chen3 ; Chen4 ; Gasp ; Chen5 ; Misoch . Such a behavior was examined by different authors in the framework of a ,Scalap ; Month ,Kotliar or anisotropic -pairing.Chakr On the other hand, some experiments performed mainly on single CuO2-layered compoundsMason ; JChen ; Anlage ; Stadl suggest the presence of an isotropic -wave type gap. Up to now there is no definite consensus how to interpret these conflicting results. Furthermore, it is not clear whether the SCG anisotropy depends on doping level. Raman scattering experiments on Tl2Ba2CuO6+δ and Bi2Sr2CaCu2O8+δ showed that overdoped samples exhibit a symmetry independent gap in contrast to the anisotropic SCG in the near optimum doping case.Kendz A SCG anisotropy was observed in YBa2Cu3O7-δ with different doping levels.Chen6 ; Kall The anisotropy of the SCG and variation of the maximum in the electronic RS with scattering selection rules have been discussed in detail in a recent paper of M. Opel et al.Opel It was pointed out that -wave symmetry is widely accepted but complications arise both in the underdoped and overdoped ranges of the phase diagram. It is thus of interest to check the redistribution of the electronic continuum below in the metallic phase of the sample that undergoes phase separation.
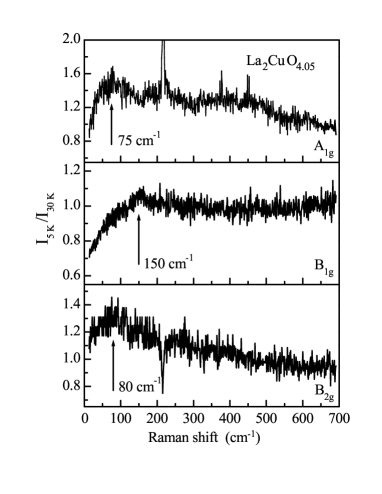
In our experiments on La2CuO4.05 a frequency redistribution of the electronic continua is observed in all scattering geometries investigated when the temperature decreases below K. In order to evaluate the scattering component, we subtracted the spectra from the spectra. To emphasize the redistribution of the scattering intensity in the superconducting state compared to the normal state, the spectra at 5 K were divided by the spectra just above . As one can see from Fig. 9, the low-frequency behavior of the electronic Raman scattering in La2CuO4.05 exhibits a strong anisotropy with respect to the symmetry components. The pair-breaking peaks are located at 75, 150, and 80 cm-1 for the , and geometries, respectively. As was described in detail earlier,Dever94 ; Gasp ; Dever95 the symmetry of the order parameter can be inferred from the specific spectral features for each scattering component. To our knowledge there are no results published on electronic Raman scattering in oxygen doped La2CuO4+δ. Therefore, we want to compare our data with experiments on Sr-doped La2CuO4.Chen3 ; Chen5 ; Misoch
Electronic RS studiedChen3 ; Chen5 in optimally doped La2-xSrxCuO4 supports the existence of an anisotropic SCG. Besides that, it was observed that the intensities in the low frequency portions of the and continua increase as and , respectively, in quantitative agreement with the -wave hypothesis. Electronic RS in La2-xSrxCuO4 with various levels of doping was studied in Ref. Misoch, . Theere, the anisotropy concerning the symmetry dependent energies of the maximum was confirmed; however, the low-frequency behavior was absent at all doping levels. This behavior can be attributed to resonance effects in Raman scattering.Sherman
We do not want to advocate here whether a -wave or anisotropic -wave pairing is appropriate to describe La2CuO4.05, but it should be noted that we also do not observe a law in the scattering component (see Fig. 9 and inset in Fig. 5 ). The data shown here are very consistent with the experimental results of Ref. Misoch, ; however, in our study the situation is complicated due to phase separation. As discussed above and shown in Fig. 4, for temperatures below we detect both the Raman signal characteristic for the insulating as well as the superconducting phases. Moreover, we expect the oxygen concentration of the oxygen-rich regions to vary significantly, consistent with the strain detected by neutron diffraction.
IV CONCLUSION
In summary, we have carried out Raman and elastic neutron scattering experiments on an excess-oxygen-doped La2CuO4 single crystal. The neutron diffraction measurements indicate that there are both oxygen-rich and oxygen-poor phases present in the sample and that the oxygen phase separation temperature is well above 300 K. The absence of detectable staging behavior in oxygen-rich regions allows us to conclude that a significant amount of quenched disorder must be present in the sample. In the Raman scattering experiments, the La2CuO4.05 sample displays at room temperature a response similar to cuprates with substantial doping. Below the temperature K, the RS spectra change drastically: features characteristic for the insulating state appear in the spectra. We have proposed that electronic energies cause an additional redistribution of interstitial oxygen at , making the oxygen-poor phase more insulating and resulting in the appearance of the two-phonon and two-magnon scattering. The Néel temperature K was estimated from the neutron scattering measurements. A decrease of the (100) magnetic Bragg peak intensity for is attributed to subsequent electron-density redistribution connected with a superconducting proximity effect. Below the superconducting transition temperature, two-magnon scattering, strong two-phonon scattering, and a change of the electronic continua (that occurs as a result of the superconducting gap opening) are observed in the RS spectra, simultaneously. Based on the polarization dependence of the electronic continua, we conclude that the SCG in La2CuO4.05 is anisotropic with an anisotropy ratio for the CuO2 plane. The peculiarities of the electronic RS, i.e., the low- frequency power law dependence of the different scattering components at low frequencies and their different peak positions, are found to be very close to those observed earlier for La2-xSrxCuO4.Misoch
Acknowledgments
We thank E. Ya. Sherman for helpful discussions. This work was supported in part by NATO Collaborative Linkage Grant PST.CLG.977766 and INTAS Grant 96-0410. JMT is supported at Brookhaven by the U.S. Department of Energy’s Office of Science under Contract No. DE-AC02-98CH10886. We acknowledge the support of the National Institute of Standards and Technology, U.S. Department of Commerce, in providing the neutron facilities used in this work.
References
- (1) M. Matsuda, M. Fujita, K. Yamada, R. J. Birgeneau, Y. Endoh, and G. Shirane, Phys. Rev. B, 65, 134515 (2002).
- (2) V. J. Emery, S. A. Kivelson, and H. Q. Lin, Phys. Rev. Lett. 64, 475 (1990); V. J. Emery and S. A. Kivelson Physica C 209, 597 (1993).
- (3) J. D. Jorgensen, B. Dabrowski, S. Pei, D. G. Hinks, L. Soderholm, B. Morosin, J. E. Schirber, E. L. Venturini, and D. S. Ginley, Phys. Rev. B 38, 11337 (1988).
- (4) P. M. Grant, S. S. P. Parkin, V. Y. Lee, E. M. Engler, M. L. Ramirez, J. E. Vazquez, G. Lim, R. D. Jacowitz, and R. L. Greene, Phys. Rev. Lett. 58, 2482 (1987).
- (5) J. E. Schirber, B.Morosin, R.M.Merill, P.F.Hlava, E.L.Venturini, J.F.Kwak, P.J.Nigrey, R.J.Baughman, and D.C.Ginley, Physica C 152, 121 (1988).
- (6) Proceedings of the Workshop on Phase Separation in Cuprate Superconductors, Erice, Italy, 6 - 12 May 1992, eds. K.A. Müller and G. Benedek (World Scientific, Singapore, New Jersey, London, Hong Kong, 1993).
- (7) J.M. Tranquada, in Neutron Scattering in Layered Copper-Oxide Superconductors, edited by A.Furrer (Kluwer, Dordrecht, The Netherlands, 1998), p. 225.
- (8) J.-C. Grenier, A. Wattiauz and M. Pouchard pp.187-207 in Ref. Proc, .
- (9) F. C. Chou, J. H. Cho, and D. C. Johnston, Physica C 197, 303 (1992).
- (10) P. G. Radaelli, J. D. Jorgensen, A. J. Schultz, B. A. Hunter, J. L. Wagner, F. C. Chou, and D. C. Johnston, Phys. Rev. B 48, 499 (1993).
- (11) P. G. Radaelli, J. D. Jorgensen, R. Kleb, B. A. Hunter, F. C. Chou, and D. C. Johnston, Phys. Rev. B 49, 6239 (1994).
- (12) B. O. Wells, R. J. Birgeneau, F. C. Chou, Y. Endoh, D. C. Johnston, M. A. Kastner, Y. S. Lee, G. Shirane, J. M. Tranquada, and K. Yamada, Z. Phys. B 100, 535 (1996).
- (13) X. Xiong, P. Wochner, S. C. Moss, Y. Cao, K. Koga, and N. Fujita, Phys. Rev. Lett. 76, 2997 (1996).
- (14) B. O. Wells, Y. S. Lee, M. A. Kastner, R. J. Christianson, R. J. Birgeneau, K. Yamada, Y. Endoh, and G. Shirane, Science 77, 1067 (1997).
- (15) E. J. Ansaldo, J. H. Brewer, T. M. Riseman, J. E. Schirber, E. L. Venturini, B. Morosin, D. S. Ginley, B. Sternlieb, Phys. Rev. B 40, 2555 (1989).
- (16) P. C. Hammel, A. P. Reyes, Z. Fisk, M. Takigawa, J. D. Thompson, R. H. Heffner, S W. Cheong, and J. E. Schirber, Phys. Rev. B 42, 6781 (1990).
- (17) D. Vaknin, J. L. Zarestky, D. C. Johnston, J. E. Schirber, and Z. Fisk, Phys. Rev. B 49, 9057 (1994).
- (18) F. C. Chou and D. C. Johnston, Phys. Rev. B 54, 572 (1996).
- (19) A. M. Balagurov, V. Yu. Pomjakushin, V. G. Simkin, and A. A. Zakharov, Physica C 272, 277 (1996)
- (20) V. Yu. Pomjakushin, A. A. Zakharov, A. M. Balagurov, F. N. Gygax, A. Schenck, A. Amato, D. Herlach, A. I. Beskrovny, V. N. Duginov, Yu. V. Obukhov, A. N. Ponomarev, and S. N. Barilo, Phys. Rev. B, 58, 12350 (1998)
- (21) M. Hücker, M. Chand, T. Vogt, J. M. Tranquada, and D. J. Buttrey, submitted to Phys. Rev. B; cond-mat/0312421.
- (22) S.N.Barilo, (private communication).
- (23) E.Dagotto, cond-mat/0302550.
- (24) J. Burgy, M. Mayr, V. Martin-Mayor, A. Moreo, and E. Dagotto, Phys. Rev. Lett. 87, 277202 (2001).
- (25) R. S. Decca, H. D. Drew, E. Osquiguil, B. Maiorov, and J. Guimpel, Phys. Rev. Lett. 85, 3708 (2000).
- (26) A. A. Zakharov, A. A. Nikonov, O. E. Parfionov, M. V. Tsetlin, V. M. Glaskov, N. V. Revina, S. N. Barilo, D. I. Zhigunov, and L. A. Kurnevich, Physica C 223, 157 (1994).
- (27) Y. Fukuzumi and K. Mizuhashi and K. Takenaka and S. Uchida, Phys. Rev. Lett. 76, 684 (1996).
- (28) K. Semba and A. Matsuda, Phys. Rev. Lett. 86, 496 (2001).
- (29) C. Thomsen and M. Cardona, in Physical Properties of High Temperature Superconductors I, edited by D. M. Ginsberg, (World Scientific, Singapore, 1989), p. 409.
- (30) E.Ya. Sherman, O.V. Misochko, and P. Lemmens, in Spectroscopy of High- Superconductors, edited by N.M. Plakida, (Taylor & Francis, London, 2003), p. 97.
- (31) S. L. Cooper, M. V. Klein, B. G. Pazol, J. P. Rice, and D. M. Ginsberg, Phys. Rev. B 37, 5920 (1988).
- (32) S. L. Cooper, F. Slakey, M. V. Klein, J. P. Rice, E. D. Bukowski, D. M. Ginsberg, Phys. Rev. B 38, 11934 (1988).
- (33) K. B. Lyons, P. A. Fleury, J. P. Remeika, A. S. Cooper, and T. J. Negran, Phys. Rev. B 37, 2353 (1988).
- (34) S. Sugai, Phys. Rev. B 39, 4306 (1989).
- (35) S. Sugai, T. Ido, H. Takagi, S. Uchida, M. Sato, and S. Shamoto, Solid State Commun. 76, (1990) 365.
- (36) W. Wagener, H.-H. Klauss, M. Hillberg, M. A. C. de Melo, M. Birke, F. J. Litterst, B. Büchner, H. Micklitz, Phys. Rev. B 55, R14761 (1997).
- (37) X. K. Chen, J. C. Irwin, J. Trodahl, T. Kimura, and K. Kishio, Phys. Rev. Lett. 73, 3290 (1994).
- (38) M. A. Kastner, R. J. Birgeneau, G. Shirane, and Y. Endoh, Rev. Mod. Phys. 70, 897 (1998).
- (39) Y. Ando, A. N. Lavrov, S. Komiya, K. Segawa, and X. F. Sun, Phys. Rev. Lett. 87, 017001 (2001).
- (40) Y. Endoh, K. Yamada, R. J. Birgeneau, D. R. Gabbe, H. P. Jenssen, M. A. Kastner, C. J. Peters, P. J. Picone, T. R. Thurston, J. M. Tranquada, G. Shirane, Y. Hidaka, M. Oda, Y. Enomoto, M. Suzuki, and T. Murakami, Phys. Rev. B 37, 7443 (1988).
- (41) B. Keimer, N. Belk, R. J. Birgeneau, A. Cassanho, C. Y. Chen, M. Greven, M. A. Kastner, A. Aharony, Y. Endoh, R. W. Erwin, and G. Shirane, Phys. Rev. B 46, 14034 (1992).
- (42) R. Hackl, W. Gläser, P. Müller, D. Einzel, and K. Andres, Phys. Rev. B 38, 7133 (1988).
- (43) R. Hackl, W. Gläser, P. Müller, D. Einzel, and K. Andres, Physica C 162-164, 1241 (1989).
- (44) T. Staufer, R. Nemetschek, R. Hackl, D. Muller, and H. Veith, Phys. Rev. Lett. 68, 1069 (1992).
- (45) T. P. Devereaux, D. Einzel, B. Stadlober, R. Hackl, D. H. Leach, and J. J. Neumeier, Phys. Rev. Lett. 72, 396 (1994).
- (46) X. K. Chen, J. C. Irwin, R. Liang, and W. N. Hardy, J. Supercond. 7, 435 (1994).
- (47) X. K. Chen, J. C. Irwin, R. Liang, and W. N. Hardy, Physica C 227, 113 (1994).
- (48) X. K. Chen, J. C. Irwin, J. Trodahl, T. Kimura, and K. Kishio, J. Supercond. 8, 495 (1995).
- (49) L. V. Gasparov, P. Lemmens, M. Brinkmann, N. N. Kolesnikov, and G. Güntherodt, Phys. Rev. B 55, 1223 (1997).
- (50) X. K. Chen, J. C. Irwin, H. J. Trodahl, M. Okuya, T. Kimura, and K. Kishio, Physica C 295, 80 (1998).
- (51) O. V. Misochko and S. Uchida, Physics Lett. A 248, 423 (1998).
- (52) D. J. Scalapino, E. Loh, and J. E. Hirsch, Phys. Rev. B 34, 8190 (1986).
- (53) P. Monthoux, A. V. Balatsky, and D. Pines, Phys. Rev. Lett. 67, 3448 (1991).
- (54) G. Kotliar, Phys. Rev. B 37, 3664 (1988).
- (55) S. Chakravarty, A. Sudbo, P. W. Anderson, and S. Strong, Science 261, 337 (1993).
- (56) T. E. Mason, G. Aeppli, S. M. Hayden, A. P. Ramirez, and H. A. Mook, Phys. Rev. Lett. 71, 919 (1993).
- (57) J. Chen, J. F. Zasadzinski, K. E. Gray, J. L. Wagner, and D. G. Hinks, Phys. Rev. B 49, 3683 (1994).
- (58) S. M. Anlage, D. H. Wu, J. Mao, S. N. Mao, X. X. Xi, T. Venkatesan, J. L. Peng, and R. L. Greene, Phys. Rev. B 50, 523 (1994).
- (59) B. Stadlober, G. Krug, R. Nemetschek, R. Hackl, J. L. Cobb, and J. T. Markert, Phys. Rev. Lett. 74, 4911 (1995).
- (60) C. Kendziora, R. J. Kelley, M. Onellion, Phys. Rev. Lett. 77, 727 (1996).
- (61) X. K. Chen, E. Altendorf, J. C. Irwin, R. Liang, and W. N. Hardy, Phys. Rev. B 48, 10530 (1993).
- (62) M. Kall, A. P. Litvinchuk, P. Larson, G. Brorsson, L. Borjesson, Physica C 235-240, 1095 (1994).
- (63) M. Opel, R. Nemetschek, C. Hoffmann, R. Philipp, P. F. Müller, R. Hackl, I. Tüttö, A. Erb, B. Revaz, E. Walker, H. Berger, and L. Forró, Phys. Rev. B 61, 9752 (2000).
- (64) T. P. Devereaux and D. Einzel, Phys. Rev. B 51, 16336 (1995).
- (65) E. Ya. Sherman, C. Ambrosch-Draxl, and O. V. Misochko, Phys. Rev. B 65, R140510 (2002).