Phase Decomposition and Chemical Inhomogeneity in Nd2-xCexCuO4±δ
Abstract
Extensive X-ray and neutron scattering experiments and additional transmission electron microscopy results reveal the partial decomposition of Nd2-xCexCuO4±δ (NCCO) in a low-oxygen-fugacity environment such as that typically realized during the annealing process required to create a superconducting state. Unlike a typical situation in which a disordered secondary phase results in diffuse powder scattering, a serendipitous match between the in-plane lattice constant of NCCO and the lattice constant of one of the decomposition products, (Nd,Ce)2O3, causes the secondary phase to form an oriented, quasi-two-dimensional epitaxial structure. Consequently, diffraction peaks from the secondary phase appear at rational positions () in the reciprocal space of NCCO. Additionally, because of neodymium paramagnetism, the application of a magnetic field increases the low-temperature intensity observed at these positions via neutron scattering. Such effects may mimic the formation of a structural superlattice or the strengthening of antiferromagnetic order of NCCO, but the intrinsic mechanism may be identified through careful and systematic experimentation. For typical reduction conditions, the (Nd,Ce)2O3 volume fraction is , and the secondary-phase layers exhibit long-range order parallel to the NCCO CuO2 sheets and are Å thick. The presence of the secondary phase should also be taken into account in the analysis of other experiments on NCCO, such as transport measurements.
pacs:
74.72.Jt, 75.25.+z, 75.50.Ee, 61.10.Nz, 61.12.Ld, 68.37.LpI Introduction
Since its discoveryTokura et al. (1989) in 1989, the electron-doped superconductor Nd2-xCexCuO4±δ (NCCO) has presented a number of experimental challenges to the understanding of the physics inherent to the system. Foremost among those is that, unlike other cationically substituted systems, NCCO is not superconducting in its as-grown state. Instead, a post-growth annealing procedure, typically consisting of high-temperature exposure to an argon or nitrogen atmosphere, is needed to induce superconductivity. Ostensibly, this is necessary to remove excess oxygen impurities, but the exact effect of the procedure is yet unclear.
Using X-ray and neutron diffraction as well as transmission electron microscopy, we find that an unintended byproduct of this reduction step is to partially decompose NCCO, forming layers of oriented epitaxial neodymium cerium oxide, (Nd,Ce)2O3. Because of a serendipitous match of lattice constants between NCCO and the secondary phase, certain (Nd,Ce)2O3 diffraction peaks are commensurate with the NCCO reciprocal lattice. Upon application of a magnetic field, (Nd,Ce)2O3 exhibits a paramagnetic response even at a temperature of 1.9 K. Knowledge about the structural and magnetic properties of the secondary phase is essential in order to separate intrinsic properties from extrinsic effects when investigating the connection between magnetism and superconductivity in NCCO. Specifically, the extensive data we present are inconsistent with the notion of a field-induced quantum phase transition from a superconducting to antiferromagnetic state of NCCO Kang et al. (2003a); Matsuura et al. (2003); NCC (a) and have a more prosaic origin – a paramagnetic impurity phase. A brief summary of some of our results was published recently.Mang et al. (2003)
This paper is organized as follows: after a discussion of the NCCO crystal structure (Sec. II) and of experimental details (Sec. III), we describe the oxygen-reduction procedure that is required to render NCCO superconducting in the cerium-doping regime (Sec. IV). We then summarize previous results for cubic rare-earth (RE) oxides of the form RE2O3 (Sec. V) and proceed to present our structural X-ray diffraction (Sec. VI) and TEM (Sec. VII) work. Finally, we present detailed magnetic neutron scattering results of the magnetic field effects observed in reduced NCCO in Sec. VIII, and discuss our results together with previous work in Sec. IX. A summary is given in Sec. X.
II Structure
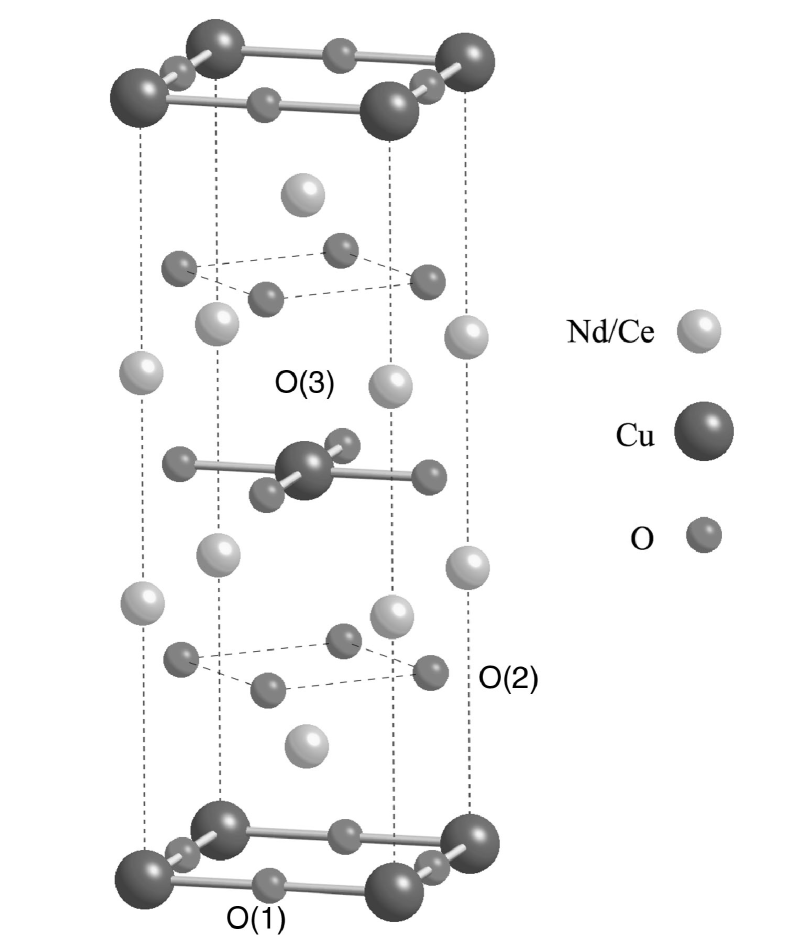
Nd2-xCexCuO4±δ crystallizes into a modified form of the body-centered tetragonal K2NiF4 structure found in other single-layer cuprate superconductors.Radaelli et al. (1994) The structure is tetragonal at all temperatures and is shown schematically in Fig. 1. What is unique about NCCO vis--vis other single-layer cuprates is the nominal absence of apical oxygen atoms. Manthiram and Goodenough (1990); McAllister et al. (2000); Bringley et al. (1990) Instead, the out-of-plane oxygen atoms are located directly above and below the in-plane oxygens. This is known as the structure. In the more common structure, oxygen atoms are present both above and below the copper site forming an octahedron as in hole-doped La2-xSrxCuO4. There exists a third, hybrid structure (), in which one of the apical sites is occupied while the other is vacant.
A key characteristic of the structure is the square-planar coordination of the copper site. Apical oxygen disorder has been put forward to explain why a reduction procedure is necessary to produce a superconducting phase in NCCO. According to that argument, the apical sites are randomly occupied by a small fraction of interstitial oxygen in as-grown crystals. In addition to changing the carrier density in the CuO2 sheets, this produces a random pinning potential for the doped electrons which prohibits superconductivity. The purpose of the reduction procedure is to remove the interstitial oxygen, after which superconductivity may occur. Unfortunately, this simple picture has been extremely difficult to verify. Generally, non-stoichiometric oxide materials can be stable for a wide range of oxygen concentrations Sorensen (1981) and the precise starting composition and oxygen site occupancies are typically unknown.
Based on single-crystal neutron diffraction studies, Radaelli et al.Radaelli et al. (1994) concluded that the apical O(3) site has an occupancy of at the position in as-grown Nd2CuO4±δ. In reduced samples, the occupancy was found to be lowered to . The authors also reported less than full occupancy at both the O(1) in-plane and O(2) out-of-plane sites, and these were not seen to vary beyond one standard deviation with reduction. Further neutron diffraction experiments on NCCO () showed a smaller amount of apical oxygen () in the as-grown state, which is lowered to upon reduction.Schultz et al. (1996) The diffraction data indicate that interstitial oxygen is probably present at the apical site in amounts negatively correlated with the cerium doping level. Presumably, this anticorrelation is a consequence of the contraction of the -lattice constant, Tarascon et al. (1989) which permits a decreasing number of interstitials at higher doping. The occupancies of the other two oxygen sites were found to be similar to the undoped case (). Because of the measured incomplete occupancy of the O(1) and O(2) sites, even with the presence of additional interstitial oxygen, summation over the oxygen site occupancies was found to give stoichiometries of 3.97(4) and 3.95(3) for as-grown undoped () and doped () compounds, respectively. This suggests that as-grown crystals may, in fact, be oxygen deficient. In any case, the amount of oxygen removed, particularly in the superconducting composition range (), is near the detection limit of neutron diffraction, further confounding efforts to understand the exact effect of the reduction step. A Mössbauer study on 57Co substituted NCCO gave evidence for the presence of apical oxygens even after reduction.Nath et al. (1994) Other methods of measuring the oxygen content, such as thermogravimetric analysis (TGA) and titration techniques, typically are not site specific.
III Experimental
All crystals used in this study were grown in the T.H. Geballe Laboratory for Advanced Materials at Stanford University using the travelling-solvent floating-zone (TSFZ) technique. As-grown, NCCO exhibits strong spin correlations in the paramagnetic phase and long-range antiferromagnetic order at low temperature. The crystals were grown in 4 atm of O2, which results in samples with relatively high oxygen content and Néel temperatures. man Cerium concentrations of the grown boules were verified by Inductively Coupled Plasma (ICP) analysis. The cerium solubility limit is close to . With the exception of the sample, for which ICP carried out on different crystal pieces indicated a somewhat inhomogeneous Ce distribution of , the Ce concentrations were found to be uniform. “Optimal” doping, with 24-25 K (onset), is achieved for suitable reduction conditions and cerium concentrations of . Details pertaining to the samples used in the present study are listed in Table I.
The room-temperature in-plane lattice constant of NCCO, Å, increases very slightly with doping, by about 0.3%. The -lattice constant decreases by about 1% with cerium doping, from 12.16 Å in the undoped material to 12.05 Å for . In this paper, we will index reflections according to two different schemes. One is based on the tetragonal unit cell of NCCO. The other is based on the cubic unit cell of Nd2O3.Moon et al. (1968) Reflections indexed according to the latter scheme will be marked by the subscript “c.”
X-ray diffraction data were taken in reflection mode at beam line 7-2 of the Stanford Synchrotron Radiation Laboratory. The beam was monochromatised at 14 keV from a wiggler spectrum using a Si(111) double-crystal monochromator. The X-ray attenuation length was approximately 20 m. Neutron diffraction data were taken using the spectrometers BT2 at the National Institute of Standards and Technology, E4 at the Hahn-Meitner-Institut in Berlin, Germany, and N5 at Chalk River Laboratories in Chalk River, Canada. Transmission electron microscope (TEM) images were taken with a FEI CM20 FEG-TEM instrument in the T.H. Geballe Laboratory for Advanced Materials at Stanford University.
IV Reduction
Regardless of the microscopic effects of the reduction step, it is clear that such a procedure is necessary to induce superconductivity. Kim and Gaskell Kim and Gaskell (1993) investigated the stability field of Nd1.85Ce0.15CuO4±δ as a function of temperature and oxygen partial pressure. They determined that Nd2-xCexCuO4±δ is unstable towards decomposition into (Nd,Ce)2O3 + NdCeO3.5 + Cu2O under sufficiently severe reducing conditions. Interestingly, they found that superconductivity only appears for conditions in which CuO is converted to Cu2O in the binary system Cu-O, and that the superconducting transition temperature monotonically increases as one approaches the phase decomposition boundary during the reduction process.
| Sample | x | Reduction Condition | Probe | (Nd,Ce)2O3 VF | Thickness (Å) |
|---|---|---|---|---|---|
| NCCO0111Insufficient data to determine thickness. | 0 | 890∘C/11 h/Ar | X-rays | 0.02% | - |
| NCCO10222Thickness determined from magnetic measurements of the (Nd,Ce)2O3 secondary phase (from fits shown in Fig. 13). | 0.10 | 960∘C/20 h/Ar; 500∘C/20 h/O2 | neutrons | 2% | 100 |
| NCCO14LR | 0.14 | 960∘C/1 h/Ar | X-rays | 0.02% | 50 |
| NCCO14 | 0.14 | 960∘C/20 h/Ar; 500∘C/20 h/O2 | X-rays | 1% | 70 |
| Core/Shell333Volume fraction and thickness are from X-ray diffraction on a small piece of crystal, prior to separating the sample into core/shell pieces. | 0.14 | 970∘C/10 h/Ar; 500∘C/20 h/O2 | neutrons, X-rays | 0.5% | 70 |
| NCCO1644footnotemark: 4 | 0.16 | 960∘C/20 h/Ar; 500∘C/20 h/O2 | TEM | 2% | 60 |
| NCCO18 | 0.18 | 960∘C/10 h/Ar | neutrons | 0.5% | 140 |
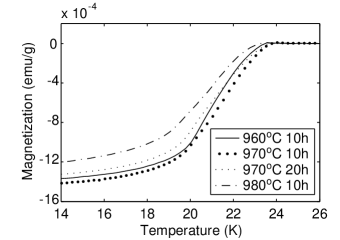
Our own studies indicate that the resultant superconducting state is highly dependent on the parameters used in the reduction process. Figure 2 demonstrates the sensitivity of the transition temperature and the magnetic susceptibility on the annealing conditions. In order to find optimal conditions, that is, conditions that result in a sample with the highest , we employed a tube furnace in which the sample was completely enclosed in a quartz tube and could be rapidly heated and quenched in a controlled atmosphere. We used high-purity argon gas containing less than 0.5 ppm O2. A series of small samples of approximately 400 mg were cut from a single-crystal boule of NCCO () and were exposed to an argon environment at different temperatures and for varying durations.Tem A measurable change in sample mass, ranging from 0.1% to 0.3% was observed, corresponding to a change in oxygen content on the order of . Samples annealed at 990∘C and above suffered severe damage and eventually decomposed. Examination of the reduced samples revealed that the interior of the sample was less damaged than the exterior. We find the optimal annealing conditions for to be 970∘C for 10 h in argon, followed by 500∘C for 20 h in oxygen. In general, the additional low-temperature oxygen anneal tends to increase by approximately 1 K. Other work Kurahashi et al. (2002) indicates the existence of two metastable phases for , with values of of 18 K and 25 K. The higher- samples were produced under conditions similar to ours, whereas the lower- ones were created in a more benign reducing environment with an oxygen concentration of 1000 ppm.
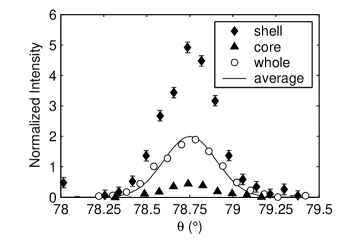
The difference we observed between the interior and exterior regions of our samples suggests that, because of the long time scale for oxygen diffusion, the resultant oxygen distribution in large reduced samples is not homogeneous. In order to test this proposition, we reduced a cylindrical crystal boule () and cut it into two halves, perpendicular to the cylinder axis. One half was mechanically ground down to remove the surface. This decreased the diameter from 4.2 mm to 3.2 mm and revealed the inner core of the crystal. The other half was cut lengthwise and the inner section was removed to create a hollow shell that was 1 mm thick. Transverse scans through the (1/2,1/2,1) magnetic Bragg reflection were taken for both the core and the shell pieces and are compared in Fig. 3 to a scan previously made on the entire boule. The magnetic signal from the shell piece is an order of magnitude stronger than that of the core, but the averaged signal of the two contributions, weighted by the mass of each section, essentially reproduces the signal of the whole sample. Due to the weakness of the signal, it is difficult to assess the exact onset of magnetic order in the core piece, but the Néel temperature ( K) does not likely differ by more than 20 K between the two pieces. This suggests that the core is in some sense the better sample, since it has an equally high superconducting transition temperature and a weaker antiferromagnetic phase. Remarkably, despite the large difference in the strength of the magnetic signal, no difference can be detected in the onset of superconductivity between the core and the shell piece. It is difficult to obtain accurate estimates of superconducting volume fractions from magnetic susceptibility data, and such measurements, performed on pulverized pieces of the core and shell sample, gave superconducting volume fractions of . It is possible that the reducing conditions employed are too severe, and that chemical decomposition destroys superconductivity beyond a certain threshold. The core piece, protected by the shell, is less exposed to the severe reducing atmosphere. This is consistent with work by Brinkmann et al.Brinkmann et al. (1995) who reported an extended superconducting dome down to in NCCO when samples were subjected to a reduction temperature of 1000∘C, but protected from decomposition by being sandwiched between chemically homogeneous polycrystalline slabs.
V Rare Earth Oxides
Rare-earth elements form polymorphic sesquioxides of the form RE2O3. There exist three low-temperature (A,B, and C) and two high-temperature (H and X) structural phases.Adachi and Imanaka (1998) The preferred phase varies with rare-earth ionic radius and temperature. In the case of Nd2O3, the trigonal A-modification is most commonly found. A second, cubic variant, the C-modification, has also been observed. The cubic phase has the bixbyite structure with space group (No. 206).Wyckoff (1963); Hahn (2002) The unit cell is very large, with 32 rare-earth ions occupying two different crystallographic sites. Because of the difficulty in preparing the cubic modification of Nd2O3 its magnetic structure is unknown, to the best of our knowledge. However, Moon et al.Moon et al. (1968) studied the magnetic structures of Er2O3 and Yb2O3, which also possess the bixbyite structure. The two systems were found to have Néel temperatures of K and 2.3 K, respectively, and differing antiferromagnetic structures, each describable by four magnetic sublattices. Complex magnetic field effects were observed for Er2O3, but not reported in detail.
VI Structural X-ray Diffraction
Additional diffraction peaks in reduced samples of NCCO have been observed previously by both electronIzumi et al. (1989) and neutronKurahashi et al. (2002) diffraction. These additional peaks have been attributed, respectively, to the formation of an oxygen vacancy superstructure and to coherent atomic displacements. Using X-ray diffraction, we investigated the formation of these additional peaks at two cerium concentrations: undoped () and optimally-doped (). Additional data for a lightly-reduced sample (not shown) are consistent with the results presented here.
The additional diffraction peaks are not observed in as-grown NCCO at any cerium concentration, but are present in all samples that have been subjected to a reduction treatment, including the undoped sample. The peaks appear relatively early in the reduction process, and were observable in a sample that had been reduced for only one hour, compared to the 10-20 h normally employed to obtain optimized superconducting properties. The samples exhibited varying degrees of diffuse scattering, examples of which will be given shortly. The sample with the sharpest additional peaks and the least diffuse scattering among all crystals studied with X-rays was an optimally-doped NCCO () crystal, which we discuss first.
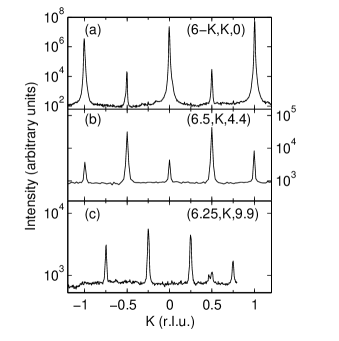
From Figs. 5 and 6 we identify three classes of additional peaks. Figure 5a reveals both the anticipated Bragg peaks from the NCCO structure at integer positions and an additional contribution at half-integer positions, such as (5.5,0.5,0). The latter are located at the same position in reciprocal space as the antiferromagnetic zone center, but are unconnected with magnetism in NCCO. Non-resonant X-ray scattering is only weakly sensitive to magnetism, and such peaks are visible at room temperature, well above the reported magnetic ordering temperature. The scan shown in the middle panel reveals a second set of half-integer peaks, such as (6.5,0,4.4), that occur when one in-plane index is an integer. The last panel reveals a final set of peaks occurring at quarter-integer positions, such as (6.25,0.25,9.9).
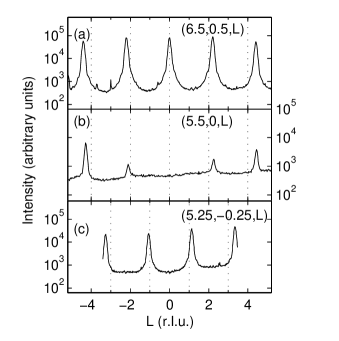
Although these peaks appear at rational and indices, they possess an unusual -dependence. Careful examination of Fig. 6 reveals that, for these three classes of peaks, the incommensurability systematically increases along the out-of-plane direction. This is different from scattering due to a superstructure, in which case the incommensurability is constant for all Brillouin zones. The additional diffraction peaks have indices of {0,1.1,2.2,…}. This peculiar -dependence suggests that these peaks are due to a secondary phase that is well oriented with the [001] surface of NCCO, and that the -lattice constant is approximately 10% smaller than that of NCCO.
The widths of the additional diffraction peaks are anisotropic with respect to the in-plane and out-of-plane directions. For example, while the half-width at half-maximum (HWHM) of the (5.5,0.5,2.2) peak along the in-plane scan direction ( r.l.u.) is only slightly larger than that of the NCCO Bragg peaks, the width along the out-of-plane direction ( r.l.u.) is an order of magnitude larger than for the NCCO Bragg peaks. As discussed in more detail below, this implies an in-plane correlation length of at least several hundred Å, an out-of-plane correlation length of only 30 Å, and a layer thickness of approximately 70 Å.
The width of the diffraction peaks emanating from the secondary phase can be used to estimate the average thickness of the epitaxial layers of (Nd,Ce)2O3. A lower-bound estimate is provided by converting the Gaussian half-width at half-maximum (HWHM) into an approximate correlation length using the critical scattering formula 1/HWHM(Å-1). The thickness might then be considered to be approximately twice the correlation length. An upper-bound estimate is provided by using the formula for diffraction from an -slit grating: , where is the number of unit-cell layers of the secondary phase and is expressed in reciprocal lattice units. Gibaud et al. (1993) The two functional forms provide estimates of the thickness that differ by approximately 40%. The -slit formula assumes that the epitaxial layers are of uniform thickness, and also implies the existence of secondary diffraction maxima (see, for example, Fig. 5 of Ref. Gibaud et al., 1993), which we do not observe for (Nd,Ce)2O3. Numerical simulations done assuming that the widths of the epitaxial layers are sampled from a distribution, and then averaging over the resultant signal to smooth out the secondary maxima, indicate that the -slit formula overestimates the average layer thickness by approximately 20%. On the other hand, the Gaussian formula underestimates it by approximately 20%. In this manuscript, the correlation length along [0,0,1] is estimated using the Gaussian formulism. However, the layer thickness obtained from diffraction, as reported in Table I, is corrected by a factor of 2.4 to account for both the 20% underestimation and the conversion from correlation length (half-thickness) to thickness.
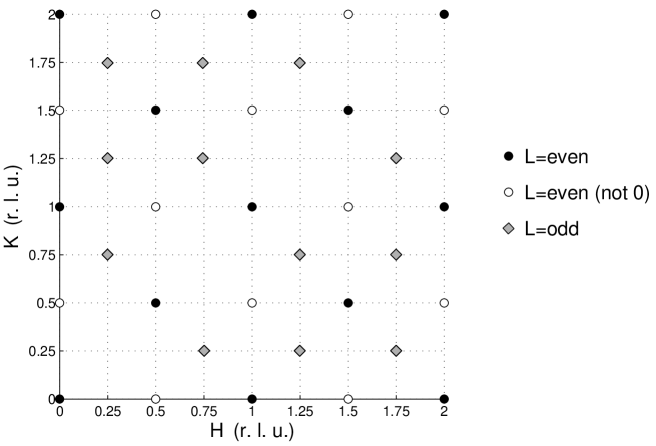
On the basis of this extensive survey, we construct the map of reciprocal space in Fig. 7. A new unit cell can be drawn with dimensions (), where and refer to the lattice constants of the tetragonal NCCO unit cell. We find that this is consistent with the presence of an additional phase of cubic (Nd,Ce)2O3 that is epitaxially oriented along the diagonal direction of the CuO2 plane. Because they bear no special relationship with the surrounding matrix, secondary phases typically form polycrystalline powder inclusions that result in rings of scattering intensity at constant momentum transfer. However, in the present case, the nearly perfect () match between the lattice constant of (Nd,Ce)2O3 ( Å) and ( Å) leads to the formation of a quasi-two-dimensional structure that is well oriented with the copper-oxygen plane, but extends only a few unit cells along [0,0,1]. We note that the cubic lattice constant is smaller than the -axis lattice constant of NCCO.
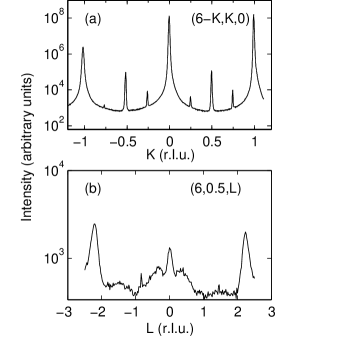
The secondary phase is strained by the surrounding NCCO matrix, which causes the lattice constants to be significantly different between the -direction (10.95(2) Å) and the other two axes (11.14(2) Å). However, the unit cell volume of the strained compound is equal to that of bulk Nd2O3 ( Å):Adachi and Imanaka (1998) . Hence, although the structure of the quasi-two-dimensional epitaxial decomposition phase is related to that of bulk Nd2O3, the symmetry is reduced from cubic (space group ) to orthorhombic. Furthermore, there is evidence that the glide-plane symmetry present in the original space group () is broken. In samples with relatively low volume fractions of the secondary phase, weak additional scattering was easily observed at positions forbidden by the glide-plane symmetry. In those cases, the diffuse scattering is intense enough to result in a small peak at (6,0.5,0) (equivalent to (13,11,0)c), as shown in the lower panel of Fig. 8, a position forbidden by the glide-plane symmetry. We note that this central peak has the same -width as the two peaks at . The large amount of diffuse scattering is also responsible for what appear to be peaks at quarter-integer positions in the upper panel of Fig. 8. This intensity actually results from bisecting a rod of diffuse scattering that connects the quarter-integer peaks located above and below the scattering plane at . The relative amount of diffuse scattering present in the two samples can be gauged by comparing Figs. 5a and 8a, and by comparing Fig. 6b with Fig. 8b.
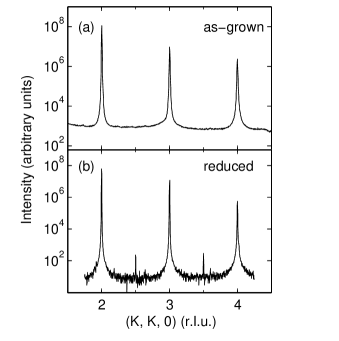
In Fig. 9, we compare a scan along for an undoped sample () in its as-grown state, where no scattering is visible at the half-integer positions, with data taken after reduction, which reveal new peaks at the half-integer positions. This sample was reduced at a lower temperature (890∘C compared to 960-970∘C for the Ce-doped samples), because undoped samples completely decompose after being reduced at 960∘C. Note that the peaks here are approximately two orders of magnitude smaller than in the previous cases, resulting in a (Nd,Ce)2O3 volume fraction estimate of only 0.02%.
VII Transmission Electron Microscopy
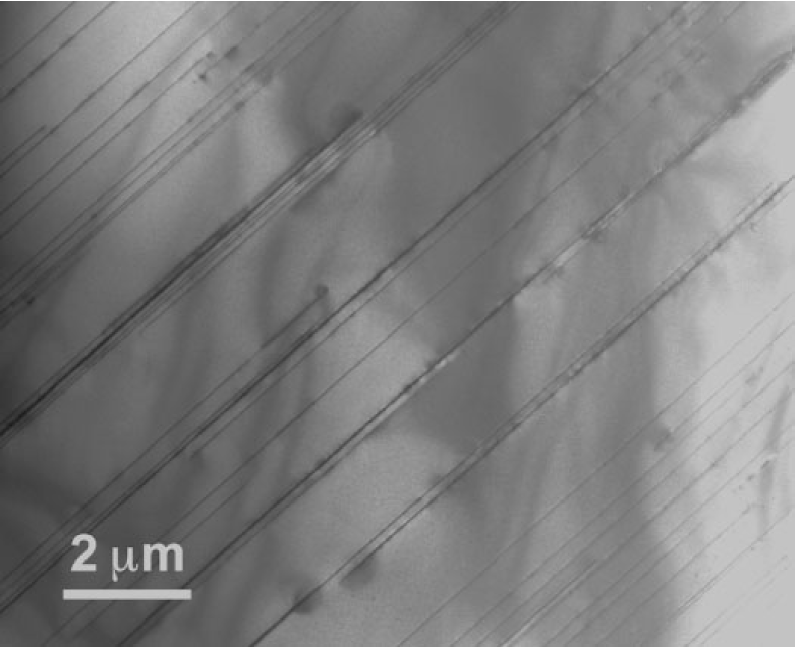
To confirm our diffraction results with real-space information, we used transmission electron microscopy (TEM) to characterize the microstructure of a reduced crystal. A small section of the crystal was prepared with a [1,0,0] surface, and the - plane was imaged. Figure 10 shows an image that reveals thin straight layers of the secondary phase perpendicular to [0,0,1] of NCCO. The secondary-phase regions have a spatial extent well above 1 parallel to the CuO2 planes of NCCO, i.e., perpendicular to [0,0,1].
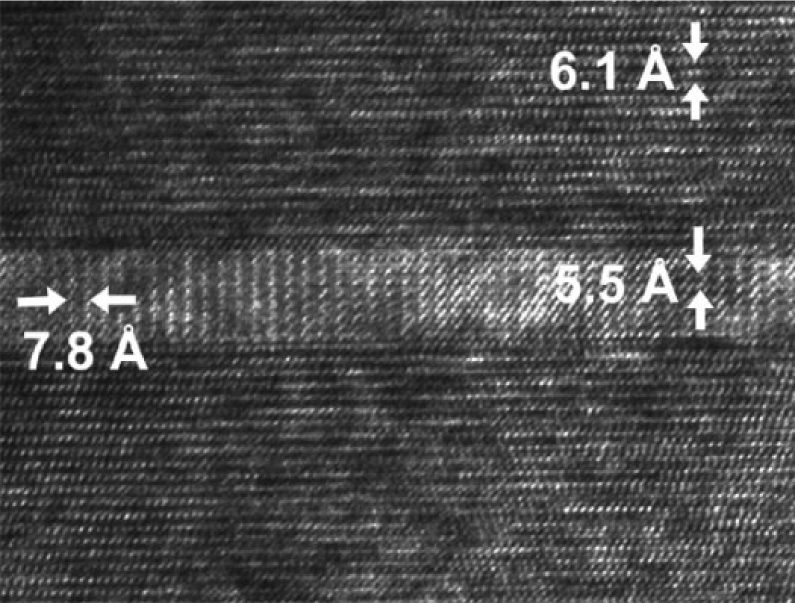
In Fig. 11, we show a high-resolution image of a secondary-phase layer of typical width. (Nd,Ce)2O3 has an epitaxial relationship with the tetragonal NCCO matrix of and . The width of the (Nd,Ce)2O3 layers is minimized in the direction of greatest mismatch, i.e., along the -axis of the NCCO. While there are some rare regions as thick as 150 Å and some regions thinner than 40 Å, by averaging over 40 (Nd,Ce)2O3 layers identified on a series of photographs which spanned different regions of the sample, we estimate that the typical thickness is in the range 40-80 Å. This is in very good agreement with our diffraction results listed in Table I. Again using information from several images such as that of Fig. 10, we arrive at a crude estimate of a secondary phase volume fraction of . We conclude that our complementary real-space TEM results are entirely consistent with the momentum-space information presented in the previous Section.
VIII Magnetic Field Effects
Having established the presence of (Nd,Ce)2O3 as a result of the decomposition of the NCCO matrix during reduction, we now investigate how this secondary phase responds to the application of a magnetic field. This is important because peaks from the secondary phase are found at positions associated with the antiferromagnetic zone center of NCCO. Therefore, it is essential to know how (Nd,Ce)2O3 responds in order to avoid confusion between intrinsic and extrinsic effects when investigating the connection between magnetism and superconductivity.
For this purpose, we placed a reduced, superconducting sample of NCCO (, K) in the horizontal-field magnet M2 at Chalk River Laboratories. The sample was 1.6 cm long, 3.6 mm in diameter, and weighed 1.28 g. Because of a large easy-plane anisotropy for magnetic neodymium atoms in NCCO, the application of a magnetic field along [0,0,1] exerts a torque on the sample that attempts to twist it until the copper-oxygen planes are oriented parallel to the field direction. To counteract this, opposite faces of the sample perpendicular to the -axis were ground flat and placed into a press-shaped sample mount. The sample was held fast in the mount by tightening the mount with screws against the flat sections of the sample.
At zero field, strong peaks from the secondary phase are visible. By comparing the integrated intensities of the (4,0,4)c reflection of cubic (Nd,Ce)2O3 (the (1,1,4.4) reflection in the NCCO reciprocal lattice) to the (0,0,2) and (0,0,4) reflections of NCCO, we estimate the volume fraction of the secondary phase to be approximately 0.5% in this sample.
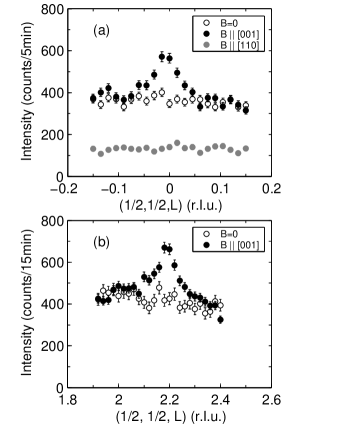
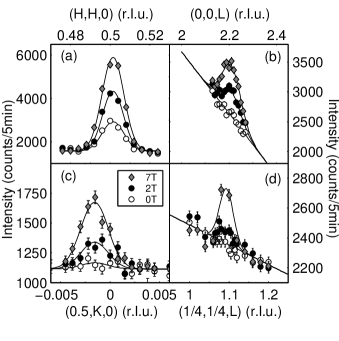
In Fig. 12a, we present -scans through (1/2,1/2,0), also indexable as (2,0,0)c. This position is associated with the antiferromagnetic wavevector of the CuO2 plane. Weak reflections are not always easily visible in neutron measurements due to the relatively low flux of neutron sources when compared to X-ray synchrotrons as well as the relatively high background scattering and coarse momentum resolution in neutron scattering experiments. In the present case, no peak can be discerned above background at zero field, as expected, given the relatively small sample size and secondary phase volume fraction when compared to our sample for which we do observe a weak structural peak (Fig. 13a). With the application of a magnetic field of 2.6 T directed along [0,0,1], perpendicular to the copper oxide planes, a peak is readily visible. In Fig. 12b, we present a similar set of scans through the position (1/2,1/2,2.2), or (2,0,2)c. As in the case of the (2,0,0)c reflection, no peak is visible at zero field, but upon application of a 2.6 T magnetic field directed along [0,0,1], a peak clearly emerges at .
From the extensive X-ray survey of Sec. VI, we know that these two positions are associated with structural peaks of a secondary decomposition phase of (Nd,Ce)2O3. The application of a magnetic field polarizes the Nd moments of the secondary phase, which results in a ferromagnetic component that enhances the scattering at nuclear positions of the secondary phase, and renders the (2,0,0)c and (2,0,2)c peaks visible. This point is well demonstrated by Fig. 12b, as the position (1/2,1/2,2.2) is manifestly unrelated to the NCCO structure. We test the proposition that the field-induced magnetism is ferromagnetic in nature by studying the effect of a 2.6 T field along [1,1,0] for scattering at the (1/2,1/2,0) position. As can be seen from Fig. 12a, we find that a peak is no longer visible. This is due the geometric factor in the magnetic neutron scattering cross-section for unpolarized neutrons,Shirane et al. (2002)
| (1) |
which implies that the observed intensity is proportional to the square of the component of the moment perpendicular to Q. Here, is the number of unit cells, is the volume of one unit cell, is the Landé factor, is the gyromagnetic ratio, is the classical electron radius, and are the atomic positions in the unit cell. Because the Nd moments are field-induced, their direction tends to follow the direction of the applied field. Neglecting possible small anisotropy effects, when the magnetic field is oriented along [0,0,1], the moment is perpendicular to the scattering wavevector and the maximum contribution is obtained. However, when the field is directed along [1,1,0], the moments are parallel to the field, and hence parallel to . In this geometry, the magnetic contribution to the scattering is zero and no peak can be distinguished. The increased background level in some scan geometries occurs for a narrow region of the magnet where the electrical wiring and cryogenic tubing is located, which leads to higher incoherent scattering than neighboring parts of the magnet when illuminated by the incident neutron beam.
Since the origin of the field-induced scattering is the secondary decomposition phase that forms as a result of the oxygen-reduction procedure, it is naturally not observable in as-grown samples. Of course, this does not imply that the observed field effect is related to superconductivity in the NCCO matrix (which occurs for ), but only that reduction is a necessary condition to form the secondary phase as well as to induce superconductivity. To demonstrate this, Fig. 13 shows magnetic scattering in an oxygen-reduced, non-superconducting NCCO crystal (). The data were taken at the NIST Center for Neutron Research. The sample measured 4 mm in diameter, 2.1 cm in length, and weighed 3.5 g. The sample volume, the volume fraction of the secondary phase (), and the neutron flux are larger than in the case of the sample. As a result, a structural peak is visible at (1/2,1/2,0) (i.e., (2,0,0)c) in zero field. We also demonstrate enhanced scattering in a magnetic field at the equivalent position (0,0,2.2) (i.e., (0,0,2)c). We conclude that an enhancement of scattering in a magnetic field is observable in reduced NCCO, irrespective of whether the sample is superconducting or not. Furthermore, the effect is observable at any position corresponding to a Bragg-like reflection of the secondary (Nd,Ce)2O3 phase, subject, of course, to the modulation of the structure factor and the geometric factor for that particular reflection.
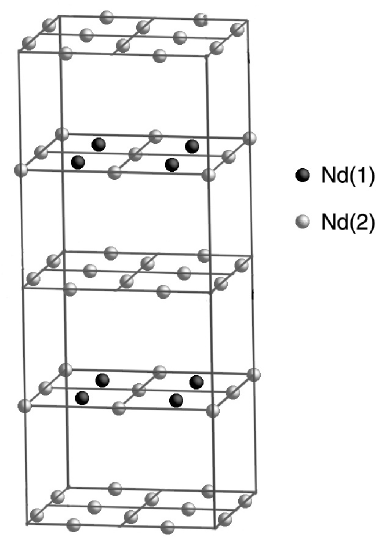
An important point is that although the unit cell of the secondary phase is cubic, it is not simple cubic. As discussed in Sec. V, cubic RE2O3 has two crystallographically distinct rare-earth sites. In principle, each site may have a distinct magnetic moment. As the separate contributions to the structure factor from each site add destructively for some reflections, the observed intensity for a given reflection is a function of the relative strength of the magnetic moments on the two sites. For cubic Nd2O3, the magnetic structure factor of the (2,0,0)c reflection is proportional to
| (2) |
where the two contributions come from the two inequivalent neodymium sites with potentially inequivalent moments. Because of the negative phase between the two contributions, in the case of identical moments there is a 92% cancelation between the contributions from the two sites. Since the atoms with C2 symmetry are slightly displaced from the cell edge, the cancelation is incomplete. This also holds for nuclear scattering, in which case is replaced by the scattering length . For the (2,0,2)c reflection the structure factor is proportional to
| (3) |
Assuming cubic symmetry, the non-zero intensity apparent in Fig. 12b then implies that the magnetic moments on the two Nd sites are, in fact, different for this particular field and temperature. Furthermore, the existence of inequivalent moments implies that the evolution of the magnetic moment with field is also slightly different between the two sites. As a result, non-trivial field dependence of the scattering intensity may be observed.
In Fig. 14, we show the field dependence of the scattering at (1/2,1/2,0) for the NCCO () sample at three different temperatures. The lowest and highest temperature data were taken using the two-axis diffractometer E4 at the Hahn-Meitner-Institut and the 4.2 K data were taken using the BT2 spectrometer at the NIST Center for Neutron Research. Temperature scans taken at constant field (data not shown) were used to cross-normalize the data sets taken at the two facilities. Both experiments employed a vertical-field magnet with field directed along [0,0,1], but the magnetic field range of the 4.2 K data set is limited by the 7 T maximum field of the NIST magnet. We model the behavior illustrated in Fig. 14 by assuming that the moment on each Nd site evolves according to its own Brillouin functionKittel (1996)
| (4) | |||||
and then combine the associated scattering intensity according to the aforementioned structure factor in Eq. 2. The effect of the crystal field on the total angular momentum is unknown for (Nd,Ce)2O3, and we have fitted at each temperature for both Nd sites. Once we fix the non-magnetic scattering to 2000 counts/20 min., the fit involves an overall (temperature-independent) scale factor and two additional parameters per temperature: and . From the lowest to highest temperature we find =2.1(2), 2.4(1), 2.6(2), and =1.110(4), 1.093(4), 1.085(4). The Landé factor was fixed at the free ion value of 8/11 for Nd. Clearly, the two-moment model provides an excellent description of our data. In the inset of Fig. 14, we plot the field evolution of the ratio as extracted from the field dependence at the lowest temperature. Our model indicates that the saturated moments of the two sites differ by 11%. This is consistent with the 13% difference found for Er2O3 and the 77% difference found for Yb2O3.Moon et al. (1968) From the fits, we estimate the low-temperature moment of the Nd(1) atoms as . This is a reasonable value, comparable to the experimentally observed value of 1.65 of cubic NdNi2.Skrabek and Wallace (1963) The two-moment model accounts not only for the complete field and temperature dependence of the scattering intensity, but also explains how what is essentially ferromagnetic scattering can seemingly decrease with increasing magnetic field.
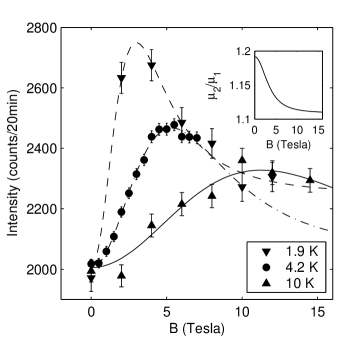
The results presented in Fig. 14 indicate that (Nd,Ce)2O3 is paramagnetic even at 1.9 K. This is consistent with the fact that Er2O3 ( K) and Yb2O3 ( K) have relatively low Néel temperatures, and that the (Nd,Ce)2O3 secondary phase has a lower effective dimensionality. In a separate measurement we did not observe spontaneous Nd ordering (of (Nd,Ce)2O3 or NCCO) in our sample down to 1.4 K.
We note that a field-dependent peak was also observed at (1/2,0,0) (equivalent to (1,1,0)c) and at (1/4,1/4,1.1) (equivalent to (1,0,1)c) in Fig. 13. As discussed in Sec. VI, reflections at these positions are forbidden by the glide-plane symmetry and our observation of such peaks is further evidence of the lowered symmetry of the strained environment inside the NCCO matrix. Since Eq. (2) for the structure factor at (1/2,1/2,0) represents a near cancelation of contributions, a small symmetry breaking can result in scattering intensities at (1/2,0,0) that are comparable to those observed at (1/2,1/2,0).
The field-effect results presented above establish that a magnetic contribution from (Nd,Ce)2O3 is present at (1/2,1/2,0), the two-dimensional antiferromagnetic zone center of NCCO, and at equivalent positions, but it leaves open the possibility that a small fraction of the signal may be intrinsic to the copper-oxygen sheets. One way to separate the two possible contributions is to perform scans at reciprocal space positions with non-zero, integer , with a magnetic field along [0,0,1], such that the scattering from NCCO and from (Nd,Ce)2O3 is clearly separated. Experimentally, this requires that the sample be aligned in the scattering zone and that a horizontal-field magnet be employed. Only a few such magnets compatible with use at a neutron diffractometer exist, and their maximum field is less than that of vertical-field magnets.
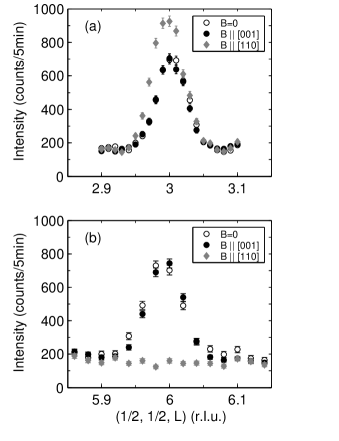
Figure 15 shows the result of such a measurement for a reduced sample, performed at Chalk River Laboratories at two antiferromagnetic Bragg peak positions corresponding to with both even and odd integer values of . As-grown NCCO exhibits long-range magnetic order of the copper moments even at high cerium concentrations, with Néel temperature K for . man Along , magnetic Bragg scattering is observed at non-zero integer values of . The zero-field magnetic intensity at these positions in reduced, superconducting samples is relatively weak when compared to as-grown NCCO, Matsuda et al. (1992); Uefuji et al. (2002); man and the antiferromagnetic volume fraction decreases rapidly with increasing in the superconducting phase.Uefuji et al. (2001) Moreover, it has been found that the antiferromagnetic regions have a finite extent of 50-100 Å in superconducting samples with .Uefuji et al. (2002) In our case (), the scattering indeed is very weak, and only appears below K. From Fig. 15, we see that the application of a magnetic field along [0,0,1] has no effect on the scattering intensity. However, a field parallel to the copper-oxygen planes enhances the odd- peak intensity and completely suppresses the even- peak. Presumably this is the result of a non-collinear to collinear spin transformation similar to what has previously been reported,Skanthakumar et al. (1993) but in the present case the orientation of the central spin (at the body-center position; see Fig. 1) is rotated by resulting in the elimination of even-, rather than odd-, peaks.
IX Discussion
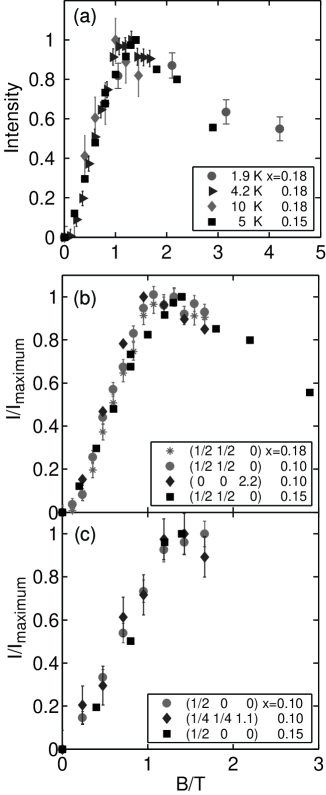
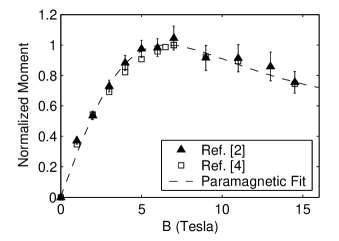
Kang and co-workers reported magnetic-field-induced scattering at (1/2,1/2,0), (1/2,0,0) and related reflections, and interpreted their data as indicative of a field-induced quantum phase transition from a superconducting to an antiferromagnetic state. Kang et al. (2003a) In a previously published version of Fig. 16, Mang et al. (2003) we demonstrated that a number of data sets taken at different temperatures, magnetic fields, reciprocal space positions, and on different samples (both superconducting and non-superconducting) could be scaled onto an approximately universal curve of scattering intensity versus B/T. We argued that these observations were inconsistent with a quantum phase transition from a superconducting to an antiferromagnetic state, and instead suggested that the data could be explained by a two-moment paramagnetic model for (Nd,Ce)2O3, introduced in detail in Sec. VIII. Kang and co-workers now acknowledge the presence of (Nd,Ce)2O3 in their reduced samples and that this secondary phase does exhibit a field-induced paramagnetic response which leads to an enhancement of the scattering intensity at the reciprocal space positions they measured.Kang et al. (2003b); Matsuura et al. (2003)
However, the authors of Refs. Matsuura et al., 2003 and Kang et al., 2003b insist that they have evidence for a NCCO contribution that can be effectively extracted by, for example, subtracting the intensity at (1/2,1/2,0) ((2,0,0)c) measured with [1,-1,0] ([0,1,0]c) from that measured with [0,0,1] ([0,0,1]c). In both geometries the scattering wavevector Q is perpendicular to B and, under the assumption of cubic symmetry and three-dimensional long-range order, the contribution from (Nd,Ce)2O3 should be the same. This procedure was attempted in Ref. NCC, a. In Fig. 17, we reproduce the difference data reported in that reference. We note that what is shown is the (normalized) moment, which is proportional to the square root of the magnetic neutron scattering intensity. NCC (a) In addition, we reproduce the original, uncorrected data of Kang et al.Kang et al. (2003a) taken with a magnetic field along [0,0,1]. We note that the subtraction procedure does not significantly alter the field dependence of the data. We also show a fit of the uncorrected data to the two-moment paramagnetic model of Sec. VIII, with fit parameters J1=2.6(4) and JJ1=1.11(1), which describe the data just as well as the theoretical treatment of Ref. NCC, a. We emphasize that our fit of the normalized data contains only two fit parameters. Given that a quantum phase transition in NCCO and paramagnetism of (Nd,Ce)2O3 are fundamentally different physical phenomena, we consider it incredible that the two should have the same magnetic field dependence, and hence conclude that the subtraction procedure is an unreliable means of correcting the data. This may be in part due to a thin-film-like magnetic anisotropy present in the secondary phase, or to experimental difficulties in accurately normalizing the signal between the two geometries.
Kang et al.Kang et al. (2003a, b) and Matsuura et al.Matsuura et al. (2003) argue that the inclusions of (Nd,Ce)2O3 in their samples are a bulk phase, and hence physically distinct from the epitaxial, quasi-two-dimensional nature we report here. Matsuura et al. conclude that (Nd,Ce)2O3 has sharp Bragg peaks indicative of three-dimensional long-range order on the basis of survey scans along and which consist of no more than one datum in each peak (Fig. 7 of Ref. Matsuura et al., 2003). However, close examination of the (1/2,1/2,3) NCCO peak and the (1/2,1/2,4.4) ((2,0,4)c) (Nd,Ce)2O3 peak (shown in Figs. 8b and 8c of Ref. Matsuura et al., 2003) reveals that, whereas the NCCO peak does seem to be resolution limited with a HWHM of r.l.u., the (Nd,Ce)2O3 peak is times wider, with a HWHM of r.l.u. From parameters published in Ref. 3, we estimate the momentum resolution at (1/2,1/2,4.4) to be only about 20% broader than that at (1/2,1/2,3). Consequently, the large width corresponds to a finite out-of-plane correlation length of approximately 50 Å, or about . This is consistent with our own data, and with the broad structural peaks reported by Kurahashi et al.,Kurahashi et al. (2002) but incompatible with claims of three-dimensional long-range order. It is furthermore consistent with the statement in the caption to Fig. 4 of Ref. Kang et al., 2003a, where the additional reflections are characterized as very broad. We note that the aluminium powder peak visible in Fig. 7 of Ref. Matsuura et al., 2003 is a poor indicator of the experimental resolution because the scan is not purely radial, and hence contains a broadening component from the aluminium powder ring. From the available data we conclude that the nature of the (Nd,Ce)2O3 inclusions present in the samples studied in Refs. Kang et al., 2003a; Matsuura et al., 2003; Kang et al., 2003b are entirely consistent with what we report here, i.e., an epitaxial structure, with an average thickness of 50-100 Å. Finally, we note that Kang et al. also report magnetic-field induced scattering at (1/2,0,0), which indicates that the glide-plane symmetry in their sample has also been broken and, hence, as explained in Sec. VI, the structural symmetery is lower than cubic.
The only observation of Refs. 2 and 3 that differs from our own results is the field dependence of the (1/2,1/2,3) peak. As noted at the end of Sec. IX, the volume fraction of the NCCO antiferromagnetic phase strongly decreases with increasing cerium concentration in reduced samples. We note that the superconducting and antiferromagnetic volume fractions have been found to be highly anticorrelated. Uefuji et al. (2001) Given the sample inhomogeneity issues discussed in Sec. IV, it appears likely that this (zero-field) magnetic response is a non-superconducting remnant of the as-grown state, with modified oxygen concentration and disorder. The response to a magnetic field of this remnant phase is a priori unclear, since the phase is altered by the oxygen treatment from the as-grown state. Our 5 K data taken in the horizontal-field geometry and presented in Fig. 15 do not indicate any change in the scattering at the (1/2,1/2,3) and (1/2,1/2,6) reflections of NCCO for magnetic fields up to 2.6 T oriented along [0,0,1]. Given that a field of 2.6 T constitutes a significant fraction () of the upper critical field in this geometry, Kang et al. (2003a) the absence of a field effect suggests that the scattering at the reflections of the NCCO antiferromagnetic minority phase is unrelated to the suppression of superconductivity in the NCCO majority phase.
In Refs. Kang et al., 2003a and Matsuura et al., 2003 a small enhancement of the (1/2,1/2,3) intensity was reported in fields up to 4 T along [0,0,1], also at 5 K, for a sample. The cerium concentrations of the two samples are somewhat different ( versus ) and the effect of a magnetic field on the antiferromagnetic NCCO minority phase may have a subtle doping dependence. Alternatively, since the Nd moment increases quite dramatically in a fashion, and because it contributes to the NCCO structure factor,Matsuda et al. (1992) small temperature differences between two scans could, in principle, appear as a change in intensity. A third possible origin for the observed field effect reported in Refs. Kang et al., 2003a and Matsuura et al., 2003 could be due to the torque exerted on the sample for field configurations . If the mount used in the experiment is not sufficiently rigid the sample may rotate, resulting in a difference in intensity between two scans. This is especially serious considering our result reported in Fig. 15 in which a field directed along the [1,1,0] direction increases the amount of scattering at the (1/2,1/2,3) reflection. Small changes in the alignment of the sample can either increase or decrease the observed scattering. Finally, we note that the (1/2,1/2,3) data in Fig 9d of Ref. Matsuura et al., 2003 have relatively large error bars and are not entirely inconsistent with the absence of a field dependence.
An earlier study of Nd2-xCexCuO4±δ () in [0,0,1] fields up to 10 T failed to detect any enhancement of the scattering intensity at the (1/2,3/2,0) reflection.Matsuda et al. (2002) The lowest temperature at which data were taken in that experiment was a relatively high 15 K. Because of the strong enhancement of the Nd moment at low temperatures, this would have made detection of the effect from the (Nd,Ce)2O3 phase more difficult. Also, measurements were only conducted at the (1/2,3/2,0) position. This is an allowed NCCO magnetic reflection, unlike (1/2,1/2,0), which is disallowed by the spin structure. Consequently, the additional contribution from (Nd,Ce)2O3 would also have been difficult to detect due to the prominence of the large signal from the NCCO antiferromagnetic phase regions of the sample, since the volume fraction of the NCCO antiferromagnetic phase is still relatively large for .Uefuji et al. (2001) A subsequent experiment, conducted on the related electron-doped compound Pr1-xLaCexCuO4 (PLCCO, , K), failed to detect any magnetic field effects at the (3/2,1/2,0) reflection in fields of up to 8.5 T along [0,0,1].NCC (b) This is consistent with our observations. PLCCO has the advantage that La is a non-magnetic ion, and the Pr moment is an order of magnitude weaker than that of Nd at low temperatures. Therefore, any complicating magnetic effects from a (Pr,La,Ce)2O3 secondary phase should be considerably weaker. The failure to observe a magnetic field effect deep inside the superconducting dome at is consistent with our statements that such effects in NCCO can be entirely accounted for by the (Nd,Ce)2O3 secondary phase. We note that some effects qualitatively different from those in NCCO were reported for an sample that lies on the boundary of the antiferromagnetic and superconducting regions of the Pr1-xLaCexCuO4 phase diagram.NCC (b) It appears that those are attributable to a disturbance of the antiferromagnetic Pr1-xLaCexCuO4 minority phase and unconnected with superconductivity.
X Summary
In summary, we have observed that when Nd2-xCexCuO4±δ is exposed to a reducing environment a small fraction of the crystal decomposes. One of the decomposition products is (Nd,Ce)2O3, which exists epitaxially in a strained cubic bixbyite structure. The structure is long-range correlated parallel to the copper-oxygen planes, but only short-range ordered perpendicular to the planes. Application of a magnetic field polarizes the Nd atoms, leading to an enhancement of the magnetic neutron scattering intensity at positions coincident with (Nd,Ce)2O3 structural peaks. A simple two-moment model for the (Nd,Ce)2O3 paramagnetism gives an excellent description of our data. The extensive data presented here are inconsistent with the notion Kang et al. (2003a, b); Matsuura et al. (2003); NCC (a) of a field-induced quantum phase transition from a superconducting to an antiferromagnetic state of Nd2-xCexCuO4±δ. We note that the presence of the secondary phase should also be taken into account in the analysis of other experiments on Nd2-xCexCuO4±δ, such as transport measurements.
Acknowledgements.
We would like to thank N. Kaneko for his efforts in constructing the reduction furnace and maintaining the crystal growth facility at Stanford University, and A. Arvanitaki for assistance in orienting the TEM sample. We are also grateful to J.M Tranquada, H. Eisaki, and N.P. Armitage for valuable discussions. We would like to thank J.W. Lynn for technical assistance with the neutron scattering measurements at NIST. Finally, we wish to acknowledge P. Dai, H.J. Kang, J.W. Lynn, M. Matsuura, and S.C. Zhang for discussing their data with us. SSRL is supported by the DOE Office of Basic Energy Sciences, Division of Chemical Sciences and Material Sciences. The work at Stanford was furthermore supported by the US Department of Energy under Contracts No. DE-FG03-99ER45773 and No. DE-AC03-76SF00515, and by NSF CAREER Award No. DMR9985067.References
- Tokura et al. (1989) Y. Tokura, H. Takagi, and S. Uchida, Nature 337, 345 (1989).
- Kang et al. (2003a) H. J. Kang, P. Dai, J. W. Lynn, M. Matsuura, J. R. Thompson, S. C. Zhang, D. N. Argyriou, Y. Onose, and Y. Tokura, Nature 423, 522 (2003a).
- Matsuura et al. (2003) M. Matsuura, P. Dai, H. J. Kang, J. W. Lynn, D. N. Argyriou, K. Prokes, Y. Onose, and Y. Tokura, Phys. Rev. B 68, 144503 (2003).
- NCC (a) H. D. Chen, C. Wu and S. C. Zhang, cond-mat/0310289.
- Mang et al. (2003) P. K. Mang, S. Larochelle, and M. Greven, Nature 426, 139 (2003).
- Radaelli et al. (1994) P. G. Radaelli, J. D. Jorgensen, A. J. Schultz, J. L. Peng, and R. L. Greene, Phys. Rev. B 49, 15322 (1994).
- Manthiram and Goodenough (1990) A. Manthiram and J. B. Goodenough, J. Solid State Chem. 87, 402 (1990).
- McAllister et al. (2000) J. A. McAllister, S. Davies, and J. P. Attfield, J. Solid State Chem. 155, 138 (2000).
- Bringley et al. (1990) J. F. Bringley, S. S. Trail, and B. A. Scott, J. Solid State Chem. 86, 310 (1990).
- Sorensen (1981) O. T. Sorensen, ed., Nonstoichiometric Oxides (Academic Press, 1981).
- Schultz et al. (1996) A. J. Schultz, J. D. Jorgensen, J. L. Peng, and R. L. Greene, Phys. Rev. B 53, 5157 (1996).
- Tarascon et al. (1989) J. M. Tarascon et al., Physica C 162, 285 (1989).
- Nath et al. (1994) A. Nath, N. S. Kopeleve, V. Chechersky, J. L. Peng, R. L. Greene, B. hoan O., M. I. Larkin, and J. T. Markert, Science 265, 73 (1994).
- (14) P. K. Mang, O. P. Vajk, A. Arvanitaki, J. W. Lynn, and M. Greven, cond-mat/0307093.
- Moon et al. (1968) R. M. Moon, W. C. Koehler, H. R. Child, and L. J. Raubenheimer, Phys. Rev. 176, 722 (1968).
- (16) In previous publications we reported the furnace control temperature instead of the sample temperature.
- Kim and Gaskell (1993) J. S. Kim and D. R. Gaskell, Physica C 209, 381 (1993).
- (18) In our original publication Mang et al. (2003) we gave an estimate of 0.01-0.1% for the typical secondary phase volume fraction. Table I contains refined estimates, ranging two orders in magnitude, from % to %, depending on the reduction conditions.
- Kurahashi et al. (2002) K. Kurahashi, H. Matsushita, M. Fujita, and K. Yamada, J. Phys. Soc. Jpn. 71, 910 (2002).
- Brinkmann et al. (1995) M. Brinkmann, T. Rex, H. Bach, and K. Westerholt, Phys. Rev. Lett. 74, 4927 (1995).
- Adachi and Imanaka (1998) G. Adachi and N. Imanaka, Chem. Rev. 98, 1479 (1998).
- Wyckoff (1963) R. W. G. Wyckoff, Crystal Structures, vol. 1 (Interscience Publishers, 1963), 2nd ed., chapter V.
- Hahn (2002) T. Hahn, ed., International Tables for Crystallography, vol. A (Kluwer Academic, 2002).
- Izumi et al. (1989) F. Izumi, Y. Matsui, H. Takagi, S. Uchida, Y. Tokura, and H. Asano, Physica C 158, 433 (1989).
- Gibaud et al. (1993) A. Gibaud, R. A. Cowley, D. F. McMorrow, R. C. C. Ward, and M. R. Wells, Phys. Rev. B 48, 14463 (1993).
- Shirane et al. (2002) G. Shirane, S. Shapiro, and J. Tranquada, Neutron Scattering with a Triple-Axis Spectrometer (Cambridge University Press, 2002).
- Kittel (1996) C. Kittel, Introduction to Solid State Physics (John Wiley & Sons, 1996), 7th ed.
- Skrabek and Wallace (1963) E. A. Skrabek and W. E. Wallace, J. Appl. Phys. 34, 1356 (1963).
- Matsuda et al. (1992) M. Matsuda, Y. Endoh, K. Yamada, H. Kojima, I. Tanaka, R. J. Birgeneau, M. A. Kastner, and G. Shirane, Phys. Rev. B 45, 12548 (1992).
- Uefuji et al. (2002) T. Uefuji, K. Kurahashi, M. Fujita, M. Matsuda, and K. Yamada, Physica C 378-381, 273 (2002).
- Uefuji et al. (2001) T. Uefuji, T. Kubo, K. Yamada, M. Fujita, K. Kurasashi, I. Watanabe, and K. Nagamine, Physica C 357-360, 273 (2001).
- Skanthakumar et al. (1993) S. Skanthakumar, J. W. Lynn, J. L. Peng, and Z. Y. Li, Phys. Rev. B 47, 6173 (1993).
- Kang et al. (2003b) H. J. Kang, P. Dai, J. W. Lynn, M. Matsuura, J. R. Thompson, S. C. Zhang, D. N. Argyriou, Y. Onose, and Y. Tokura, Nature 426, 140 (2003b).
- Matsuda et al. (2002) M. Matsuda, S. Katano, T. Uefuji, M. Fujita, and K. Yamada, Phys. Rev. B 66, 172509 (2002).
- NCC (b) M. Fujita, M. Matsuda, S. Katano and K. Yamada, cond-mat/0311269.