Monte Carlo Simulation of Surface De-alloying of Au/Ni(110)
Abstract
Based on BFS model and using Monte Carlo simulation we confirm
the de-alloying in immiscible Au/Ni(110) system. The critical
Au coverage 0.4(ML) when de-alloying happens is consistent with
experiments. At the same time our simulation show that the
structural phase transition will lead to the saturation of the
number of alloying Au atoms.
PACS: 68.18.Fg, 68.35.Dv, 68.35.Ct, 68.55.Ac
Keywords: De-alloying, BFS model, Monte Carlo
I. Introduction
Surface alloying is an important phenomenon in hetero-growth of surfaces [1-4]. From Scanning Tunnelling Microscopy (STM) observations, gold atoms mix with copper atoms and form the Au-Cu structure in the Au/Cu(110) system [5]; gold atoms mix with the silver atoms at next atomic layer below the surface layer for Au/Ag(110) [6]. Theoretically, the equilibrium structures of surface alloys can be obtained from total-energy calculations [7, 8]. Surface alloying of immiscible systems, such as Au/Ni(110) [9], (Na,K)/Al(111)[10-13], Ag/Pt(111) [14], Sb/Ag(111) [15], is an astonishing phenomenon because it is difficult to mix different kind atoms in bulk for these elements. Thus, we can synthesis some new and novel compounds on surface which are difficult to synthesis in bulk material. A few theoretical models have been presented to explain surface alloys in immiscible systems such as Effective-Medium Theory (EMT) [9], Tersoff Theory [16] and BFS Model [17, 18]. Especially, the BFS model [17, 18, 28] has been successfully used to study the phenomenon of surface alloying in immiscible systems [29-36].
Recent experiments [19] on the Au/Ni(110) system have shown that when Au coverage is above 0.4ML a new phenomenon, ”de-alloying”, takes place. Au atoms, having already alloyed, segregate again and form complex one-dimensional chains perpendicular to the closed-packed direction. A density functional calculation has shown the interesting properties of these one-dimensional chains [20]. In this work we study the alloying and de-alloying of Au/Ni(110). Generally Au atoms are immiscible in Ni crystal. The experimental finding of Au atoms alloying to the Ni(110) surface inspired the interests of immiscible systems. Based on the BFS model, several theoretical calculations and computer simulations have explained the experimental phenomenon of alloying. In this work, using Monte Carlo methods, we find that the BFS model can successfully explain both alloying and de-alloying of Au/Ni(110). The results show that when Au coverage increases above 0.40ML, de-alloying occurs, which is consistent with experimental observations.
II. BFS Model and Monte Carlo Methods
The Construction of the BFS model is based on the concept of Equivalent Crystal Theory (ECT) [21, 22], that is, the formation of defects in a perfect crystal equivalent to the changes of lattice constant of a perfect crystal. If the lattice constant of the equilibrium perfect crystal is , ECT theory requires that there exists an equivalent lattice with lattice constant whose energy is equal to the energy of the deformed lattice ( the crystal after forming defects). The energy of the equivalent lattice can be calculated from the universal energy relation [23-26] in terms of the change of that lattice constant which is obtained from the ECT equation.
The BFS model generalizes the ECT theory to alloy systems, that is, including the chemical effects. The change of the chemical environment is also equivalent to a change of lattice constant and the corresponding energy can be computed following the same steps as the calculation of the energy related to defects in the crystal. Below, we briefly describe the BFS model. More details can be found in Ref. [28].
The formation energy of an arbitrary alloy structure is the superposition of individual contributions, , of the nonequivalent atoms in the alloy,
| (1) |
where is the strain energy, is the chemical energy, and is a coupling function. The strain energy is calculated from
| (2) |
where is an universal scaling function. is the scaled change of lattice constant, is the lattice constant of the equivalent crystal, and is the lattice constant for the perfect lattice. The parameters and describe the structure and properties of system [21]. The coupling function is . The lattice constant of the equivalent crystal, , can be obtained from the ECT equation
| (3) |
where () are the distances of first nearest(next nearest) neighbor of atom , () is the number of nearest(next nearest) neighbors. are the screening parameters defined in Ref [21, 30]. for nearest neighbors and for next nearest neighbors.
Each atom in the alloy has its own equivalent crystal, whose lattice constant is dependent on the environment of the atom. In the calculation of the strain energy, , the structural effects are considered and chemical effects are ignored , that is, all atoms near atom are considered to be of the same kind as atom . Chemical effects are included in the chemical energy of, , in which structural effects are ignored. The calculation of chemical energy is similar to that of the strain energy. The equivalent lattice for atom is obtained from
| (4) | |||||
Compared with Eq.3, the only difference is the appearance of the parameter for atom which depends on the type of neighboring atoms . If atom is identical to atom , , otherwise, which is just the chemical effect. In the BFS model, the chemical energy includes only the chemical environment and ignores the structural facts, thus, are the nearest and next nearest neighbor distances in the equilibrium crystal of species and retain the chemical environment of atom . If we have solved the ECT equation, the chemical energy can be calculated according to . The is the energy without chemical impurities(). The calculation of and are summarized below
| (5) |
| (6) |
| (7) |
We have used Monte Carlo methods to simulate the surface alloying and de-alloying based on the BFS model. In the simulation, we calculate the energy for every configuration when sampling the phase space of the system under study. Rejection or acceptance of a configuration is based on the Metropolis criterion [27]. The key of a Monte Carlo simulation is the calculation of the total energy. For the BFS model, . is dependent on the environment of atom . If we consider a perfect lattice that includes only one kind of atoms, the environment of atom is the nearby configurations of atom which can be described as where () is the number of nearest (next nearest) neighbors of atom . So, . Because we only consider the nearest and next nearest neighbors of an atom, the possible configurations are very limited for a typical crystal (fcc,bcc,hcp and diamond structure, for fcc metal the number is 91). All configurations for every atom are cast into this group of the 91 configurations. If having calculated energies of the 91 configurations before entering the main loop of Monte Carlo, in the main loop we only need to find which one of the 91 configurations corresponds to the current configuration. The total energy can be calculated from the equations given above. So we calculate energies only 91 times in our simulation which is independent on the number of atoms under study. Exactly defining nearby configurations for every atom is the main task in our simulation. For alloy systems, the available nearby configurations are large, but every configuration is only calculated one time. In our simulation, atoms move in a 3D lattice. The atom jump from site to , if the site is empty, the atom occupies the site . If the site has been occupied by another atom with the different kind of atom , the atom exchanges position with atom or the jump is rejected.
III. Results and Discussion
The simulation cell includes 5 atomic layers, and each layer contains 280 atoms. The number of substrate atoms of the cell is 1400. We generally deposited Au atoms with coverage from 0 to 1ML, or from 0 to 280 Au atoms in order to study the alloying and de-alloying of the Au/Ni(110) system. Two atomic layers at the bottom are fixed and periodical boundary conditions are applied to the directions parallel to the surface. In our simulation, the direct exchanging of different kinds of atoms is allowed if an atom moves to a site already occupied by a different kind of atom. The sweep number of the Monte Carlo simulation is 50000 or 100000.
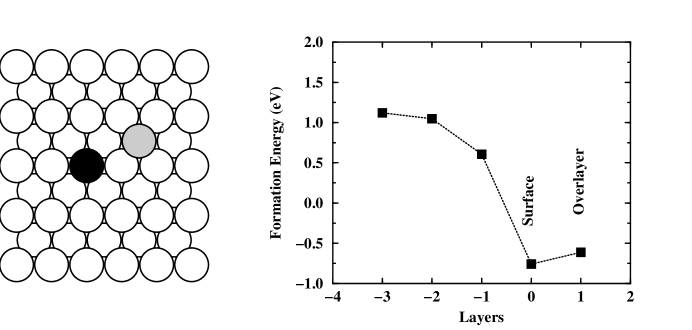
Fig. 1 shows the formation energy when a Au atom substitutes for a Ni atom in different layers. The left panel shows the Au atom substituting for a Ni atom in the surface layer. From this figure we find that the lowest formation energy corresponds to an Au atom substituting for a Ni atom in the surface layer. Our results also indicate that Au atoms do not alloy into the Ni crystal, proof of immiscibility of the Au/Ni system. A similar result, that is, surface alloying of immiscible systems, has been reported by other authors [18].
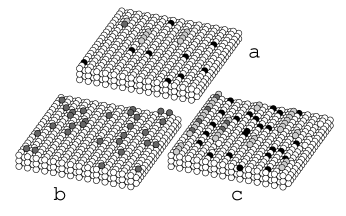
Fig. 2 shows the surface structure at low Au coverage at room temperature T=300K. Fig. 2(a) shows the relaxed surface structure at 0.036 ML Au coverage. We find from this figure that all Au atoms are alloying into the surface layer except an Au atom that is still on the surface. The Ni atoms on the surface, which are substituted by alloying Au atoms, form two Ni chains of 4 Ni atoms. The remaining Au atom on the surface forms a dimer with a Ni atom. By increasing Au coverage to 0.1ML, the length of Ni chains also increases with increasing number of alloying Au atoms. Alloying atomic chains also appear, and their lengths also increase. Some Au atoms, which have no chance allying into surface layer, form the alloying chains with Ni atoms. The chance of forming alloying chains is larger than that at lower coverage (Fig. 2(a)). Our results are in close agreement with experimental observations. An important difference compared with experiment is the smaller numbers of Ni dimers alloying into the surface layer, contrary to experiment where most Ni atoms are paired.

In the experiment at higher Au coverage, the de-alloying phenomenon is found with increasing Au coverage up to 0.40ML [19]. The number of alloying Au atoms does not increase, on the contrary, it decreases with increasing Au coverage. On the surface, one-dimensional Au chains with complicated structure perpendicular to the closed packed direction are found. We now study the change of surface structure thoroughly from low coverage to high coverage. The Monte Carlo simulation sweeps 100000 steps for each coverage at T=300K. The results are shown in Fig. 3. From this figure we find that the number of Au atoms alloying into the surface layer decreases if the Au coverage increases continuously above 0.4ML. Our results are consistent with the experimental observation. The critical coverage for de-alloying is exactly 0.40, the experimental value. From Fig. 3 we also find that the number of Ni atoms on the surface is larger than the number of alloying Au atoms when Au coverage is lower than the critical value, which indicates that there are vacancies on the surface at low Au coverage. If Ni atoms jump from the prefect surface layer onto the surface, vacancies (unoccupied sites ) will be left in the surface layer; If Au atoms alloy into the surface layer and occupy unoccupied sites, the number of vacancies in the surface layer will decrease to . If , all sites in the surface layer are occupied and no vacancies are in the surface layer. When the de-alloying happens, some Au atoms return to the surface and at the same time some Ni atoms return to the surface layer. From the figure, we also find the number of Ni atoms on the surface is equal to the number of Au atoms alloying into surface layer. This means that a Au atom only substitutes for a Ni atom and all the sites of surface layer are occupied without vacancies.
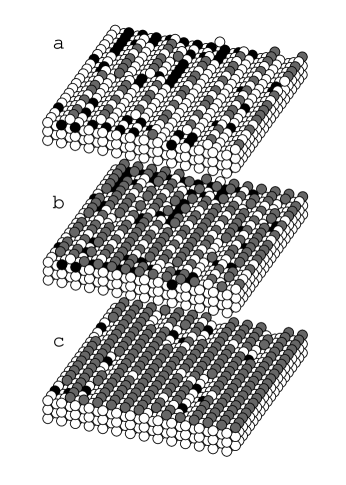
Fig. 4(a) shows the equilibrium structure at 0.4ML Au coverage after a Monte Carlo relaxation of 100000 steps, and Fig. 4(b) shows the surface structure after randomly depositing another 0.40ML Au on the already relaxed surface (Fig. 4(a)). Now we use the configuration Fig. 4(b) (with coverage 0.8ML) as the new initial structure and relax another 100000 Monte Carlo steps. The structure in Fig. 4(b) is unstable and relaxes to another equilibrium structure. We find, in the final surface structure, most of Au atoms return to surface. Only a small part of Au atoms is inserted in the alloying surface layer. Fig. 5 shows the change in the number of Au atoms alloying into the surface layer with Monte Carlo steps. We find the number decreases rapidly and approaches the equilibrium value within only 100 Monte Carlo steps.

The motion of atoms is generally faster at higher temperatures, an atom has more chance to exchange with other atoms. Thus we expect that the degree of alloying will increase with temperature. We study the temperature effects of surface alloying using a larger cell which includes 5 atomic layers and contains 1120 Ni atoms in each atomic layer. We also deposit randomly 450 Au atoms on the surface. The total number of atoms in the cell is 6050. Fig. 6 shows the change of the number of Au atoms alloying into the surface layer and the change of the number of Ni atoms on surface. We find the number of alloying Au atoms increase with increasing temperature until it saturates above T=800K.

From Fig. 6 we find that the number of Ni atoms on the surface increases linearly with increasing number of alloying Au atoms as long as the temperature is below 800K. When the temperature increases above 800K, the number of Ni atoms on the surface also increases linearly at the same time that the number of alloying Au atoms approaches saturation. The figure shows that the number of Ni atoms on the surface is generally larger than the number of alloying Au atoms. The difference becomes larger as the temperature increases above 800K. This is indicative of a change of surface structure. The number of vacancies increases when the temperature rises above 800K. The decrease of proportion of substrate Ni atoms of the surface layer leads to the decrease of the chance of exchanging with Au atoms on surface, which prevents the increase of the number of alloying Au atoms. The structural change of the surface is the direct reason of the saturation of the number of alloying Au atoms when the temperature increases above 800K. The argument is confirmed by a following simulation of a pure Ni(110) surface. With increasing temperature, some Ni atoms will jump onto the surface because of the thermal motion of atoms. When the temperature is above a critical temperature the surface will undergo a structural change or structural phase transition. The change in the number of Ni atoms on the surface is also shown in Fig. 6. We find that when the temperature increases to about 900K, the number of Ni atoms on the surface increases abruptly from about 190 to 350. The jump in the number of Ni atoms on the surface indicates the structural change of the surface. The transition temperature, 900K, is close to the temperature when the number of alloying Au atoms approaches saturation.
IV. Conclusion
In conclusion, Monte Carlo simulations confirm the de-alloying in the immiscible Au/Ni(110) system. The critical Au coverage when de-alloying happens is also consistent with experiment. Furthermore, our simulation shows that the structural phase transition will lead to the saturation of the number of alloying Au atoms.
ACKNOWLEDGMENTS
W.Fan thanks D.Y.Sun for useful discussion, This work was supported by Chinese Academy of Sciences under KJCX2-SW-W11; Center for computational science, Hefei Institutes of Physical Science, Chinese Academy of Sciences; Nature Science Foundation of China, the Special funds for major state basic research and GAS projects,
References
- [1] U. Bardi, Rep. Prog. Phys. 57, 939 (1994).
- [2] S.C.Wang and G.Ehrlich, Phys. Rev. Lett. 67, 2509 (1991).
- [3] G.L.Kellogg, Phys. Rev. Lett. 67, 216 (1991).
- [4] R.Q.Hwang,J.Schröder, C.Günther, and R.J.Behm, G.L.Kellogg, Phys. Rev. Lett. 67, 3279 (1991).
- [5] D.D.Chambliss and S. Chiang, Surf. Sci. 264, L187 (1992).
- [6] S.Rousset, S.Chiang,D.E.Fowler, and D.D.Chambliss, Phys. Rev. Lett. 69, 3200 (1992).
- [7] M.S.Daw and S.M.Foiles, in The Structure of Surface II, edited by F.Van der Veen and M. Van Hove, Springer Series in Surface Science Vol. 11(Springer, Berlin, 19888) p. 125
- [8] C.T.Chan, K.P.Bohnen, and K.M.Ho, Phys. Rev. Lett. 69, 1672 (1992).
- [9] L.Pleth Nielsen, F. Besenbacher, I.Stensgaard, E. Lægsgaard, C.Engdahl, P.Stoltze, K.W.Jacobsen, and J.K.Nørskov, Phys. Rev. Lett. 71, 754 (1993).
- [10] J.Neugebauer and M.Scheffler, Phys. Rev. Lett. 71, 577 (1993).
- [11] C.Stampfl, M.Scheffler, H.Over, and W.Moritz, Phys. Rev. Lett. 69, 1532 (1992).
- [12] J.Neugebauer and M.Scheffler, Phys. Rev. B46, 16067 (1992).
- [13] C.Stampfl, J.Neugebauer, M.Scheffler, Surf. Sci. 307-309, 8 (1994).
- [14] H.Röder, R.Shuster, H.Brune, and K.Kern, Phys. Rev. Lett. 71, 2086 (1993).
- [15] S.Oppo, V.Fiorentini, and M. Scheffler, Phys. Rev. Lett. 71, 2437 (1993).
- [16] J.Tersoff, Phys. Rev. Lett. 74, 434 (1995).
- [17] G.Bozzolo, John Ferrante, John R. Smith, Phys. Rev. B45, 493 (1992).
- [18] G.Bozzolo, Rodrigo Ibañez-Meier, John Ferrante, Phys. Rev. B67, 7207 (1995).
- [19] L.Pleth Nielsen, F. Besenbacher, I.Stensgaard, E. Lægsgaard, C.Engdahl, P.Stoltze, and J.K.Nørskov, Phys. Rev. Lett. 74, 1159 (1995).
- [20] C.Pampuch, O.Rader, T. Kachel, W. Gudat, C. Carbone, R. Kläsges, G.Bihlmayer, S.Blügel, and W. Eberhardt, Phys. Rev. Lett. 85, 2561 (2000).
- [21] John R. Smith, Tom Perry, Amitava Banerjea, John Ferrante, Guillermo Bozzolo, Phys. Rev. B69, 6444 (1991).
- [22] John R. Smith and Amitava Banerjea, Phys. Rev. Lett. 59, 2451 (1987).
- [23] J.H.Rose, J.Ferrante, and J.R.Smith, Phys. Rev. Lett. 47, 675 (1981).
- [24] A. Banerjea and J.R.Smith, Phys. Rev. B 37, 6632 (1988).
- [25] P. Vinet, J.H.Rose, J.Ferrante, and J.R.Smith, J. Phys. Condens. Matter 1, 1941 (1989).
- [26] J.H.Rose, J.R.Smith, and J.Ferrante, Phys. Rev. B28, 1835 (1983).
- [27] N.Metropolis, A. W. Rosenbluth, M. N. Rosenbluth, A. H. Teller, and E. Teller, J. Chem. Phys. 21, 1087 (1953).
- [28] G.Bozzolo, R.D.Noese, J.Ferrante, and C. Amador, Journal of Computer-Aided Materials Design, 6: 1-32 (1999).
- [29] G.Bozzolo and John Ferrante, Phys. Rev. B45, 12191 (1992).
- [30] G.Bozzolo, John Ferrante, R.D.Noebe, Brain Good, F.S.Honecy and Phillip Abel, Computational Materials Science 15 169 (1999).
- [31] G.Bozzolo, Jorge E. Garcés and Phillip Abel, Surface Science 507-510, 394 (2002).
- [32] Jorge E. Garcés, G.Bozzolo, Phillip Abel, and Hugo O. Mosca, Applied Surface Science 167, 18 (2000).
- [33] G.Bozzolo, John Ferrante and Rodrigo Ibañez-Meier, Surface Science 352-354, 577 (1996).
- [34] Jorge E. Garcés, Hugo O. Mosca, G. Bozzolo, Surface Science 459, 365 (2000).
- [35] Hugo O. Mosca, Jorge E. Garcés, and G.Bozzolo, Surface Science 454-456, 707 (2000).
- [36] P.Légaré, G.F.Cabeza, and N.J.Castellani, Surface Science 441, 461 (1999).