The Glass Transition Temperature of Water: A Simulation Study
Abstract
We report a computer simulation study of the glass transition for water. To mimic the difference between standard and hyperquenched glass, we generate glassy configurations with different cooling rates and calculate the dependence of the specific heat on heating. The absence of crystallization phenomena allows us, for properly annealed samples, to detect in the specific heat the simultaneous presence of a weak pre-peak (“shadow transition”), and an intense glass transition peak at higher temperature. We discuss the implications for the currently debated value of the glass transition temperature of water. We also compare our simulation results with the Tool-Narayanaswamy-Moynihan phenomenological model.
Much recent research has focused on the properties of glassy water, the most common form of water in the universe, which can exist in more than one distinct amorphous formdebene ; universe ; angellRev . The conversion between different glass structures, the different routes producing glass structures, and the relation between the liquid and the glass phases are under active debate.
A particularly relevant aspect of this debate concerns the identification of the glass transition temperature at ambient pressure and the magnitude of the associated jump of the specific heat, an issue which has relevance also for determining the fragility of water. Extrapolation of in binary aqueous solutions, in the limit of vanishing solute concentration, provides the estimate K binary . Early differential scanning calorimetry (DSC) studies report conflicting results. Some experiments detect the glass transition did but others do not didnot . An exothermal peak in the specific heat of properly-annealed hyperquenched water supports the estimate KTg136 , with a specific heat jump of J/mol/K. This valuehallbrucker1 ; itoAngell has been recently debated Tg165 ; Johari2 ; angell . It has been suggestedangell that the small peak measured in Ref. Tg136 is a pre-peak typical of annealed hyperquenched samples preceding the true glass transition located at K. Assigning K would explain many of the puzzles related to the glass transition in water itoAngell ; Tg165 ; angell . Unfortunately, the K proposal can not be experimentally tested due to the homogeneous nucleation of the crystal phase at K.
Here we report a numerical study of the temperature dependence of the specific heat across the glass-to-liquid transition for the extended simple point charge (SPC/E) model for water. We analyze the effects both of the cooling rate and of annealing (“aging”) before heating the glass, since both effects are important for determining johariWaterAB ; tucker , and both effects have been studied extensively in many materialsmoynihan ; andMore . Numerical studies are particularly suited since crystallization does not take place on the time scale probed in simulations. With an appropriate choice of the heating and cooling rates to mimic the experimental conditions, we show that both the shadow and the glass transition peaks can be resolved in the same heating scan. Finally, we compare the simulation results with the Tool-Narayanaswamy-Moynihan (TNM) phenomenological model tool ; narayanGardon ; moynihan .
We perform NVT molecular dynamics (MD) simulations for a system of molecules, with periodic boundary conditions. Interactions are cut off at a distance of , where is the length parameter defined in the SPC/E potential, and the reaction field method is implemented to account for the long range interactions. We average quantities over 32 independent trajectories at fixed density g/cm3. During cooling or heating, is continuously changed by , where is the cooling/heating rate, and fs is the elementary time step. We perform: (i) cooling scans at constant cooling rate down to K, starting from equilibrium liquid configurations at K, (ii) heating scans at constant heating rate, starting from K glass configurations, (iii) aging at constant K, where significant aging effects are observed. We study two cooling rates K/s and K/s, to mimic respectively the standard and hyperquenched cooling rates, and one heating rate K/s. Slow experimental scan rates are typically K/s, while the slowest simulation scan rate compatible with present computational facilities is times faster ( K/s). Hence, the temperature at which the system will lose equilibrium on cooling will be significantly higher in simulations than in experiment. Still, the key fact that the structural relaxation time becomes longer than the experimental (or simulation) time is the same for experiments and simulations. Therefore, as we will show below, while the estimates differ, the -dependence and the phenomenology do not depend significantly on the scan rate. In hyperquench experiments, a cooling rate times faster than the slow or ‘standard’ rate is usually achieved, while in the present simulations the faster quench rate is approximately 300 times faster than the slower quench rate.
Figure 1 shows the specific heat calculated by differentiating the temperature dependence of the total energy of the system on heating at the rate K/s. The glass configurations are obtained by cooling equilibrium K liquid configurations at the ‘standard’ cooling rate K/s. Following the usual experimental protocol, we estimate from the intersection of the two dashed lines in Fig.1. The resulting value, , is slightly below the lowest at which equilibrium simulations can be performed for SPC/Efrancislong ; galloprl . The rise of J/mol/K, is more than an order of magnitude larger than the experimentally measured rise of J/mol/KjohariWaterAB . For K, coincides with equilibrium data for the SPC/E potentialpoole . Indeed, the equilibrium relaxation time of the system for K is ps, smaller than the characteristic scan time K ps.
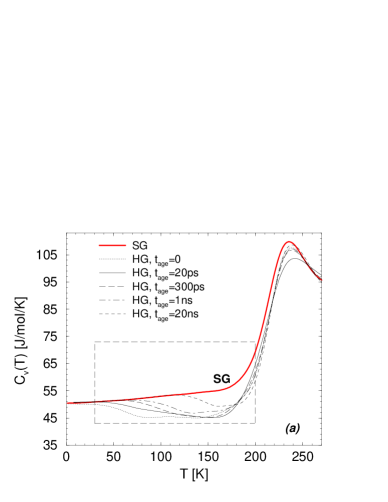
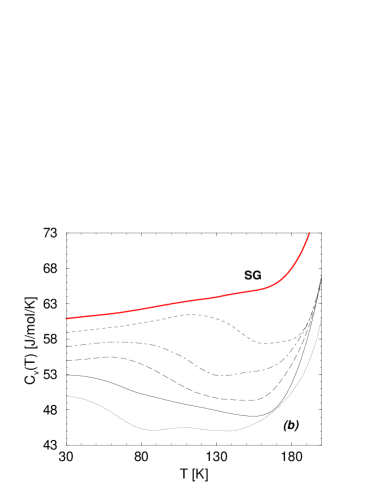
We next compare in Figs. 2(a) and 2(b) the behavior of on heating two different glasses, the ‘standard glass’ obtained with the cooling rate K/s, and the ‘hyperquenched glass’ obtained with the faster rate K/s. For the hyperquenched glass, develops a valley for , in agreement with DSC heating scan experimentsangell ; hodge2 ; gupta ; yue (indeed, Fig.2(a) is remarkably similar to Fig. 1 of Ref.gupta ). The presence of a valley can be related to the descent of the system on the potential energy landscape upon heating with a rate slower than the cooling rateourBriefComm . Figs. 2(a) and 2(b) show for the heating scan of the hyperquenched glass which has been annealed at , for different aging times ns. This annealing procedure is intended to mimic the experimental annealing procedurehodgeSumm . Note that aging reduces the valley in , and that as increases, evolves towards the standard glass value (Fig. 1). Inspection of the curves for large (Fig.2(c)) shows that a small pre-peak appears at K. If the standard protocol (Fig. 1) for the identification of the glass transition in the specific heat is applied, a of K is derived (Fig.2(c)). The amplitude of the peak in is of the order of J/mol/K, and is reminiscent of the experimental value obtained in DSC measurements of hyperquenched water after annealing. In the present case, in which crystallization does not interfere with the heating scan, there is no ambiguity in associating this peak with a precursor of the true glass transition which takes place at a much higher . To prove that the weak pre-peak is outside the noise level, we show in Fig. 3 the -dependence of the energy, where a clear maximum can be observed.
Results presented in Figs. 2 and 3 are consistent with recent anneal-and-scan experiments angell on hyperquenched inorganic glass which does not crystallize on heating. Our simulations thus suggest that the measured specific heat peak (Ref. Johari2 ) which has been used to identify is a pre-peak associated with the use of a hyperquenched sample combined with the annealing procedure.
Next, we discuss the possibility of modeling the simulation results using the TNM approachmoynihan ; hodge2 ; hodgeSumm , which is able to model the experimental heating scan of the specific heat for glasses generated with standard cooling rates (although it fails when applied to hyperquenched glassesgupta ). The TNM model assumes the response function of the system can be represented by a stretched exponential function with stretching parameter . It also assumes that the relaxation time depends not only on the bath temperature but also on a fictive temperature which accounts for the out-of-equilibrium condition. Narayanaswamy proposed that is related to by
| (1) |
where , and are constants and is the ideal gas constant footnote . In fact, Eq. (1) corresponds to Narayanaswamy’s original equation rewritten by Moynihan moynihan who introduced the parameter . An alternative relationscherer is offered by the generalization of the Adam-Gibbs expression, which connects, in equilibrium, to the configurational entropy . The resulting Adam-Gibbs-Scherer (AGS) expression is
| (2) |
where
| (3) |
is the Kauzmann temperature, is a constant, and is the difference between the specific heats of the liquid and the glass. The TNM model requires as a fitting parameter; additionally it requires the parameters (, , ) for the Narayanaswamy-expression, or (, , ) for the AGS expression.
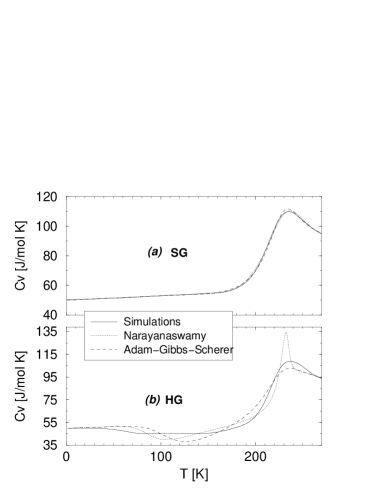
Figure 4 compares our MD results during the heating scan of the standard and hyperquenched glass with the predictions of the TNM model using both the Narayanaswamy and AGS expressions for . A detailed analysis will be presented elsewherefutureTNGwork ; here we show that both the Narayanaswamy and AGS expressions give satisfactory results only for the standard glass (Fig. 4(a)). The quality of the fit for the hyperquenched glass is unsatisfactory, as observed in the analysis of experimental data for hyperquenched samplesgupta , suggesting that in the hyperquenched experiments, the aging sample cannot be connected to a liquid at a fictive temperature ourBriefComm . It also suggests that the application of the TNM approach for testing the shadow glass transition must be taken with cautionJohari2 .
In summary, we show by a proper numerical protocol that the complex phenomenology of the glass transition can be reproduced in simulations, notwithstanding the large differences in cooling rates. The TNM model which is able to describe the experimental specific heat for the standard cooling rate also describes the corresponding simulation results. One advantage of simulations is to shed light on phenomena that occur outside the experimentally-accessible regionNatureGene . Our simulations show that the glass transition is characterized by a large specific heat peak, and when hyperquenched samples are annealed, the glass peak is anticipated at lower by a pre-peak, with a much lower amplitude. This result supports the recent reinterpretation of the existing experimental data angell , which identifies K as the temperature of the pre-peak, and suggests K as the ‘true’ glass transition temperature.
We thank the BU Computation Center for CPU time, and NSF Grants CHE0096892 and DMR0082535, MIUR Cofin 2001, Firb 2002 for support.
References
- (1) See P.G. Debenedetti, Metastable Liquids (Princeton University Press, Princeton, 1996), and the review P.G. Debenedetti, J. Phys.: Condens. Matter 15, 1669 (2003).
- (2) P. Jenniskens, S.F. Barnhak, D.F. Blake, and M.R.S. McCoustra, J. Chem. Phys. 107, 1232 (1997).
- (3) C.A. Angell, Ann. Rev. Phys. Chem. (in press).
- (4) J.A. Ghormley, J. Am. Chem. Soc. 79, 1862 (1957); C.A. Angell and J.C. Tucker, J. Phys. Chem. 84, 268 (1980).
- (5) J.A. MacMillan and S.C. Los, J. Chem. Phys. 42, 829 (1965); M. Sugisaki, H. Suga, and S. Seki, J. Chem. Soc. Jpn. 41, 2591 (1968).
- (6) J.A. Pryde and J.O. Jones, Nature 170, 635 (1952); J.A. Ghormley, J. Chem. Phys. 48, 503 (1967); D.R. MacFarlane and C.A. Angell, J. Phys. Chem. 88, 759 (1984).
- (7) G.P. Johari et al., Nature 330, 552 (1987).
- (8) A. Hallbrucker et al., J. Phys. Chem. 93, 7751 (1989).
- (9) K. Ito et al., Nature 398, 492 (1999).
- (10) V. Velikov et al., Science 294, 2335 (2001).
- (11) G.P. Johari, J. Chem. Phys. 116, 8067 (2002).
- (12) Y-Z. Yue and C.A. Angell, Nature (in press).
- (13) G.P. Johari et al., Science 273, 90 (1996).
- (14) C.T. Moynihan et al., J. Am. Ceram. Soc. 59, 12 (1976).
- (15) C.T. Moynihan et al., Ann. N.Y. Acad. Sci. 279, 15 (1976).
- (16) A.R. Berens and I.M. Hodge, Macromolecules 756, 15 (1982); H. Sasabe and C.T. Moynihan, J. Polym. Sci. 16, 1447 (1978); I.M. Hodge and G.S. Huvard, Macromolecules 16, 371 (1983); M.A. DeBolt et al., J. Am. Ceram. Soc. 59, 16 (1976).
- (17) A.Q. Tool, J. Am. Ceram. Soc. 29, 240 (1946).
- (18) R. Gardon and O.S. Narayanaswamy, J. Am. Ceram. Soc. 53, 380 (1970); O.S. Narayanaswamy, J. Am. Ceram. Soc. 54, 491 (1971).
- (19) F. W. Starr et al., Phys. Rev. E 60, 6757 (1999).
- (20) P. Gallo et al., Phys. Rev. Lett. 76, 2730 (1996); F. Sciortino et al., Phys. Rev. E 54, 6331 (1996).
- (21) S. Harrington et al., J. Chem. Phys. 107, 7443 (1997).
- (22) A.R. Berens and I.M. Hodge, Macromolecules 15, 762 (1981).
- (23) J. Huang, and P.K. Gupta, J. Non-Cryst. Solids 151, 175 (1992).
- (24) Y-Z. Yue, S.L. Jensen, and J. deC. Christiansen, Appl. Phys. Lett. 81, 2983 (2002).
- (25) I.M. Hodge, J. Non-Crystl. Solids 169, 211 (1994).
- (26) Narayanaswamy’s expression as written in Eq. (1) was first introduced by C.T. Moynihan, (see e.g. moynihan ).
- (27) G.W. Scherer, J. Am. Ceram. Soc. 67, 504 (1984); 69, 374 (1986).
- (28) N. Giovambattista et al., in preparation.
- (29) N. Giovambattista et al., Phys. Rev. (submitted).
- (30) O. Mishima and H.E. Stanley, Nature 396, 329 (1998).
- (31) A. Scala et al., Nature (London) 406, 166 (2000).