Cooling rate, heating rate and aging effects in glassy water
Abstract
We report a molecular dynamics simulation study of the properties of the potential energy landscape sampled by a system of water molecules during the process of generating a glass by cooling, and during the process of regenerating the equilibrium liquid by heating the glass. We study the dependence of these processes on the cooling/heating rates as well as on the role of aging (the time elapsed in the glass state). We compare the properties of the potential energy landscape sampled during these processes with the corresponding properties sampled in the liquid equilibrium state to elucidate under which conditions glass configurations can be associated with equilibrium liquid configurations.
One recent activity in the physics of supercooled liquids and glassespablo ; confbook is the search for the conditions under which a glass can be considered a liquid whose structural properties have been “frozen” during the preparation process. If the glass can be connected to a liquid state, then a thermodynamic description of the glass state can be developedteo ; parisimezard ; speedy ; mossa . Many routes can bring a system to an arrested disordered state angellscience95 , such as vapor deposition, pressure induced amorphization, hyperquenching or standard cooling. Only the last two provide a continuous path from the liquid to the glass state and hence are the best candidates for studying the connection between glass and liquid configurations.
Since water can be glassified by cooling only using hyperquenching techniques (i.e. with rates of the order of K/snaturejohari ), understanding the connection between the liquid state and glasses generated with different cooling rates is important. When the hyperquenched glass of water is properly annealed at Knaturejohari , a reproducible weak endothermic transition is observed which has been associated with the calorimetric glass transition temperature . For water, the standard cooling rate is not sufficiently fast to overcome crystallization, so active debate angel1 ; johari ; angel2 concerns how to relate the of hyperquenched water to the unmeasurable of the slowly cooled glass.
In this work we use molecular dynamics (MD) simulations to address the relation between liquid and glass configurations. We reproduce the same procedure followed experimentally to generate glasses. We use two cooling rates differing by almost three orders of magnitude. We also study the heating rate and aging effects in the glass, an aspect novel to numerical simulations. We work in the framework of the potential energy landscape (PEL) approach, in which the -dimensional configurational space — defined by the center of mass coordinates and by the Euler angles — is partitioned into a set of basins, each associated with a different local minimum of the PEL sw ; debenedettiNewNat . We focus in particular on the depth of the local minimum closest to the system point, and on the local curvatures of the PEL around the local minimum. We discover that with slow cooling rates, the glass retains a configuration very similar to a configuration sampled by the liquid at higher , and hence all structural properties of the glass can be related to the structural properties of the liquid. In this case, a fictive temperature can be defined, the temperature at which the glass configuration is sampled by the liquid. In the case of a fast cooling rate, aging phenomena are very active already during the cooling process. Dynamics moves the configuration in regions of the PEL which are never explored in equilibrium mossa2 . Further aging at low temperature increases the differences between the glass and the liquid. When this is the case, the glass does not possess a structure corresponding to the equilibrium liquid at any temperature and hence it is not possible to associate an unique fictive with the glass configuration.
We perform MD simulations for a system of molecules at fixed density, g/cm3, interacting with the SPC/E potentialberensen , with periodic boundary conditions. Interactions are cut off at a distance of ( parameterizes the Lennard-Jones part of the SPC/E potential) and reaction field corrections are added to account for the long range interactions. Quantities are averaged over 32 independent trajectories. We perform three types of MD calculations: (i) cooling scans at constant rate, starting from equilibrium liquid configurations at , (ii) heating scans at constant rate (from glass configurations at K), and (iii) aging runs at constant aging temperature (at K and K, where significant aging effects are observed). The two cooling rates are K/s and K/s, and the two heating rates are K/s and K/s. We will denote by fast-quenched glass the glass obtained with the fast cooling rate and by slow-quench glass the glass obtained with the slow cooling rate. An averaged slow scan requires a simulation lasting 320 ns, close to the maximum possible by our method. This limitation prevent us from studying larger systems footnote . The location of the system on the PEL is studied performing numerical minimizations (conjugate gradient algorithm) along the runs to estimate the closest local minimum configuration or inherent structure (), its energy and the set of eigenvalues of the Hessian matrixinm . The local curvatures around the minimum define in the harmonic approximation the multi-dimensional parabolic shape of each PEL basin. As a global indicator of shape we use the shape function defined as
| (1) |
where kJ/mol. At density g/cm3 the temperature dependence of and for the SPC/E model has been previously calculatednewPRL .
Focusing on landscape properties has the advantage that vibrational features are suppressed, and hence the remaining temperature dependence reflects structural changes. The landscape approach is particularly useful for comparing properties of different configurations. Indeed, at constant volume, in equilibrium, all landscape properties (i.e., , ) are functions only of . By eliminating , we can establish a direct relation between and , i.e. between properties of the landscape sampled in equilibrium. A set of configurations with the same can be considered representative of equilibrium configurations if and only if satisfies the equilibrium landscape relation. We compare the relation between shape and depth during cooling scans, heating scans and aging with the equilibrium relation. This allows us to test if the region of configuration space explored during the scans is identical to the region explored by the equilibrium liquid at some higher temperature.
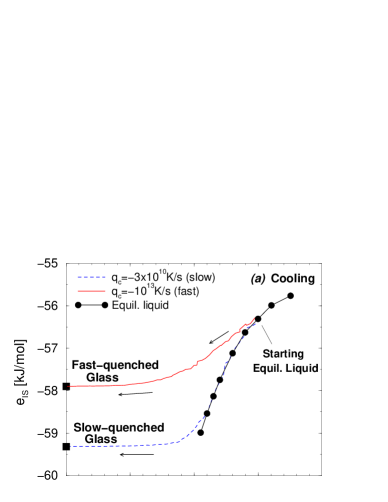
Figure 1a shows for the fast and the slow cooling rates, together with equilibrium values from Ref.newPRL . The equilibrium data show that in the liquid state, the system explores deeper and deeper basins on lowering and that at each , basins with a well-defined energy depth are populated. The fact that different depths are associated with different provides a mechanism for associating a configuration (whose value is known) to a fictive temperature , as suggested in Ref.kob . In the fast cooling case the liquid loses equilibrium at a very high temperature (around K), i.e., when the system is still sampling basins of high energy. In the slowest cooling case, the system loses equilibrium around K. For the fast cooling case, the range of in which changes is significantly larger, and more energy (from the where equilibrium is lost to the final ) is released during the cooling scan.
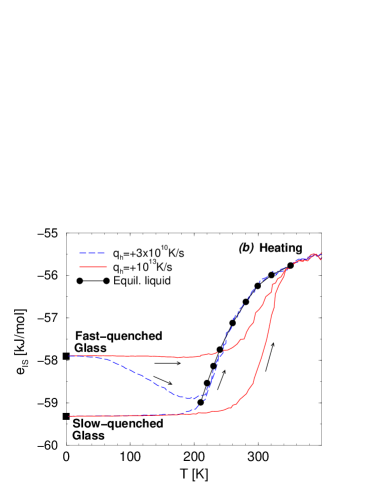
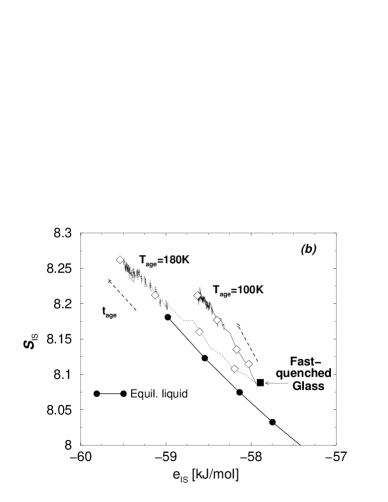
Figure 1b shows for the fast and slow heating rates starting both from the fast-quenched glass and the slow-quenched glass. For the fast heating rate, to reach equilibrium must reach a value larger than the at which the same system lost equilibrium on cooling (Fig. 1a). In the slow heating case, a new phenomenon appears for the fast-quenched glass, the system starts to explore PEL basins with lower and lower as it relaxes toward equilibrium, significantly changing the location of the system in configuration space.
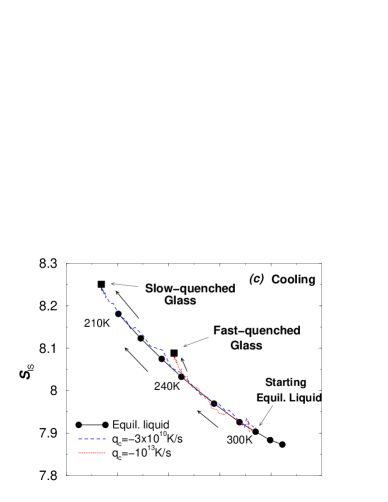
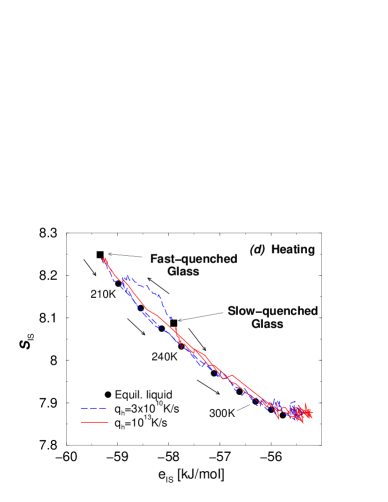
Figures 1c and 1d show the ) relation for the scans reported in Figs. 1a and 1b, respectively. One sees that in the slow cooling case, the cooling scan proceeds via a sequence of equilibrium configurations (since the relation coincides with the equilibrium one), i.e. basins with same depth explored during the slow scan and those in equilibrium have also the same shape. However, fast cooling generates a glass (the black square) which we see lies outside the equilibrium curve of Fig. 1c. In this case, basins explored during fast cooling that have the same depth as those found in equilibrium have smaller curvatures. During the slow heating process moves even further from the equilibrium line (Fig. 1d).
We now focus on the trajectory of the fast-quenched glass during aging at two different aging temperatures and . For both rates we find that is a monotonically decreasing function of aging time (Fig. 2a), suggesting that the system changes basin by finding specific directions on the PEL which involve low energy barriers. For long , , as found in atomic liquidskob ; aging . During aging, two different behaviors are again observed for the PEL relation (Fig. 2b). In the high scan, the system approaches equilibrium configurations, while for low the opposite is seen. Note (Fig. 2b) that aging at low moves the system even further from the equilibrium curve.
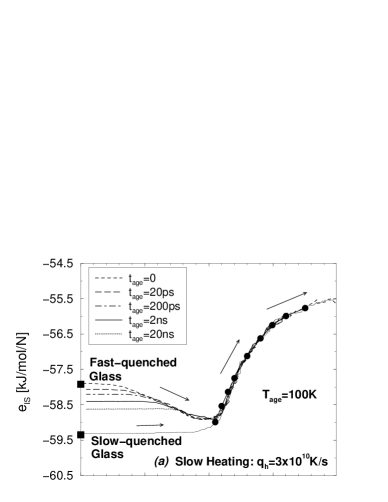
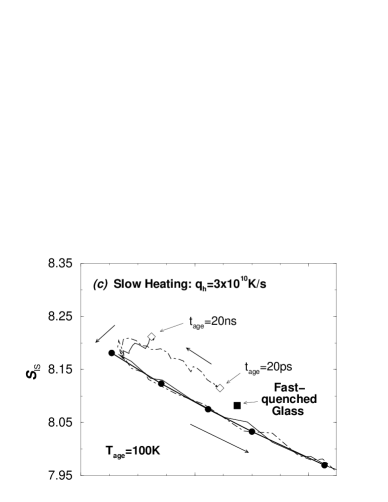
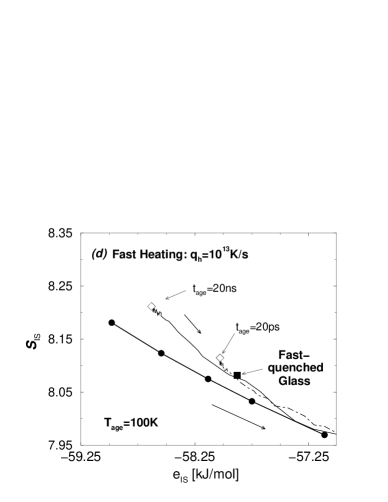
Next we show (Fig. 3) heating scans for different aging times after isothermal aging at K. Data for K (not shown) are qualitatively similar. The IS energy of the starting configuration is lower the longer the time spent at K before beginning to heat. We see (Fig. 3c) that is monotonic on heating. Figure 3b shows the results for the fast heating rate. In this case, increases so fast that the system does not have time to find deeper IS. Therefore, there are no aging effects and grows monotonically with . From Figs. 3a and 3b, we see that for the fast heating rate, equilibrium is reached at a much higher temperature compared to the case of the slow heating rate, in full agreement with the no-aging () case, as observed in Fig. 1b. The aging effects on are shown in Figs. 3c (for slow) and 3d (for fast) heating rates, confirming that in the slow heating case the fast-quenched glass keeps exploring new basins never seen in equilibrium before meeting the equilibrium curve.
In summary, we have shown that the fast-quenched glass significantly differs from the slow-quenched glass. To the extent that this model captures key features of real water, our work provides support to the idea that, if crystallization would not interrupt the cooling process in water, the slow-quenched glass would be characterized by a different compared to the fast-quenched glass angel1 ; johari ; angel2 . The analysis of simulated configurations has allowed us to clarify the differences between the slow- and the fast-quenched glass. The differences lie not only in the expected difference in but, more significantly, in the fact that the fast-quenched glass during cooling loses contact with the liquid state and starts to explore regions of the PEL which are never explored in equilibrium. The fast-quenched glass does not possess a structure corresponding to the equilibrium liquid structure at any temperature, and hence it is not possible to associate with it a unique fictive temperature. Finally, we have found that aging in the glass phase provides a mechanism for reducing differences between the liquid and the glass structures only if the temperature at which the system ages is sufficiently high. Remarkably, at low , differences between the liquid and the glass structures appear to increase with .
We thank C.A. Angell and S. Sastry for discussions, the BU Computation Center for CPU time, and the NSF Chemistry Program, MIUR Cofin 2002, Firb, and INFM Pra GenFdt for support.
References
- (1) P.G. Debenedetti, Metastable Liquids (Princeton University Press, Princeton, 1996).
- (2) Articles in Proc. 3rd Workshop on Non-Equilibrium Phenomena in Supercooled Fluids, Glasses, and Amorphous Materials, J. Phys.: Condens. Matter 15 (2003).
- (3) T. M. Nieuwenhuizen, Phys. Rev. Lett. 80, 5580 (1998); J. Phys. A 31, L201 (1998).
- (4) M. Mézard and G. Parisi, Phys. Rev. Lett. 82, 747 (1999).
- (5) R.J. Speedy, J. Chem. Phys. 114, 9069 (2001).
- (6) S. Mossa et al., Eur. Phys. J. B 30, 351 (2002).
- (7) C. A. Angell, Science 267, 1924 (1995).
- (8) G.P. Johari, A. Hallbrucker, and E. Mayer , Nature 330, 552 (1987).
- (9) V. Velikov, S. Borick and C.A. Angell , Science 294, 2335 (2001).
- (10) G.P. Johari, J. Chem. Phys. 116, 8067 (2002).
- (11) Y-Z. Yue and C.A. Angell, Nature (in press).
- (12) F. H. Stillinger and T. A. Weber, Phys. Rev. A 25, 978 (1982).
- (13) P.G. Debenedetti and F.H. Stillinger, Nature 410, 259 (2001).
- (14) S. Mossa et al., Philos. Mag. B 82, 695-705 (2002).
- (15) H. J. Berendsen et al., J. Phys. Chem. 91, 6269 (1987).
- (16) W. Kob et al., Europhys. Lett. 49, 590 (2000).
- (17) L. Angelani et al., R. Di Leonardo, G. Parisi, and G. Ruocco , Phys. Rev. Lett. 87(5), 055502 (2001).
- (18) The Hessian matrix is the matrix formed by the second derivatives of the potential energy with respect to the center of mass coordinates and Euler angles of each molecule.
- (19) F. Sciortino et al., Phys. Rev Lett. 91,155701 (2003).
- (20) A previous study for a Lennard-Jones system has convincingly shown that size effects in the supercooled state do not significantly alter statistical properties of the PEL provided that the number of particles is larger than [S. Büchner and A. Heuer, Phys. Rev. Lett. 84, 2168 (2000)].