[
Amorphous ZrO2 from Ab-initio molecular dynamics:
Structural, electronic and dielectric properties
Abstract
Realistic models of amorphous ZrO2 are generated in a “melt-and-quench” fashion using ab-initio molecular dynamics in a plane-wave pseudopotential formulation of density-functional theory. The structural properties of the resulting amorphous models are analyzed, with special attention to coordination statistics. The vibrational and dielectric properties of one of these models are then investigated from first principles using linear-response methods. The electronic dielectric constant and Born effective charges are found to be very similar to those of the crystalline phases. Encouragingly, the predicted total static dielectric constant is 22, comparable to that of the monoclinic phase. This work is motivated by the search for improved gate dielectric materials for sub-0.1 m CMOS technology, and may also have implications for HfO2 and for silicates of ZrO2 and HfO2.
pacs:
PACS numbers: 77.22.-d, 61.43.Bn, 63.50.+x, 71.23.Cq]
I Introduction
The projections in the International Technology Roadmap for Semiconductors call for an effective gate dielectric thickness of approximately 1 nm for 0.1 m CMOS technology by the year 2006. However, the use of current SiO2 and silica nitride materials in this regime will become problematic because of intolerably high leakage currents. A possible solution, currently under intensive exploration, is to replace SiO2 as the CMOS gate dielectric by an oxide having a much higher dielectric constant. Use of such a “high- dielectric” would allow one to make physically thicker films, hence reducing the leakage current, while at the same time maintaining or even increasing the gate capacitance. High- metal oxides are at the focus of this effort, with HfO2, ZrO2, and their mixtures with SiO2 showing great promise.[2, 3]
In previous work, we studied the structural, electronic, and lattice dielectric propterties of crystalline phases of ZrO2 and HfO2 (Refs. [4, 5, 6, 7]) using a first-principles density-functional approach. We found that the lattice dielectric constant depends strongly on crystal phase; for example, for ZrO2, we find orientationally-averaged total values of 37 and 38 for cubic and tetragonal phases, and smaller values of 20, 20, and 19 for the monoclinic and for two orthorhombic phases, respectively. We also found strong anisotropies, most notably a large in-plane susceptibility for the tetragonal phase. Differences in the electronic density of states and in band gaps were also studied,[6, 7] but these are not profound enough to have much effect on the purely electronic dielectric constant, which remains approximately 5 for all crystal phases. These results suggest that novel structural modifications of ZrO2 or HfO2 might possibly provide a route to enhanced dielectric constants.
One of the great advantages of using SiO2 for CMOS technology has been the fact that it forms an amorphous oxide, thus allowing it to conform to the substrate with enough freedom to eliminate most electrical defects at the interface. Materials like ZrO2 and HfO2 tend to crystallize much more readily than SiO2, raising questions about whether equally smooth and clean interfaces can be formed from such materials. While it is possible to form such oxides in an amorphous state by low-temperature processes, they tend to recrystallize during the thermal treatments needed for later stages of device processing. One current avenue of investigation is to consider crystalline oxides, such as perovskites, that can be grown epitaxially on Si.[8] Another is to search for ways to raise the recrystallization temperature of ZrO2- or HfO2-based materials, e.g., by incorporating Si, Al, or N into the random network structure. However, very little theoretical guidance is available for such initiatives, since almost nothing is known about the structure and atomic-scale properties even for pure amorphous ZrO2 or HfO2.
With these motivations, we have embarked on a theoretical study of the structure and properties of amorphous ZrO2 (-ZrO2). In this paper, we report the construction of realistic models of -ZrO2 through “melt-and-quench” ab-initio molecular-dynamics (MD) simulations. This approach, first pioneered by Car and Parrinello,[9] combines density-functional theory (DFT) with MD into a powerful tool for investigating the physics of large systems, especially for liquids and amorphous structures where the atomic coordinates cannot be obtained from diffraction experiments. Using the generated models as prototypes for -ZrO2, we investigate the atomistic structure, especially the bonding and coordination statistics, and then focus in detail on the lattice dielectric properties. While the calculations have been carried out only for -ZrO2, it can be expected that many conclusions would hold also for -HfO2 in view of the close chemical and crystallographic similarity of these two materials.
The paper is organized as follows. Section II describes the theoretical approach of our first-principles simulations, the supercells used for modeling -ZrO2, and the linear-response method used to analyze the lattice dielectric properties. In Sec. III we present and discuss the structural properties of the amorphous models obtained from the MD simulations, with special attention to bonding and coordination. The results of the linear-response calculations, such as the Born effective charges, phonon modes, and dielectric tensors, are then presented and discussed in Sec. IV. Section V concludes the paper.
II Theory
A Details of static structural calculations
In this work, we perform ab-initio constant-temperature MD as implemented in the VASP simulation package, [10] in which the electronic structure is described within DFT [11, 12] in the local-density approximation (LDA), [13] using a plane-wave basis and ultrasoft pseudopotentials. [14] At each molecular-dynamics step, the instantaneous Kohn-Sham electronic wavefunctions are obtained using the RMM-DIIS (residual minimization with directive inversion in the iterative subspace) method,[15, 16] which is found to be particularly efficient for diagonalizing the Kohn-Sham Hamiltonian for large systems such as the 96-atom supercell considered here. The forces at each MD step are calculated as the derivatives of the generalized free energy with respect to the ionic positions based on the Hellmann-Feynman theorem.[17] The calculated forces are then used to integrate Newton’s equations of motion for the ionic degrees of freedom via the Verlet algorithm.[18]
| Phase | Parameter | ||
|---|---|---|---|
| monoclinic | |||
| tetragonal | |||
| cubic | |||
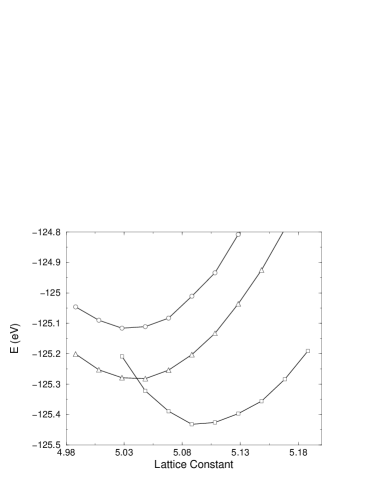
Because MD simulations on large supercells are quite computer-intensive, we have taken some care to make the calculations as efficient as possible. In particular, we have reduced the plane-wave cutoff energy to 15 Ry, and the pseudopotential for Zr includes only the outermost shells (4, 5) in the valence. To test the adequacy of these approximations, we tabulate in Table I the lattice parameters calculated with VASP using the current settings and those determined in Ref. [4], where the cutoff was 25 Ry and the 4 and 4 Zr levels were included in the valence. It can be readily seen that they agree very well. In Fig. 1, we show the calculated ground-state energies of the three ZrO2 phases (monoclinic, tetragonal, and cubic). The energy ordering (monoclinic lowest, cubic highest) is qualitatively and semiquantitatively correct. We thus conclude that the chosen pseudopotentials and plane-wave cut-off are adequate to correctly reproduce the energetics of the three ZrO2 phases.
B Supercell structures
In our simulation, -ZrO2 is modeled to have periodic boundary conditions with a cubic supercell containing 96 atoms. This is the same content as a 222 repetition of the monoclinic unit cell, since each monoclinic cell contains 4 chemical formula units (4 Zr atoms and 8 oxygen atoms). In fact, the cubic lattice vectors are only slightly distorted from the 222 monoclinic ones ( and the lengths of three lattice vectors differ only within ).[4] Thus, we use as a starting point a structure in which the lattice vectors are perfectly cubic but the fractional coordinates are those of the relaxed monoclinic structure. (This monoclinic structure remains stable in this environment; that is, when it is relaxed under fixed cubic lattice vectors, only small further displacements occur and the symmetry of the atomic coordinates remains monoclinic.) All subsequent MD simulations are done using fixed cubic lattice vectors for the supercell, and using single -point sampling at the point of the Brillouin zone.
C Ab-initio molecular dynamics
The “melt-and-quench” simulation scheme proceeds by carrying out a series of MD simulations, each at a fixed temperature (i.e., in the canonical ensemble). Temperature is sequentially increased, step by step, from room temperature () to some hypothetical temperature () high enough to liquefy the system. At each step, the structure obtained from the previous MD simulation is used as the starting point for the next one. The process is then reversed to quench the system back to . For each MD simulation, the system is given enough time to reach its thermal equilibrium in order to eliminate its correlation to the previous structure. In the case of -ZrO2, we let the system evolve at temperatures ranging from zero to 4000 K, well above the experimental melting point of 2980 K. The system is then rapidly quenched back to 300 K, followed by a relaxation to zero temperature of both atomic coordinates and lattice vectors.
A canonical ensemble is realized using a Nosé thermostat, which modifies the Newtonian MD by introducing an additional degree of freedom such that the total energy of the physical system is allowed to fluctuate. [19, 20] In the algorithm of Nosé, the extra degree of freedom — the Nosé mass — controls the frequency of the temperature fluctuations. In principle, the Nosé mass should be chosen so that the induced temperature fluctuations show approximately the same frequencies as the “typical” phonon frequencies of the considered system. [21] We know from Ref. [4] that the phonon frequencies at the zone center in monoclinic ZrO2 are in the range of 100 – 748 cm-1, corresponding approximately to 40 – 300 fs in period. Our experience shows that is rather insensitive to the designated temperature. In the case of ZrO2, = 0.15 – 0.20 has been found to be suitable. For in this range, the characteristic period of the temperature fluctuations is approximately 40 fs, which corresponds the high end of the phonon spectrum for monoclinic ZrO2.
It has to be emphasized that VASP currently supports only constant-volume MD simulations, i.e., the volume of a unit cell is fixed during a “melt-and-quench” simulation. In order to study the influence of volume on the resultant structure, we carry out a series of similar MD simulations on supercells of different volumes, as will be discussed in details in Sec. III A.
D Details of the linear-response calculations
The dielectric properties of the MD-simulated amorphous models of ZrO2 are calculated by the specialized linear-response techniques as implemented in ABINIT, [22] a simulation package that is also based on DFT with pseudopotentials and plane-wave expansion. ABINIT has the capability to calculate response functions such as phonon dynamical matrices, dielectric tensors, and Born effective charge tensors via a variational approach to density-functional perturbation theory [23, 24] in which phonon displacements and static homogeneous electric fields are treated as perturbations. Our linear-response calculations are performed within the LDA [13] using the Perdew-Wang’s parameterization. [25] The Brillouin zone is sampled only at the point. Extended norm-conserving pseudopotentials [26] with valence configurations of Zr(4,4,4,5) and O(2,2), and a cutoff energy of 35.0 Hartree, are found to provide satisfactory convergence.
III Amorphous Models of ZrO2
A Generation of amorphous structures

The “melt-and-quench” MD simulations are schematically illustrated in Fig. 2. At each selected temperature, the ZrO2 system is allowed to run for 1.5 ps to reach its thermodynamical equilibrium. The time step for the simulations is set to be 3 fs for 300 – 2500 K, and is reduced to 2 fs when is in the range of 3000 K to 4000 K in order to suppress numerical error at higher temperature. The total simulation time is 22.5 ps (see Fig. 2).
As mentioned in Sec. II C, several supercells with different volume are used in our simulation. The prototypical supercell, designated as the -cell, is adjusted to have its volume equal to , where is the volume of a unit cell of monoclinic ZrO2. The side length of the -cell is thus determined as 10.320 a.u.. The other cells, designated as the 2-, 4-, 7-, and -cell, have their side lengths increased by 2%, 4%, 7%, and 11% over that of the -cell respectively. This information is summarized in Table II.
| Supercell Type | Increment (%) | Side Length () |
|---|---|---|
| -cell | 0 | 10.320 |
| 2-cell | 2 | 10.527 |
| 4-cell | 4 | 10.727 |
| 7-cell | 7 | 11.043 |
| 11-cell | 11 | 11.467 |
| (Å3) | (Å3) | CN (Zr/O) | Descrip. | |
|---|---|---|---|---|
| -cell | 1099.2 | 1041.7 | 8 / 4 | Crystal |
| 2-cell | 1166.5 | 1091.9 | 7 / 3, 4 | Crystal |
| 4-cell | 1234.4 | 1040.8 | 8 / 4 | Crystal |
| 7-cell | 1346.1 | 1230.8 | 5–8 / 2–5 | Amorph. |
| 11-cell | 1507.9 | 1329.6 | – | Collapsed |
The “melt-and-quench” simulations are performed on these five candidate supercells. The results are summarized in Table III, where is the initial volume of the supercell that was kept fixed during the MD simulation, and denotes the volume resulting from the final zero-temperature structural relaxation of coordinates and lattice vectors at the end of the simulation. The coordination number of each atom is determined by counting the number of atoms within a cutoff radius of 3.00 Å, which can be compared with the range of Zr–O bond lengths, 2.035 – 2.233 Å, that characterizes monoclinic ZrO2.[4] It can be readily seen that the volume has a significant effect on the final structure. For the 11-cell, we find that the atomistic structure collapses into smaller clusters accompanied with “spatial voids” even at room temperature (), suggesting that the supercell volume is too large to sustain the atomic structure. For the -, 2- and 4-cell, during the “melt-and-quench” simulation the coordination numbers suggest some degree of disorder, but the final structures recrystallize when the systems are quenched back and relaxed to the ground state.
Fortunately, a reasonable amorphous model of ZrO2 (called “Model I”) is realized from the 7-cell. Although it has an initial volume of 1346.1 Å3, a subsequent relaxation to zero temperature reduces the volume to 1230.8 Å3, which is approximately 12% bigger than of the -cell. Using Model I as the starting structure, we perform a second “melt-and-quench” simulation and obtain another model of -ZrO2, which is called “Model II” hereafter. In the remainder of this section, we will mainly focus on analyzing the structural properties of two models.
B Analysis of amorphous structures
1 Amorphous Model I

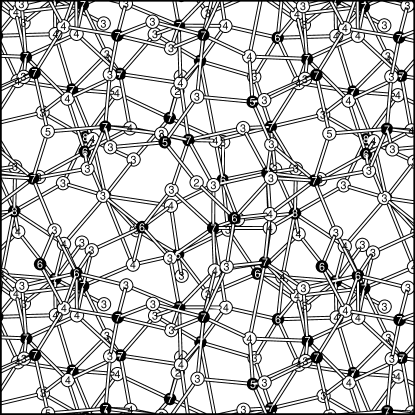
Figure 3 tracks the atomic coordination number (CN) of the Zr and O atoms during the formation of Model I, starting from the 7-cell in which oxygen atoms have CN=3 or 4 and Zr atoms have CN=7. Interestingly, the system retreats at =1500 K to a higher-symmetry structure with CN=3 and 6 for O and Zr atoms respectively. A hint of disorder is displayed at =3000 K via the incidence of the 5-coordinated Zr atoms and the 2-coordinated O atoms. When is increased to 4000 K, the distribution of coordination numbers suggests that the system has become strongly disordered, which we take as a sign that it has melted. The system is then quenched quickly (about 12 ps, see Fig. 2) back to . From the variation of the coordination numbers, one can readily see that the amorphous character has survived to . A snapshot of this amorphous structure (Model I) is shown in Fig. 4, from which we can directly see that a reasonable amorphous structure appears to have been generated. The numbers on the atoms in Fig. 4 indicate the coordination numbers.

The bond distributions of Zr and O atoms in Model I are plotted in Fig. 5. While there are 5- and 8-coordinated Zr atoms in Model I, it is obvious that the 6- and 7-coordinated Zr atoms predominate. We can see from Fig. 5 that most of the oxygen atoms have a CN of 3 or 4, except for a few 2- or 5-coordinated oxygen atoms.
| Model I | Model II | |||||||||
|---|---|---|---|---|---|---|---|---|---|---|
| Zr5 | 2 | 1.90 | 2.12 | 2.04 | - | - | - | - | ||
| Zr6 | 12 | 1.96 | 2.32 | 2.09 | 10 | 1.92 | 2.66 | 2.11 | ||
| Zr7 | 16 | 1.97 | 2.96 | 2.17 | 18 | 1.95 | 2.98 | 2.16 | ||
| Zr8 | 2 | 2.05 | 2.82 | 2.25 | 4 | 2.02 | 2.94 | 2.24 | ||
| O2 | 2 | 1.94 | 2.02 | 1.98 | 3 | 1.92 | 2.05 | 1.98 | ||
| O3 | 43 | 1.91 | 2.33 | 2.09 | 32 | 1.92 | 2.95 | 2.10 | ||
| O4 | 18 | 2.01 | 2.92 | 2.23 | 29 | 1.99 | 2.98 | 2.22 | ||
| O5 | 1 | 2.18 | 2.96 | 2.47 | - | - | - | - | ||
The number of atoms having each CN, together with the minimum (), maximum (), and average () bond length for each CN, are reported in Table IV for both Model I and Model II. The bond lengths are found to be in the range of 2.04 – 2.25 Å for , generally similar to the range of 2.035 – 2.233 Å that we found previously for monoclinic ZrO2.[4] We find that the average bond length decreases monotonically as the coordination number increases, consistent with the usual expectation, based on chemical principles, of an inverse correlation between CN and bond strength. The minima () and maxima () of the bond lengths manifest similar behavior.
2 Amorphous Model II
As mentioned earlier, a second amorphous structure, Model II, is obtained using Model I as the starting input structure. Figures 6 and 7 present results for Model II in a parallel fashion as for Figs. 3 and 5 for Model I. A significant change in going from Model I to Model II is the lack of the 5-coordinated Zr and O atoms (Zr5 and O5 in Table IV). Interestingly, in Model II, the numbers of O3 and O4 atoms have become nearly equal, while in Model I there was a substantial difference (=43 for O3, 18 for O4). The relative populations of Zr6 and Zr7 do not change very much from Model I to Model II, although a slight shift from Zr6 to Zr7 has occurred. The average lengths of the bonds in the two amorphous models are approximately equal. Finally, we point out that the density of the system has increased by 6% in going from Model I to Model II.
C Discussion

We have presented, in this section, two models of amorphous ZrO2 obtained via a “melt-and-quench” scheme using ab-initio MD. Since the volume in our simulations is not allowed to vary in any single MD run, certain candidate supercells of different volume have been constructed in order to study the effects of volume on the final amorphous structures (see Table II). One candidate cell (i.e. the 7-cell in Table II) successfully leads to an amorphous model of ZrO2 (Model I). The density of the 7-cell is about 20% less than the density of monoclinic ZrO2 (), but the final zero-temperature relaxation of atomic coordinates and lattice vectors reduces the density somewhat, such that the final Model I has a density 12% smaller than . A second amorphous structure, Model II, is generated using Model I as the starting structure. The final mass density increases 6% in going from Model I to Model II.
Although the crystalline phases of ZrO2 have been extensively investigated both experimentally and theoretically (Ref. [4] and references therein), there has been very little work to characterize the amorphous phase. Experimental efforts have mainly involved studies of -ZrO2 in the form of powders [27, 28] or thin films. [29] As for a-ZrO2 thin films, the resulting structure may be expected to depend strongly on deposition and processing conditions and on stoichiometric variations and impurities. Moreover, while ZrO2 films grown at high temperature are typically polycrystalline, there are hints that ZrO2 films grown at low temperature may be a mixture of amorphous and polycrystalline phases. One might also expect that the amorphous structure in thin films could be quite different from the “bulk” amorphous state that our model attempts to simulate. Thus, a direct comparison of our results with experiments may not presently be feasible. In particular, Winterer [29] used a thin-film sample (presumably a-ZrO2) with a density of 4.2 g/cm3, approximately 71% of the density of monoclinic ZrO2 (=5.89 g/cm3). The density of his sample corresponds to that of the 11-cell in our simulation. According to our calculations, the volume at this density is too large to sustain a void-free atomistic structure. On the contrary, the densities of two amorphous structures we simulated — Model I and II — are about 88% and 94% of . Such a large difference in density would naturally result in important differences in the local structure (e.g., coordination numbers) and the overall physical properties. In any case, in view of the potential importance of ZrO2 and HfO2 in CMOS gate dielectrics, it can be hoped that more experimental work in this area may soon emerge.

IV Dielectric Properties of -ZrO2
A Introduction
The dielectric properties of amorphous ZrO2 are calculated using the linear-response features of the ABINIT package. Since the structural models generated in Sec. III B are quite large and have essentially no symmetry, the computation of their dielectric properties is quite time-consuming. Therefore, we could afford to carry out a full study of the dielectric properties of only one of these models, and we somewhat arbitrarily chose to focus on Model I.
Before computing the dielectric properties with ABINIT, the ground-state structure of Model I obtained in VASP is first relaxed again using ABINIT for consistency. The lattice constant increases slightly from 10.717 Å to 10.917 Å, corresponding to a 5.6% increase in volume with respect to the ground-state volume of 1230.76 obtained in VASP, while the atomic coordinates change very little (less than 1%). We use the newly relaxed structural coordinates in our subsequent linear-response calculations.
B Results
The purely electronic dielectric tensor is computed to be
Clearly this tensor is approximately isotropic and diagonal, as expected for any large supercell containing an amorphous material. We obtain an orientationally-averaged dielectric constant of =4.6. This is only slightly smaller than the values obtained previously for the various crystalline phases of ZrO2 (5.3–5.7),[4, 6, 30, 31] confirming our previous conclusion that is fairly insensitive to the structural phase.
In order to obtain the lattice contribution to the dielectric tensor, we first need to compute the phonon mode frequencies and effective charges. Beginning with the mode frequencies, we present in Fig. 8(a) a histogram plot of the phonon DOS. (To be more precise, this is the DOS of modes at the Brillouin zone center of the supercell; this accounts for the absence of very low-frequency modes in the plot.) As can be seen in Fig. 8(a), the phonon modes extend up to about 850 cm-1, and aggregate roughly into three groups with frequencies in the range 70 – 300, 300 – 510, and 510 – 850 cm-1. The overall DOS spectrum does not show the kind of discrete features expected for crystalline solids.
Next, we use the computed mode effective charges and frequencies of zone-center modes to construct the “infrared activity” shown in Fig. 8(b) and defined as the phonon DOS weighted by . (That is, the frequency integral of this function gives the lattice contribution to the isotropically averaged dielectric constant. Here the scalar mode effective charge , defined via , is essentially the projection of the atomic tensors onto the dynamical matrix eigenvectors as described in Eqs. (6-9) of Ref. [4].) We find that the largest contribution to the lattice dielectric response comes from modes of low frequency, 100-250 cm-1.

From these ingredients, we calculate the total lattice contribution to the dielectric tensor, which is
Combining with the purely electronic dielectric tensor, the total dielectric tensor is then
Once again, we find that these tensors are roughly diagonal and isotropic, which tends to confirm that our structural model is indeed amorphous. Taking orientational averages, we can summarize our results by observing that the purely electronic dielectric constant 4.6 is augmented by a lattice contribution 17.6 for a total dielectric constant 22. For the crystalline phases, we found that and (in contrast to ) are strong functions of crystal structure, with ranging from about 14 to 33, or ranging from about 19 to 39.[4, 5, 6, 7] Here, we find that the dielectric constant of -ZrO2 (=22) is similar to that calculated previously for the monoclinic (=20) and two orthorhombic phases (=20 and 19).[4, 6]
C Decomposition by atom type
Clearly it is desirable to understand more fully the various contributions to the lattice dielectric response of the amorphous form of ZrO2. To this end, we now decompose various lattice properties by “atom type” (that is, by chemical species and coordination number) in the hope that such an analysis may provide further insight into our numerical results.
We begin by decomposing the total phonon DOS in Fig. 8(a) into a local DOS on each type of atom corresponding to the rows of Table IV. The total DOS can be decomposed as where the local DOS for atoms of type is
| (1) |
Here is the eigenfrequency of phonon mode , runs over atom types (O2–O5, Zr5–Zr8), and is the component of the eigenvector of phonon mode for atom along Cartesian direction . The results are plotted in Fig. 9.
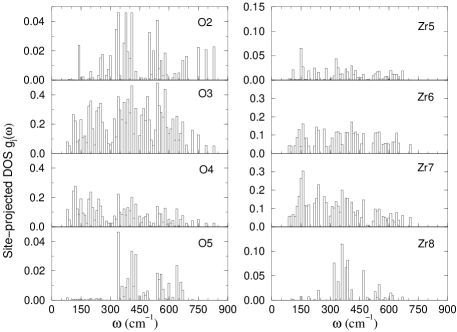
We were hopeful that such a decomposition might help us understand whether the modes associated with certain atom types are systematically much softer or harder. Instead, no clear trends emerge from Fig. 9. (The different appearance of the spectra for O5 and Zr8 most probably results from the lack of statistics for these atoms, which occur in the supercell only once and twice, respectively.) A slight reweighting of the spectra towards softer mode frequencies for increasing atomic coordination numbers can be observed, but this is not a very strong effect.

Next we test how the atomic Born effective charges correlate with atom type. Recall that the Born effective charge tensor Z quantifies the macroscopic polarization along Cartesian direction induced by a displacement of sublattice along . Due to the amorphous nature of our model, the calculated tensors have no symmetry, although we find that for most atoms the diagonal elements are dominant. To reduce the large quantity of data to manageable proportions, we present in Fig. 10(a) a scatterplot of just the isotropic averages (i.e., one third of the trace) of the atomic tensors sorted by atom type for all 96 atoms.
We find that the values are fairly tightly clustered about their average values of 5.0 and 2.5 for Zr and O, respectively. These are just slightly smaller than the typical values of 5.4 (Zr) and 2.7 (O) computed for the crystalline phases,[4, 5] but still clearly larger than the nominal chemical valences of 4 and 2, indicating that significant partial covalent character survives in the amorphous phase.
To investigate the roles of the various atom types further, we have carried out an analysis in which we also make an atomic decomposition of the lattice dielectric response.[4] To do this, we first decompose the lattice dielectric into contributions from pairs of atoms and ,
| (2) |
where and label the Cartesian directions. Here
| (3) |
where and are the eigenvalue and eigenvector of the force constant matrix for the phonon mode , is the volume of unit cell, and . We then heuristically define the contribution coming from atom to be
| (4) |
Finally, we will refer to the trace
| (5) |
as the “dielectric activity” of atom .
This quantity is plotted versus coordination number in the scatterplot of Fig. 10(b). The results indicate that a large number of atoms contribute, but that a notable subpopulation of mostly 6-fold Zr atoms are particularly strong contributors.
D Discussion
The dielectric constant () of our amorphous model is much larger than that of SiO2 () and quite comparable to the average dielectric constant of the monoclinic phase. Thus, we find that from the point of view of this one criterion alone, -ZrO2 is indeed a promising high- dielectric for next-generation gate dielectrics. Of course, many other issues need to be addressed, not the least of which is the stability (e.g., as measured by the recrystallization temperature) of the amorphous phase.
Direct comparison with experiment is difficult, both because few experimental measurements on amorphous ZrO2 are available, and because the sample preparation procedures may vary and may result in rather different amorphous samples.[32, 33] We compare here with the recent work of Koltunski and Devine, [32] focusing mainly on the sample deposited at room temperature using no rf bias (for which spectra are shown in Figs. 1(c) and 2(c) of Ref. [32]) since the authors judged this sample to be their “most amorphous” one. (Upon annealing, the samples tended to recrystallize partially to monoclinic and tetragonal phases.) These authors reported a dielectric constant (at 100 kHz) of 15 – 18 as measured electrically on the as-deposited ZrO2 thin films. The optical refractive index measured at 632.8 nm was in the range = 1.83 – 1.85. For this most amorphous sample, the absorbance spectrum, obtained using a Nicolet Fourier-transform infrared spectrometer, shows some TO modes beyond 1000 cm-1. However, since our calculation does not show any phonon modes in this range, we suspect these may be defect-related features. The sample shows broad TO and LO features centered at frequencies identified as 410 cm-1 and 693 cm-1, respectively.[32] (The authors also pointed out that use of the Lyddane-Sachs-Teller relation would yield an estimate of for the amorphous phase, but this method substantially underestimates because the IR measurements did not extend to very low frequency.) While our value of 22 certainly exceeds the experimentally measured one of 15–18, it is roughly the same order of magnitude, and better agreement might not be expected in view of the fact that the nanostructure and stoichiometry of the experimental film are imperfectly characterized.
V Summary
We have generated two realistic models of amorphous ZrO2 via a “melt-and-quench” scheme using ab-initio MD simulations. Candidate supercells of different volume were constructed in order to study the effects of volume on the simulated structures. An amorphous model (Model I) was obtained from one candidate structure (i.e., the 7-cell), avoiding recrystallization or void formation during the “melt-and-quench” sequence. The equilibrium density of this model is 12% less than that of the monoclinic phase. The second amorphous structure (Model II) was generated from Model I with further processing. We expect both models to be reasonable representatives of -ZrO2. The structural properties and the bond-length distributions of Model I and II were analyzed, and both models were found to be composed mainly of 6- and 7-fold coordinated Zr atoms and 3- and 4-fold coordinated O atoms.
The Born effective charges, phonon mode vectors and frequencies, and electronic and lattice dielectric tensors were then calculated for Model I using linear-response methods. The phonon DOS was found to be relatively featureless, and the infrared activity spectrum (i.e., the DOS weighted by ) showed a broad peak in the range of 100–250 cm-1 in the phonon spectrum. The calculations show that the Born effective charges of the Zr and O atoms are fairly narrowly distributed about 5.0 and 2.5, respectively, rather similar to what was found previously for the crystalline phases. Both the electronic and lattice contributions to the dielectric tensor were found to be fairly isotropic, as expected for an amorphous structure. The calculated electronic contribution was about 4.6, slightly less than for the crystalline phases. On the other hand, the lattice contribution to was calculated to be 17.6, rather similar to the average value of monoclinic ZrO2, though still significantly smaller than for the cubic and tetragonal phases.
It is difficult to know just how similar our “theoretical a-ZrO2” is to “experimental a-ZrO2”. There are difficulties on both sides of the comparison. On the theoretical side, several approximations have been introduced. First, the modest size of our model supercell (222) is a serious approximation, even though it is essentially at the limit of current computational capabilities. However, the nearly isotropic form of the lattice () and electronic () dielectric tensors tends to confirm that we have lost the memory of the initial crystalline structure and obtained an amorphous one, in spite of the supercell size limitation. Second, recall that the 4 and 4 electrons were included in the valence in the Zr pseudopotential for the MD simulations, but not for the linear-response calculations. This additional approximation could affect the accuracy of the computed dielectric properties of our amorphous structure. However, we believe this approximation is not very significant since the structural calculations on the monoclinic phase of ZrO2, which is rather “disordered” itself, give nearly identical results using the two Zr pseudopotentials. Experimentally, it is possible that the amorphous state manifests itself differently in bulk and thin-film forms. Indeed, because ZrO2 is essentially a poor glass-former, it can only be prepared in amorphous form by low-temperature deposition or in other non-equilibrium conditions, and it is therefore to be expected that the properties of such samples may vary strongly with preparation conditions. Motivated by applications, much work is now under way to explore whether chemical substitution (e.g., by addition of Si, Al, or N) may help stabilize the amorphous phase and raise its recrystallization temperature, and ultimately it will be important to extend the theory to such substitutions in the future. Nevertheless, we believe that the present computational investigation can serve as an important first step in answering some of the many open questions about the structural and chemical properties of this class of materials.
Acknowledgments
This work was supported by NSF Grant DMR-0233925. X.Z. thanks Jeff Neaton for help with the VASP software package.
REFERENCES
- [1] Present address: School of Physics, Georgia Institute of Technology, Atlanta, GA 30332.
- [2] G. D. Wilk, R. M. Wallace, and J. M. Anthony, J. Appl. Phys. 89, 5243 (2001).
- [3] E. Cartier, D. A. Buchanan, M. Gribelyuk, M. Copel, H. Okorn-Schmidt, and C. D’Emic, Microelectron. Eng. 59, 341 (2001).
- [4] X. Zhao and D. Vanderbilt, Phys. Rev. B 65, 075105 (2002).
- [5] X. Zhao and D. Vanderbilt, Phys. Rev. B. 65, 233106 (2002).
- [6] X. Zhao and D. Vanderbilt, Novel Materials and Processes for Advanced CMOS, edited by M.I. Gardner, J.-P. Maria, S. Stemmer, S. De Gendt, Proceeding of the 2002 MRS Fall Meeting, Volume 745, p. N7.2.1.
- [7] X. Zhao, S. Sayan, E. Garfunkel, and D. Vanderbilt (unpublished).
- [8] R.A. McKee, F.J. Walker, and M.F. Chisholm, Phys. Rev. Lett. 81, 3014 (1998).
- [9] R. Car and M. Parrinello, Phys. Rev. Lett. 55, 2471 (1985).
- [10] G. Kresse and J. Hafner, Phys. Rev. B 47, RC558 (1993); G. Kresse and J. Furthmüler, 54, 1169 (1996).
- [11] P. Hohenberg and W. Kohn, Phys. Rev. 136, B864 (1964).
- [12] W. Kohn and L. J. Sham, Phys. Rev. 140, A1133 (1965).
- [13] D. M. Ceperley and B. J. Alder, Phys. Rev. Lett. 45, 566 (1980).
- [14] D. Vanderbilt, Phys. Rev. B 41, 7892 (1990).
- [15] P. Pulay, Chem. Phys. Lett. 73, 393 (1980).
- [16] D. M. Wood and A. Zunger, J. Phys. A 18, 1343 (1985).
- [17] R. P. Feynman, Phys. Rev. 56, 340 (1939).
- [18] D. Levesque and L. Verlet, J. Stat. Phys. 72, 519 (1993).
- [19] S. Nosé, Molec. Phys. 52, 255 (1984); Prog. Theor. Phys. Suppl. 103, 1 (1991).
- [20] W. G. Hoover, Phys. Rev. A 31, 1695 (1985).
- [21] G. Kresse and J. Furthmüler, VASP the Guide (March 23, 2001).
- [22] X. Gonze, et al, Comp. Mat. Sci. 25, 478 (2002); also see http://www.abinit.org.
- [23] X. Gonze, Phys. Rev. B 55, 10337 (1997).
- [24] X. Gonze and C. Lee, Phys. Rev. B 55, 10355 (1997).
- [25] J. P. Perdew and Y. Wang, Phys. Rev. B 45, 13244 (1992).
- [26] M. Teter, Phys. Rev. B. 48, 5031 (1993).
- [27] T. Tanaka, T. M. Salama, T. Yamguchi, and K. Tanabe, J. Chem. Soc., Faraday Trans. 86, 467 (1990).
- [28] C. Landron, A. Douy, and D. Bazin, Phys. Status Solidi B 184, 299 (1994).
- [29] M. Winterer, J. Appl. Phys. 88, 5635 (2000).
- [30] F. Detraux, Ph. Ghosez, and X. Gonze, Phys. Rev. Lett. 81, 3297 (1998).
- [31] G.-M. Rignanese, F. Detraux, X. Gonze, and A. Pasquarello, Phys. Rev. B 64, 134301 (2001).
- [32] L. Koltunski and R. A. B. Devine, Appl. Phys. Lett. 79, 320 (2001).
- [33] J. Zhu and Z.G. Liu, Appl. Phys. A: Mater. Sci. and Proc. 78, 741 (2004).