Phonon Excitations of Composite Fermion Landau Levels
Abstract
Phonon excitations of fractional quantum Hall states at filling factors and are experimentally shown to be based on Landau level transitions of Composite Fermions. At filling factor , however, a linear field dependence of the excitation energy in the high-field regime rather hints towards a spin transition excited by the phonons. We propose to explain this surprising observation by an only partially polarized -ground-state making the energetically lower lying spin transition also allowed for phonon excitations.
pacs:
73.43.-f, 73.20.Mf, 72.10.DiThe Coulomb interaction in a two-dimensional electron system (2DES) subjected to a quantizing magnetic field leads to the formation of new, fractionally charged quasi-particles at Landau level filling factors ( is an odd-integer) FQHE1 ; FQHE2 . In the last decade this fractional quantum Hall (FQH) effect was very effectively described in the framework of Composite Fermions (CFs) Jain89 . At a fractional filling factor with even denominator, , these quasiparticles are formed by attaching an even number of flux quanta to each electron, i.e. two flux quanta at . Their effective mass is originating from the Coulomb interaction HLR93 .
The ground state of a 2DES at a fractional filling factor is a collective wave function FQHE2 with finite wave-vector collective excitations GMP ; KWJ directly accessible by e.g. Raman techniques Pinczuk88 ; Kang00 , photoluminescence Kukushkin99 or phonon absorption experiments Mellor95 ; Zeitler99 . In a simple picture these excitations originate from the level structure of CFs in an effective magnetic field, , with an effective (integer) filling factor, Jain89 . The levels can then be described as spin-split Landau levels of CFs and, therefore, excitations can be interpreted as either Landau level transitions or spin-excitations.
In this Letter we use phonons to probe the FQH excitation spectrum at filling factors = 1/3, 2/5, 4/7, 3/5, 2/3, 4/3, and 5/3 when varying the electron densities in the same sample over a wide range. At a given filling factor nearly all gaps measured show a square-root dependence on the magnetic field, strongly suggesting that we probe Landau level transitions of CFs. All these data are described by one single fit parameter related to the CF effective mass. Surprisingly, the gap at displays a linear field dependence, rather related to a spin transition forbidden for phonon excitations. This observation is a clear hint that the 2/3-ground-state is not fully spin-polarized in high -fields and that a strict separation between spin transitions and CF Landau-level transitions is no more possible.
Our sample consists of a high-mobility AlGaAs/GaAs-heterojunction grown on a 2 mm thick GaAs wafer. On the front side containing the 2DES we patterned a m wide meander extending over a total length mm on an area mm2. The huge aspect ratio maximizes the -contribution to the two-terminal resistance and thereby allows to measure smallest changes in . The Ohmic contacts to the 2DES are placed at the edges of the sample far away from the meander to avoid any phonon interactions with the contacts. We took great care that the contact resistances () only play a negligible role in the measured two-terminal resistance. Using the persistent photoconductivity we varied the electron concentration in several steps from m-2 (mobility m2/Vs) to m-2 (mobility m2/Vs).
The sample is mounted on the tail of a dilution refrigerator in a superconducting magnet with maximum fields up to 13 T and connected to high frequency coaxial cables. Great care was taken to assure a proper thermal anchoring of the cables. We achieve a 2DES temperature mK for a cryostat base temperature of 75 mK.
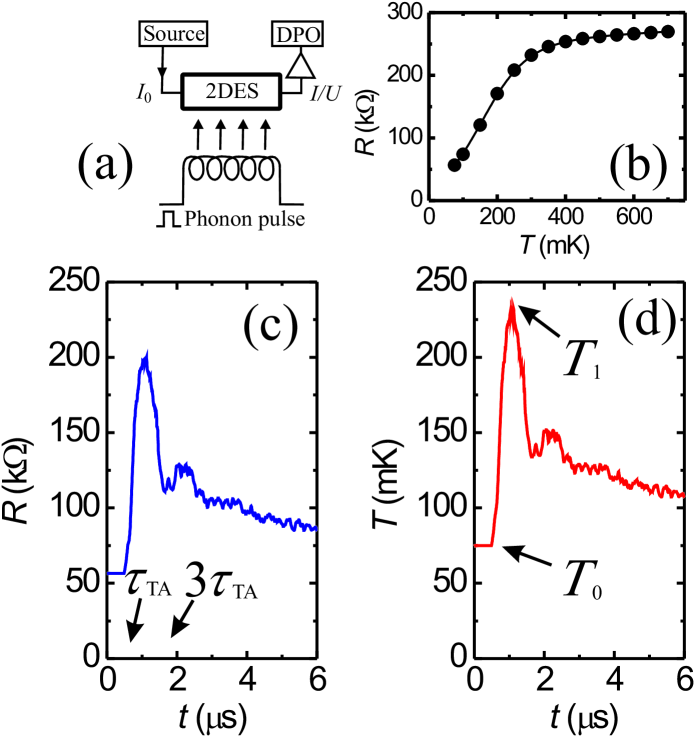
(b) Steady-state calibration of the 2DES resistance at for m-2.
(c) Phonon signal for the same and after emitting K phonons during ns at . The 2DES was excited from a base temperature mK.
(d) 2DES temperature versus time as deduced from raw phonon signal curve (c) using the calibration (b).
The experimental setup is shown schematically in Fig. 1a: A thin constantan film acting as a phonon emitter is placed on the polished back side of the sample. By passing a short current pulse during a time through this heater, non-equilibrium phonon pulses are created at the heater-GaAs interface. They are characterized by a black-body spectrum at a temperature , where is the heater area, is the power dissipated in the heater, W/m2 K4 is the acoustic mismatch constant between constantan and GaAs, and is the GaAs lattice temperature Kent96 . When entering the GaAs, the non-equilibrium phonons travel ballistically through the 2 mm-thick substrate. After a time of flight s and s for longitudinal acoustic (LA) phonons and for transverse acoustic (TA) phonons, respectively, they hit the 2DES and a small part of their energy is absorbed Schuwi02 . As a consequence, the 2DES temperature increases, directly measured by a change of its resistance. This resistance change is detected by the current change at constant voltage using a 10-MHz current amplifier and a digital phosphor oscilloscope to average over up to a few million traces.
In Fig. 1c we have plotted a characteristic signal at filling factor . Due to their strong focussing Zeitler99 mainly TA phonons are visible, with a first peak starting around s and a second due to multiply reflected phonons after . After typically 1 ms (depending on the total power dissipated inside the GaAs substrate), the sample has cooled down back to its base temperature and the experiment is repeated a few million times.
By using the temperature dependent resistance measured under equilibrium conditions (as plotted in Fig. 1b) the raw phonon signal curve can be translated into a 2DES temperature versus time. The reliability of this procedure is checked as follows: After a certain time (s), all non-equilibrium phonons induced with the heater are thermalized in the GaAs substrate and the 2DES and the substrate are in thermal equilibrium. This is experimentally measured by a merely changing 2DES temperature. This measured temperature agrees well with the theoretically expected one as deduced from the total energy dissipated in the heater, , and the specific heat of the GaAs substrate.
In order to extract quantitative data from our experiments we use a simple model to describe the phonon absorption in the 2DES. In the most general case, the differential temperature gain of the 2DES within a time interval is given by
| (1) |
, where is the 2DES’s specific heat, is the phonon energy absorbed by the 2DES with an absorption coefficient depending on the heater temperature and the 2DES temperature , and is the energy emitted by the 2DES, depending on and the equilibrium substrate temperature . In our experiments we use very short (10 ns) heater pulses with a moderate heater power . Consequently, the peak height of the first ballistic phonon signal peak is dominated by absorption and the emission term can be ignored on these short time scales.
In a first set of experiments, we calibrate the relative specific heat of the 2DES at given fractional filling factor. The maximum 2DES temperature on the first ballistic phonon peak, (see Fig. 1d), is measured as a function of the 2DES base temperature , with a fixed duration and a constant amplitude of the heater pulse. Since all the used are distinctively lower than the energy gaps at these filling factors we always deal with a situation where the quasiparticle ground states are almost full and their excitations are almost empty. As a consequence, the relative proportion of phonons absorbed is independent from , and we can approximate . Integrating Eq. (1) over the pulse length with these assumptions, we get:
| (2) |
Using the mean value theorem for this integral equation we can determine the relative specific heat of the 2DES from our set of experiments where we measured for fixed heater power and varying . As a consistency check we performed the same set of experiments with different heater powers and find a very comparable temperature dependence of .
In Fig. 2a the measured relative specific heats, , are shown exemplarily for filling factors 2/3 and 2/5. We should note that we cannot determine the absolute value of due to the unknown absorption coefficient (). The lines shown in Fig. 2a are fits to the theoretical predictions for the specific heat of a 2DES Chakraborty97 plus a small empirical constant, taking into account an additional contribution to possibly resulting from a finite (thermodynamic) density of states inside the excitation gap Zeitler99 .
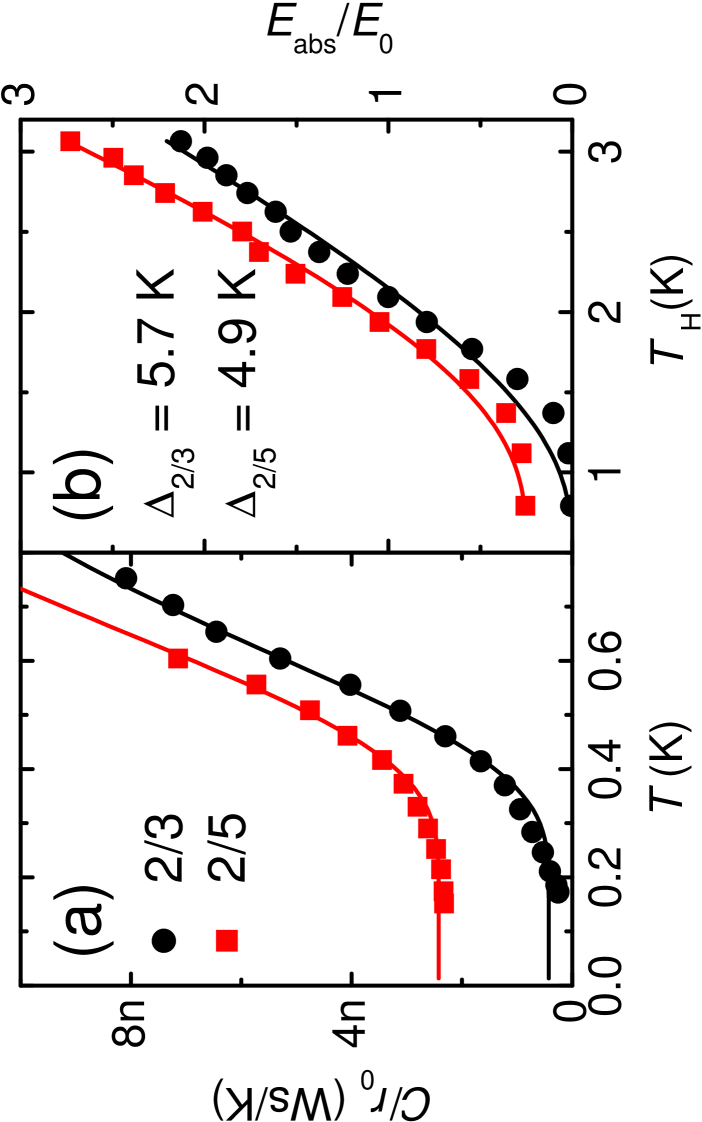
(b) Relative phonon energy absorbed by the 2DES, normalized to its value for K, for a 10 ns pulse at filling factors = 2/3 and 2/5 (Data for 2/5 are shifted by 0.25 for clarity). The curves are fits for an excitation across a gap K and K.
In a second set of phonon absorption experiments we can now determine the energy gaps at fractional filling factors. This time, the heater temperature is varied for a fixed base temperature . By increasing the number of phonons for every wavelength is increased. Since the major contribution to the phonon absorption is predominantly due to excitations around a gap , the total energy absorbed by the 2DES increases as
| (3) |
The absorbed phonon energy, , as a function of is deduced from the measured and by integrating
Eq. (1) using the previously determined specific heat.
Again, the emission term is neglected for the short time scales
considered. In Fig. 2b we show results for filling
factors 2/3 and 2/5. The gap values are obtained by
averaging over several experiments using different heater powers
and base temperatures. All the individual gaps measured are within
of the average value. The solid lines in
Fig. 2b show fits using Eq. (3) and indeed,
the experimental data match a model
with phonon excitation across a single energy gap .
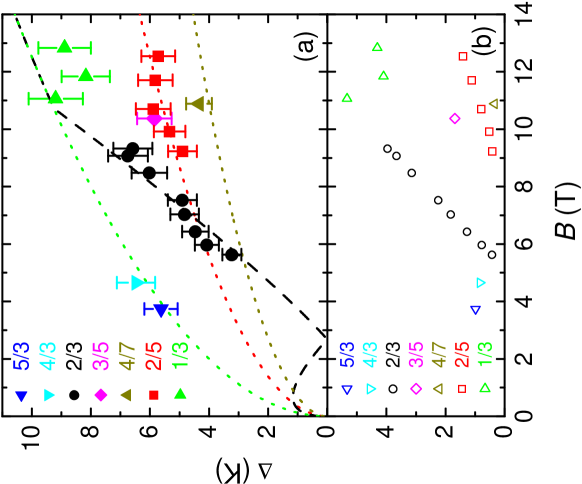
(b) The transport gaps are systematically lower then the phonon excitation gaps in (a).
Using such an elaborated series of calibrations we can now investigate in detail the excitation gaps. As listed in Table I, we have measured the gaps for eight different electron concentrations at filling factors 2/3, 2/5, and 1/3 up to the highest magnetic fields accessible in our magnet. These filling factors all showed well developed minima for all the concentrations used. Additional filling factors 4/3, 5/3, 3/5 and 2/7 are only clearly pronounced for the highest electron concentration and, accordingly, phonon gaps were only measured in sample #8 for these filling fractions.
All gaps measured at various filling factors and electron concentrations are compiled in Fig. 3a. For comparison, we also show the energy gaps deduced from activated transport measurements schuwiPRL in Fig. 3b. In order to discuss these results for different filling factors we describe them within the CF picture Jain89 , where the FQH filling factors are mapped to integer CF filling factors . The energy levels for filled CF Landau levels can then be written Mariani02 as:
| (4) |
Here the CF cyclotron energy is given purely by the Coulomb interaction and thus follows the form with a CF mass Park98 .
Since phonons carry no spin we expect that, in a phonon absorption experiment, the lowest lying excitations of a CF state are Landau level transitions from to +1 with the same spin . The corresponding energy gap can now be adjusted to our data by one single dimensionless mass parameter . In Fig. 3 the fits of such Landau level transitions to all the data at 1/3, 2/5, 4/7, 3/5, 4/3, and 5/3 are shown yielding (dotted lines). Here, and are treated as 1/3 respectively 2/3 plus one inert fully occupied Landau level. The experimentally determined CF mass parameter is in astonishing agreement with the theoretical predictions in Eq. (1) of Ref. Park98, .
| sample | [K] for | ||||
|---|---|---|---|---|---|
| # | [1015 m-2] | [m2/Vs] | |||
| 1 | 0.89 | 102 | 3.2 | 4.9 | 9.2 |
| 2 | 0.95 | 109 | 4.1 | 5.3 | 8.2 |
| 3 | 1.03 | 119 | 4.5 | 5.9 | 8.9 |
| 4 | 1.13 | 131 | 4.8 | 5.8 | — |
| 5 | 1.21 | 144 | 4.9 | 5.7 | — |
| 6 | 1.36 | 168 | 6.0 | — | — |
| 7 | 1.46 | 187 | 6.7 | — | — |
| 8 | 1.50 | 193 | 6.6 | — | — |
Compared to all phonon gaps measured at the above mentioned filling factors, the phonon absorption data at filling factor 2/3, are distinctly different: The measured excitation gaps can in no way be described with the square-root dependence of CF Landau level excitations. They rather show a linear dependence, , strongly suggesting that they are related to a spin gap, which is normally not directly accessible by phonon excitations. Here T is the field where the 2/3 state changes from a spin-unpolarized to a spin-polarized state. Indeed, when we quantitatively compare the expected field dependence of the spin gap with our data we find a remarkable agreement (dashed line in Fig. 3a). This interpretation is also supported by the transport gaps measured at which have the same linear behavior, reduced by a constant due to disorder as seen in Fig. 3b. All other transport gaps are also systematically lower than the phonon excitation gaps due to disorder effects and because temperature can also couple to spin flip excitations.
The fact that we observe spin-related excitation gaps with phonons indicates that the state can not be described with independent spin and Landau level indexes. This supposition is also supported by recent theoretical Apalkov01 and experimental Freytag01 evidence suggesting that state is not fully polarized, even in high magnetic fields. As a result, we may speculate that the complexity of the 2/3 state is responsible for the appearance of a spin-forbidden transition in the phonon absorbtion.
In conclusion, we have measured phonon excitation gaps in the FQH regime for filling factors 1/3, 2/5, 4/7, 3/5, 2/3, 4/3, and 5/3 for eight different electron densities. For all filling factors besides the measured gaps can be well described in the framework of Landau level transitions of CF involving no spin flip. The gaps measured at , however, correspond to a normally forbidden spin transition, pointing towards a complex not fully polarized ground state.
We acknowledge financial support by BMBF and DFG priority program “quantum Hall systems”.
References
- (1) D. C. Tsui, H. L. Stormer, and A. C. Gossard, Phys. Rev. Lett. 48, 1559 (1982); H. L. Stormer, D. C. Tsui, and A. C. Gossard, Rev. Mod. Phys. 71, S298 (1999).
- (2) R. B. Laughlin, Phys. Rev. Lett. 50, 1395 (1983). Rev. Mod. Phys. 71, 863 (1999).
- (3) J. K. Jain, Phys. Rev. Lett. 63, 199 (1989).
- (4) B. I. Halperin, P. A. Lee, and N. Read, Phys. Rev. B 47, 7312 (1993).
- (5) S. M. Girvin, A. H. MacDonald, and P. M. Platzman, Phys. Rev. Lett 54, 581 (1985); Phys. Rev. B 33, 2481 (1986).
- (6) R. K. Kamilla, X. G. Wu, and J. K. Jain, Phys. Rev. Lett 76, 1332 (1996); Phys. Rev. B 54, 4873 (1996).
- (7) A. Pinczuk, J. P. Valladares, D. Heiman, A. C. Gossard, J. H. English, C. W. Tu, L. Pfeiffer, and K. West, Phys. Rev. Lett 61, 2701 (1988).
- (8) Moonsoo Kang, A. Pinczuk, B. S. Dennis, M. A. Eriksson, L. N. Pfeiffer, and K. W. West, Phys. Rev. Lett 84, 546 (2000).
- (9) I. V. Kukushkin, K. v. Klitzing, and K. Eberl, Phys. Rev. Lett. 82, 3665 (1999).
- (10) C. J. Mellor, R. H. Eyles, J. E. Digby, A. J. Kent, K. A. Benedict, L. J. Challis, M. Henini, C. T. Foxon, and J. J. Harris, Phys. Rev. Lett. 74, 2339 (1995).
- (11) U. Zeitler, A. M. Devitt, J. E. Digby, C. J. Mellor, A. J. Kent, K. A. Benedict, and T. Cheng, Phys. Rev. Lett. 82, 5333 (1999).
- (12) A. J. Kent, R. E. Strickland, K. R. Strickland, and M. Henini, Phys. Rev. B 54, 2019 (1996).
- (13) F. Schulze-Wischeler, U. Zeitler, F. Hohls, R. J. Haug, D. Reuter, and A. D. Wieck, Physica E 12, 474 (2002).
- (14) T. Chakraborty and P. Pietiläinen, Phys. Rev. B 55, R1954 (1997).
- (15) E. Mariani, R. Mazzarello, M. Sassetti, and B. Kramer, Ann. Phys. (Leipzig) 11, 926 (2002).
- (16) K. Park and J. K. Jain, Phys. Rev. Lett 80, 4237 (1998).
- (17) F. Schulze-Wischeler, E. Mariani, F. Hohls, and R. J. Haug, Phys. Rev. Lett 92, 156401 (2004).
- (18) V. M. Apalkov, T. Chakraborty, P. Pietiläinen, and K. Niemelä, Phys. Rev. Lett 86, 1311 (2001).
- (19) N. Freytag, Y. Tokunaga, M. Horvatić, C. Berthier, M. Shayegan, and L. P. Lévy, Phys. Rev. Lett 87, 136801 (2001).