Optical properties of pyrochlore oxide
Abstract
We present optical conductivity spectra for single crystal at different temperatures. Among reported pyrochlore ruthenates, this compound exhibits metallic behavior in a wide temperature range and has the least resistivity. At low frequencies, the optical spectra show typical Drude responses, but with a knee feature around 1000 cm-1 . Above 20000 cm-1 , a broad absorption feature is observed. Our analysis suggests that the low frequency responses can be understood from two Drude components arising from the partially filled Ru bands with different plasma frequencies and scattering rates. The high frequency broad absorption may be contributed by two interband transitions: from occupied Ru states to empty bands and from the fully filled O 2p bands to unoccupied Ru states.
pacs:
78.20.-e, 78.30.-i, 72.80.GaPyrochlore compounds with general formula are face-centered-cubic oxides with space group (A and B are cations). While B cation is six-fold coordinated and locates at the center of the distorted octahedra formed by corner O ions denoted as O(1), A cation is eight-fold coordinated with six O(1) and two other oxygen ions O(2). The octahedra are corner-sharing and compose a three-dimensional tetrahedral network, namely, the pyrochlore lattice. Intensive investigations of pyrochlore oxides have revealed a remarkable range of interesting and complex phenomena including colossal magnetoresistive effect, heavy Fermion behavior, superconductivity, spin ice, spin glass and metal-insulator transition by selecting different A and B cations. Among those phenomena, the metal-insulator(MI) transition of ruthenates (B = Ru) is unexpected and has thus attracted much attention Ishii ; Subra ; Takeda ; Kobayashi ; Yoshii ; Kennedy ; Lee ; Cox .
In general, the electron correlation degree of 4d materials is smaller than that of 3d materials and is thought to be within the intermediate-coupling regime. For pyrochlore ruthenates, , the electrical properties show systematic change from a Mott insulator to a metal depending on A cation. For example, is an insulator Subra ; exhibits a metal-insulator transition at 120 K,Takeda accompanied with a structural change from cubic to orthorhombic symmetry. Both Kobayashi and Yoshii remain metallic electrical properties from room temperature to lowest measured temperature. It is found that metallic has a greater Ru-O-Ru bond angle than those of insulating compoundsKennedy2 . The angle is affected by A cation. There are two possible roles of A cation: (1) modifing the Ru 4d band width through the change of Ru-O-Ru bond angleCox , and (2) contributing some states to the total states near the Fermi level Ishii ; Kennedy .
Optical spectroscopy is a powerful tool to probe the electronic structure and charge dynamics of a material. Several optical measurements have been performed on compounds, which yield information about the effect of cations on electronic structure. For , a peak-like feature in the mid-infrared (IR) region was observed in the optical conductivity spectraLee , which shifts to low frequencies with decreasing temperature. For , the mid-IR feature moves to low frequency region further and overlaps with a sharp Drude component. In contrast, no mid-IR feature was observed in optical spectra of insulator . Thus, it appears that the mid-IR feature is related to metallic nature of . However, the origin of the mid-IR peak remains unclear. For , the mid-IR peak is attributed to the interband transition between the lower Hubbard band(LHB) of Ru 4d energy level and the newly formed midgap state near the Fermi level caused by self-doping from to Lee . For , the electron-electron correlation is quite weak and its energy level could not split into LHB and UHB bandsLee2 . One may thus search for an alternative interpretation for metallic .
is also a Pauli paramagnetic metal in the whole measured temperature rangeKobayashi . Among reported pyrochlore ruthenates, this compound has the least resistivity. Its resistivity decreases significantly with decreasing temperature, whereas the resistivity of keeps about 600 in the temperature range between 10 to 300 K.Yoshii High-resolution electron-energy-loss spectroscopy(HREELS) analysis Cox shows that the density of states (DOS) at of is higher than that of . All the above experimental phenomena imply that is a better metal than . In this work, we report the optical conductivity spectra of single crystal at different temperatures. At low frequencies, the optical spectra show typical Drude responses, but with a knee feature around 1000 cm-1 . Above 20000 cm-1 , a broad absorption feature is observed. Our analysis suggests that the low-frequency responses may be understood from two Drude components arising from the partially filled Ru bands with different plasma frequencies and scattering rates. The high-frequency broad absorption may be due to interband transitions from occupied Ru states to empty bands and from the occupied O 2p states to unoccupied Ru bands.
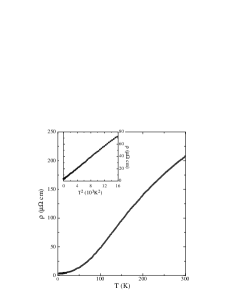
Single crystals of were grown using a vapor transport method described in detail elsewhere.Jin The temperature dependent resistivity measured by standard four probe method is shown in Fig. 1, which indicates a typical metallic behavior. The resistivity values are lower than the reported data,Kobayashi reflecting high quality of the crystal. We have measured the frequency dependent reflectivity R() from 50 cm-1 to 30000 cm-1 at different temperatures. The measurements were performed on a Bruker 66v/s spectrometer with a He flowing cryostat. An in-situ overcoating technique is used for the reflectance measurement.Homes Standard Kramers-Kronig transformations are employed to derive the frequency-dependent optical conductivity.
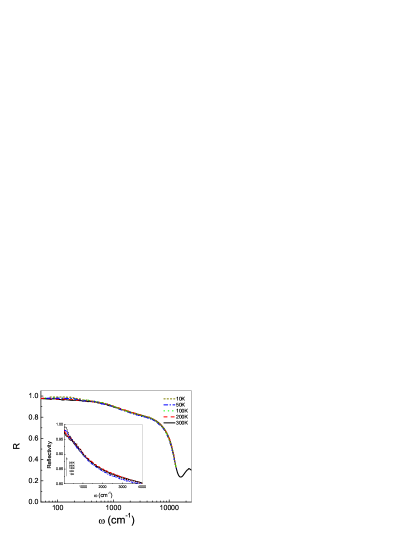
Plotted in Fig. 2 is the reflectivity spectra at various temperatures. In low-frequency region, the reflectivity ) slightly increases with decreasing temperature. At higher but below frequency region, the reflectivity slightly decreases with decreasing temperature. ) at different temperatures cross between 1000 cm-1 and 2000 cm-1 . A plasma edge minimum can be seen at frequency close to .
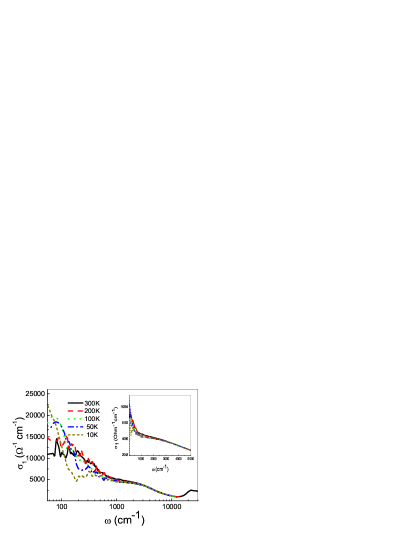
Fig. 3 is a collection of the real part of the optical conductivity between 10 and 300 K. In the high frequency side, there is a broad interband transition peak at about . Peaks at similar energies have been observed in and , and were attributed to the interband transition from filled O 2p band to unoccupied Ru 4d band. Since the transition from occupied band to empty Ru band is also close to this energyHsu , this broad feature may compose of both interband transitions. Below , shows a Drude-like response, but with a knee feature near 1000 cm-1 . Its spectra weight at about 1000 cm-1 decreases slightly when temperature decreases. In Lee3 , similar absorbtion feature at 292K is observed too, which is considered as a mid-IR peak of interband transition inherited from .
The sum of the optical conductivity spectral weight gives a measure of the effective carrier number
of :
| (1) |
in which m is the bare electron mass, is the ratio of the effective mass to free electron mass, N is the number of Ru ions per unit volume and is a cutoff frequency. Assuming that (about ) as for Lee , we get . This value is considerably higher than that of . That is consistent with the fact that is more metallic than .
In optical conductivity spectra of , there is a mid-IR peak centering at . Lee Band structure calculations Ishii show that, antibonding states of Tl 6s and O(2) 2p lie in the energy range from -1eV to 2eV and partly hybridize with the Ru 4d ()-O(1) 2p antibonding states. That will lead to net charge transfer from chain to the net-work of octahedra. Such a charge transfer effect will generate some midgap states within the gap between up Hubbard band(UHB) and low Hubbard band(LHB). Lee ; Meinders . When the midgap states lie above and close to LHB, an interband transition between LHB and those midgap states is possible. Then a Lorentz-like peak appears in the optical conductivity spectra. The previous explanation of the mid-IR absorption feature seen in is on the similar basis, although it is considered that such self-doped state would be higher in metallic than that in Lee3 .
For , both the dc resistivity (see Fig.1) and the deduced from our optical conductivity spectra show that it is a much better metal than . Band calculations also show that the band structures of and around are quite different from that of due to different Ru-O-Ru angles and different ways of participation of A-cation orbits. The Ru-O-Ru angles in and are larger than that in , leading to wider bandwidth of Ru 4d band for and by changing the corresponding hopping integrals. Since partial Bi and Pb 6p states situate near and mix well with Ru states around , the conducting electrons in and are more itinerant than that in . Therefore, the on-site Coulomb interaction is relatively weak and the Hubbard bands merge into a single oneLee2 . In this case, the knee feature around 1000 cm-1 may not be attributed to the interband transition between LHB and the midgap states for .
We note that the mid-IR feature for has its central frequency at zero, suggesting a Drude characteristic. Then we may consider the low frequency part of the optical conductivity of as a sum of two kinds of intraband transitions, i.e.,
| (2) |
where and are the plasma frequencies, and are relaxation rates of the free charge carriers. We find that this function can well reproduce all the spectral data at all temperatures we have measured. The fitting parameters are listed in table.I.
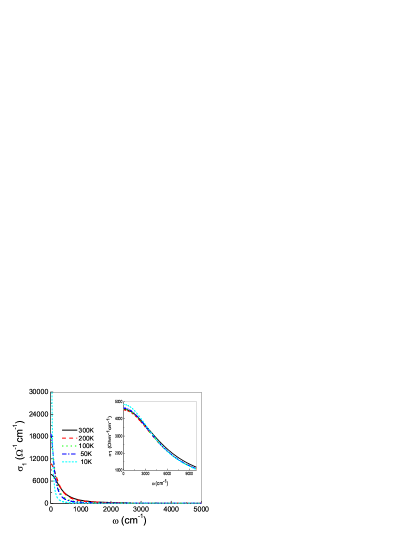
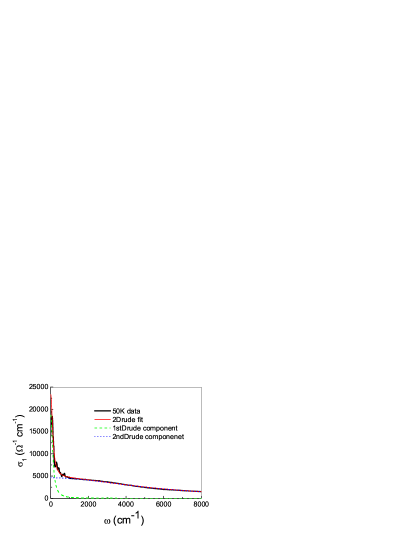
Fig. 4 is the fitting result for spectral data at 50 K, where the thick solid line is the experimental data, the thin line is a fitting curve using function(2), the dashed line is the first Drude term and the dotted line is the second Drude term.
Presented in Fig. 5 is a plot of the fitting curves of the first Drude term at different temperatures. The inset displays those of second Drude term. Both of them show usual narrowings with decreasing temperature. Our fitting results imply that two kinds of conducting charge carriers with different lifetimes have taken part in the intraband excitations, and have different temperature dependencies. The carriers with smaller value have stronger temperature dependence, while another one is much weaker. The cooperation of the two different temperature-dependent behaviors leads to the decrease of the spectral weight around in the optical conductivity spectra with decreasing temperature.
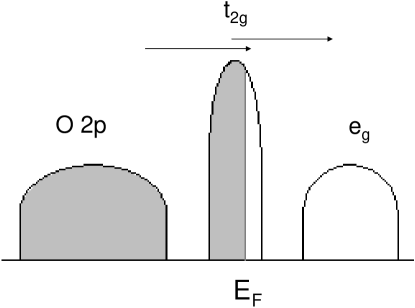
Our analysis is well consistent with the band-structure calculation results.Hsu As displayed in Fig. 6, the fivefold degenerate Ru 4d levels are split, due to the octahedral crystal field, into an unoccupied band which locate at above EF, and a partially occupied band between -1 and 1 eV. This band is broadened by mixing with some Pb 6p states. The O 2p bands locate between -7.5 eV and -2 eV.Hsu The broad feature at high frequencies (above ) is contributed by two possible interband transitions with similar energy scales: from the occupied Ru bands to empty bands and from the filled O 2p states to unoccupied Ru states. The low frequency part below the conductivity minimum is due to the intraband excitations of the two partially filled Ru bands. The existence of A-cation orbital near actually leads to different band dispersions of the Ru bands.
This work is in part supported by National Science Foundation of China and Wang-Kuan-Cheng Foundation for research collaboration (R.J.). Oak Ridge National Laboratory is managed by UT-Battelle, LLC, for the U.S. Department of Energy under contract DE-AC05-00OR22725.
References
- (1) F. Ishii and T. Oguchi, J. Phys. Soc. Jpn. 69, 526 (2000).
- (2) M. A. Subramanian, G. Aravamudan and G. V. Subba Rao, Pro. Solid State Chem. 15, 55 (1983).
- (3) T. Takeda, M. Nagata, H. Kobayashi, R. Kanno, Y. Kawamoto, M. Takano, T. Kamiyama, F. Izumi and A. W. Sleight, J. Solid State Chem. 140, 55 (1998).
- (4) H. Kobayashi, R. Kanno, Y. Kawamoto, T. Kamiyama, F. Izumi and A. W. Sleight, J. Solid State Chem. 114, 15 (1995).
- (5) S. Yoshii and M. Sato, J. Phys. Soc. Jpn. 68, 3034 (1999).
- (6) B. J. Kennedy, Physica B 241-243, 303 (1998).
- (7) J. S. Lee, Y. S. Lee, K. W. Kim, T. W. Noh, Jaejun Yu, T. Takeda and R. Kanno, Phys. Rev. B 64, 165108 (2001).
- (8) P. A. Cox, R. G. Egdell, J. B. Goodenough, A. Hamnett and C. C. Naish, J. Phys.: Solid State Phys. 16, 6221 (1983).
- (9) B. J. Kennedy and T. Vogt, J. Solid State Chem. 126, 261 (1996).
- (10) J. S. Lee , Y. S. Lee, T. W. Noh, K. Char, Jonghyurk Park, S. -J. Oh,J. -H. Park, C. B. Eom, T. Takeda and R. Kanno, Phys. Rev. B 64, 245107 (2001).
- (11) R. Jin and D. Mandrus, unpublished.
- (12) C. C. Homes, M. Reedyk, D. A. Crandles, and T. Timusk, Appl. Opt. 32, 2973 (1993)
- (13) William Y. Hsu, Robert V. Kasowski, Thomas Miller and Tai-Chang Chiang, Appl. Phys. Lett. 52, 792 (1988).
- (14) J. S. Lee, Y. S. Lee, K. W. Kim, T. W. Noh, J. Yu, Y. Takeda and R. Kannoo, Physica C 364-365, 632 (2001).
- (15) M. B. J. Meinders, H. Eskes and G. A. Sawatzky, Phys. Rev. B 48, 3916 (1993).