Velocity Profiles in Slowly Sheared Bubble Rafts
Abstract
Measurements of average velocity profiles in a bubble raft subjected to slow, steady-shear demonstrate the coexistence between a flowing state and a jammed state similar to that observed for three-dimensional foams and emulsions [Coussot et al,, Phys. Rev. Lett. 88, 218301 (2002)]. For sufficiently slow shear, the flow is generated by nonlinear topological rearrangements. We report on the connection between this short-time motion of the bubbles and the long-time averages. We find that velocity profiles for individual rearrangement events fluctuate, but a smooth, average velocity is reached after averaging over only a relatively few events.
pacs:
83.80.Iz,83.60.La,64.70.DvA proposed jamming phase diagram Liu and Nagel (1998), which treats applied stress in a manner analogous to temperature and density, offers an interesting framework for the study of a wide range of systems subjected to shear Liu and Nagel (2001). The jamming phase diagram proposes the existence of a new state of matter, the “jammed state”, and suggests that similar transitions to this state would occur as a function of applied stress, temperature, or density. For example, many complex fluids, such as emulsions, foams, and granular materials, exhibit a yield stress below which the material does not flow, or jams. As one approaches the yield stress from above, the viscosity diverges. This is analogous to the behavior of the viscosity in the glass transition. Experiments have confirmed the applicability of the jamming phase diagram in certain colloidal systems Trappe et al. (2001). These are examples of continuous jamming transitions.
Recent work in a range of soft materials, including colloids, granular matter, foams, and emulsions, suggest that the jamming transition can be discontinuous Coussot et al. (2002); Cruz et al. (2002). The materials exhibited a yield stress. Yet, under conditions of steady shear flow, there existed a critical radius at which the shear-rate was discontinuous and a transition from a flowing to a jammed state occurred Coussot et al. (2002). This is in contrast to the results of most stress versus rate of strain measurements for materials with a yield stress. Such experiments suggest the stress is well-modelled as a continuous function of shear-rate, such as with a Herschel-Bulkley model Bird et al. (1977). Additional evidence for the discontinuous transition is given by the observation of a bifurcation in the material’s viscosity during constant stress experiments Cruz et al. (2002).
In addition to the connection with the jamming transition, the coexistence of a flowing and jammed state is one example of another feature of some jammed systems: shear localization Howell et al. (1999); Mueth et al. (2000); Losert et al. (2000); Debrégeas et al. (2001); Bocquet et al. (2001); Salmon et al. (2003). In general, shear localization (or banding) refers to a flow state which is spatially separated into a regions of different shear rates. For wormlike micelles, shear banding has been observed in which there is a discontinuous transition from a high shear rate region to a low shear rate region Salmon et al. (2003). Experiments in granular systems Howell et al. (1999); Mueth et al. (2000); Losert et al. (2000); Bocquet et al. (2001) and confined foam Debrégeas et al. (2001) report a type of shear localization in which the velocity profile is exponential. In these cases, the shear rate is continuous, though the system is effectively divided into high shear rate and zero shear rate regions. Simulations of Lennard-Jones particles Varnik et al. (2003) and quasi-static foam Kabla and Debrégeas (2003) confirm that shear localization can occur independent of the existence of a yield stress. In the case of quasi-static foam, the simulations suggest that a key element is the localization of slip events Kabla and Debrégeas (2003). Understanding the different sources of shear-localization will contribute to a better understanding of the jamming phase diagram.
In this Letter, we confirm the coexistence between a flowing and a jammed state for slow, steady shear of a bubble raft. By considering the behavior on relatively short time scales, we show the connection between fluctuations that occur in the stress and the nonlinear flow events that comprise the unjammed state. This provides insight into the connection between the individual bubble motions and the observed average flow properties. The average stress versus rate of strain curves have been measured separately Pratt and Dennin (2003). These curves are consistent with a Herschel-Bulkley model for the system. However, in light of the velocity measurements reported here, it is important to reconsider the interpretation of those results.
A bubble raft consists of a single layer of bubbles floating on a fluid surface Argon and Kuo (1979). Our bubble raft is described in detail in Ref. Lauridsen et al. (2002). A random distribution of bubble sizes was used, with an average radius of . The Couette viscometer is described in detail in Ref. Ghaskadvi and Dennin (1998). To shear the foam, an outer Teflon barrier is rotated at a constant angular velocity. We measure the azimuthal velocity, . The shear rate is given by Bird et al. (1977). Therefore, we considered the normalized angular velocity, , where the jammed state is , or . The stress, , on the inner cylinder was monitored by measuring the torque, , on the inner cylinder: . The inner cylinder was supported by a torsion wire (torsion constant ), and was determined from the angular position of the inner cylinder. Therefore, the inner cylinder had an instantaneous angular speed, even though its average angular speed is zero. At both boundaries, the first layer of bubbles was never observed to slip relative to the boundary. This feature combined with the finite size of bubbles set the effective inner () and outer () radii. We report results for two rotation rates of the outer cylinder, and , which corresponds to shear rates (at ): and .
The versus behavior was measured separately and is reported elsewhere Pratt and Dennin (2003). It is consistent with a Herschel-Bulkley form for the viscosity: , with , and . For , the was essentially independent of shear rate, though it fluctuated between and Pratt and Dennin (2003). Both shear rates reported on here are within this quasi-static limit. The gas area-fraction was 0.95. As the bubbles are actually three-dimensional, we used an operational definition of gas area-fraction: the ratio of area inside bubbles to the total area of the bubble raft in a digitized image.
The fluid substrate (subphase) is driven at the same time as the bubbles Ghaskadvi and Dennin (1998). Tests were made with bubble rafts that did not touch the outer barrier. Under rotation of the outer barrier, no motion of the bubbles was detected, ruling out driving by the subphase. In addition, because the subphase is sheared with the bubbles, the bubbles and subphase have similar velocities during most of the motion. This minimizes any viscous dissipation between bubbles and water. Also, the effective internal viscosity of the bubble raft is 300 to 2500 g/cm s for the range of studied. This is a factor of to greater than the viscosity of the subphase. This ratio ensures that dissipation between bubbles dominates dissipation from the subphase-bubble interactions.
Bubble velocities were measured from taped video images that were digitized in the computer. For , the time between digitized images was 3.2 s/image, and for , it was 2.0 s/image. An image processing routine based on standard National Instruments LabwindowsTM/CVI functions detected and tracked individual bubbles. The velocity was calculated using the total displacement of 10 digitized images. This allowed tracking of the rapidly moving bubbles from image to image (short time between individual images) and sufficient total time to measure bubbles as slow as for and for . Finally, the bubbles within each of 24 equally spaced radial bands in the range were averaged to compute .
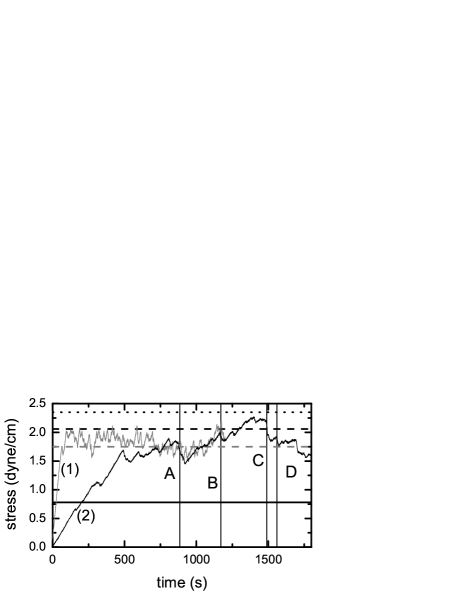
Figure 1 is a plot of versus time for the velocity data reported on here. The initial elastic regime consists of a linear increase of with time. The subsequent “flowing” regime is dominated by irregular variations in the stress characteristic of the slow shear-rate “flow” of many jammed systems Liu and Nagel (2001). For comparison with the flow data presented later, the solid line in Fig. 1 represents (the “yield stress”) based on the fit of to a Herschel-Bulkley model Pratt and Dennin (2003). (Given the existence of a discontinuous transition, such a definition of a yield stress may not be meaningful.) For each data set, the dashed line represents the value of such that , assuming Bird et al. (1977). ( is the radius at which the system jams, see Fig. 2). The dotted line is such that .
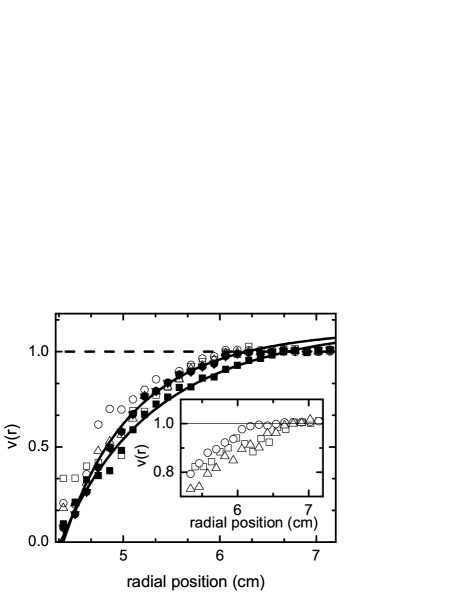
Figure 2 shows versus for for a number of different averages. In each case, the average is computed using bubbles from roughly of the system. The solid circles represent an average over , starting after the initiation of shear. This corresponds to approximately 2800 individual velocities per channel. Defining an event as a consecutive period of stress increase and decrease, the other curves are averaged over a single event (), four events (), 10 events (), and 20 events (), respectively. The 10 event average is in reasonable agreement with average, and the 20 event average (400 s) is indistinguishable from the average. Figure 2 also shows versus for . The average covered a total time of , starting after the initiation of shear. This corresponds to approximately 2000 individual velocities per channel and on the order of 50 events.
To find and , the average velocity is fit to (solid curves) over the range . This is the velocity profile for a power-law fluid () in a Couette geometry Bird et al. (1977). A number of aspects of this fit differ from the expected solution for a Herschel-Bulkley fluid. First, there is a discontinuity in . This is highlighted by the insert in Fig. 2. Here data is shown for three rotation rates, , , and . (For , there are only approximately 10 events. Based on the results for , this is sufficient to confirm the discontinuity.) Quantitatively, the crossing of the fit to a power-law velocity profile and defines the critical radius, , and critical shear rate, . For , , and . For , , and . Unlike in some foam experiments Rodts et al. (2003), the critical shear rate differs for the two speeds. Second, the fits give for and for . For the faster rotation rate, the exponent is in agreement with the exponent in the Herschel-Bulkley fit to the stress Pratt and Dennin (2003) and velocity profiles measured at higher shear rates Lauridsen et al. (2002). However, the measured exponent is different for the two rotation rates, as seen in other systems Coussot et al. (2002).
The trend for average is opposite the expectation for a Herschel-Bulkley fluid, where a continuous decrease in results in a continuous decrease in . It is consistent with the measured behavior of in the quasi-static regime. For , the system spends more time at a higher value of stress (see Fig. 1), and is larger. This is also different then trends reported in Ref. Coussot et al. (2002) and Rodts et al. (2003). for higher shear-rates in the “continuum” regime. This difference is not surprising given that the behavior in the continuum regime is “smoother” than in the quasi-static, or “discrete”, regime in which we worked.
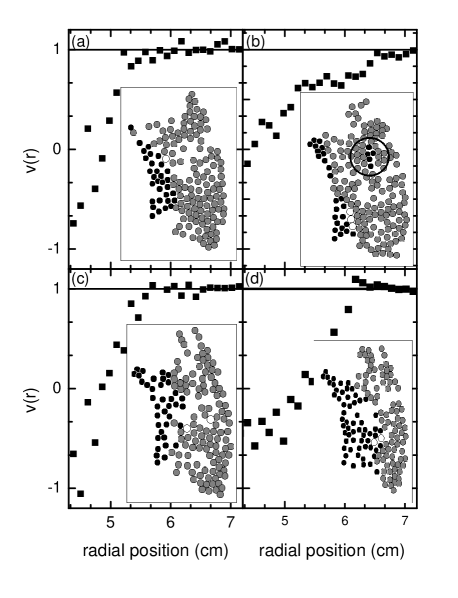
Figure 3 highlights the importance of considering short-time velocity profiles, in addition to the average quantities. In Fig. 3, plots of velocity profiles averaged over a single stress drop and corresponding snapshots of the bubble motions are shown. The stress drops corresponding to Figs. 3(a)-(d) are indicated by vertical lines in Fig. 1, labelled with corresponding letters. Here, the shear-rate discontinuity is more apparent. The individual velocity profiles are highly nonlinear and not consistent with a simple continuum model for viscosity. As expected (the transition point to elastic flow) fluctuates. However, these fluctuations are not consistent with the continuum expectation of that predicts , with Bird et al. (1977). For such a model, stress drop (C) would have the largest value of given its value of . However, is greater for both (D) and (B). This behavior is indicative of stress chains, or other nonuniform stress distributions, existing in the foam, similar to those observed for granular disks in two-dimensions Howell et al. (1999).
Snapshots of the selected bubble motions are presented as inserts in Fig. 3. The images are color coded so that bubbles moving opposite the outer cylinder are black, gray bubbles are moving in the direction of rotation, and white bubbles have . The row of bubbles at each boundary is not shown. The snapshots confirm that is connected to bubble rearrangements. Both (B) and (D) have the largest and radial position at which negative velocities are observed (see circled region in Fig. 3b).
In summary, we have observed the coexistence of a jammed and a flowing state in a bubble raft in the quasi-static shear limit, as has been observed for other soft matter systems at higher shear-rates Coussot et al. (2002). For the average velocity profiles, the transition appears to be discontinuous and occurs at a critical radius set by the yield stress. These are two ways that the average profiles for the bubble raft differ from observed exponential shear-localization in confined, two-dimensional foam Debrégeas et al. (2001) and granular systems Howell et al. (1999); Mueth et al. (2000); Losert et al. (2000); Bocquet et al. (2001). For these systems, the critical radius is significantly smaller and the shear-rate is continuous. At this point, the reasons for the differences are not clear, though one potential candidate is the role of viscous dissipation. For the confined foam, simulations suggest that the exponential velocity profile observed is due to localization of the nonlinear rearrangements Kabla and Debrégeas (2003). These simulations do not include viscous dissipation Kabla and Debrégeas (2003). Because this localization is not observed in the bubble raft (see Fig. 3, especially event C and D), there may exist differences in the role of viscous dissipation in the bubble raft and the confined foam. Another potential difference is the yield strain, which is quite large in the bubble raft system Lauridsen et al. (2002). This could impact the distribution of rearrangement events. The results of Fig. 3 point to the need to understand the velocity profiles during individual events in order to resolve these outstanding issues regarding the average behavior.
The results presented in Fig. 3 raise two important questions. First, given the highly nonlinear and fluctuating character of the velocities during individual events (see Fig. 3), why does the average velocity converge to a smooth curve after averaging over only 20 such events (and even fewer)? Second, what sets the critical radius for the individual events (Fig. 3) and how is the distribution of for these events related to the value of found for the long-time averages (Fig. 2)? The determination of the critical radius is particularly interesting given the results presented in Fig. 3 and the work in other systems. Unlike the work in the continuum limit Coussot et al. (2002), does not appear to be set by a critical shear rate either for the average profiles (see Fig. 2) or the short-time profiles. In fact, the concept of shear rate is not well-defined for the motion during individual events, and yet each event has a well-defined value of . For individual events, more work is needed to understand the connection between stress and . However, is clearly not set by the stress on the inner boundary, suggesting the need to understand the stress distribution within the bubble raft. Finally, understanding the connection between the individual and average quantities is necessary to resolve the apparent discrepancy between versus measurements that suggest a continuous transition and the discontinuous velocity profiles presented here. This is necessary for deeper insight into the implications of the jamming phase diagram for slow, steady-shear.
Acknowledgements.
This work was supported by Department of Energy grant DE-FG02-03ED46071, the Research Corporation and Alfred P. Sloan Foundation. J. Lauridsen thanks UROP for additional funding for this work. The authors thank Corey O’Hern and Phillipe Coussot for useful discussions.References
- Liu and Nagel (1998) A. J. Liu and S. R. Nagel, Nature 396, 21 (1998).
- Liu and Nagel (2001) A. J. Liu and S. R. Nagel, eds., Jamming and Rheology: Constrained Dynamics on Microscopic and Macroscopic Scales (Taylor and Francis, New York, 2001).
- Trappe et al. (2001) V. Trappe, V. Prasad, L. Cipelletti, P. N. Segre, and D. A. Weitz, Nature 411, 772 (2001).
- Coussot et al. (2002) P. Coussot, J. S. Raynaud, F. Bertrand, P. Moucheront, J. P. Guilbaud, and H. T. Huynh, Phys. Rev. Lett. 88, 218301 (2002).
- Cruz et al. (2002) F. D. Cruz, F. Chevoir, D. Bonn, and P. Coussot, Phys. Rev. E 66, 051305 (2002).
- Bird et al. (1977) R. B. Bird, R. C. Armstrong, and O. Hassuage, Dynamics of Polymer Liquids (Wiley, New York, 1977).
- Howell et al. (1999) D. Howell, R. P. Behringer, and C. Veje, Phys. Rev. Lett. 82, 5241 (1999).
- Mueth et al. (2000) D. M. Mueth, G. F. Debregeas, G. S. Karczmar, P. J. Eng, S. R. Nagel, and H. M. Jaeger, Nature 406, 385 (2000).
- Losert et al. (2000) W. Losert, L. Bocquet, T. C. Lubensky, and J. P. Gollub, Phys. Rev. Lett. 85, 1428 (2000).
- Debrégeas et al. (2001) G. Debrégeas, H. Tabuteau, and J. M. di Meglio, Phys. Rev. Lett. 87, 178305 (2001).
- Bocquet et al. (2001) L. Bocquet, W. Losert, D. Schalk, T. C. Lubensky, and J. P. Gollub, Phys. Rev. E 65, 011307 (2001).
- Salmon et al. (2003) J.-B. Salmon, A. Colin, S. Manneville, and F. Molino, Phys. Rev. Lett. 90, 228303 (2003).
- Varnik et al. (2003) F. Varnik, L. Bocquet, J.-L. Barrat, and L. Berthier, Phys. Rev. Lett. 90, 095702 (2003).
- Kabla and Debrégeas (2003) A. Kabla and G. Debrégeas, Phys. Rev. Lett. 90, 258303 (2003).
- Pratt and Dennin (2003) E. Pratt and M. Dennin, Phys. Rev. E 67, 051402 (2003).
- Argon and Kuo (1979) A. S. Argon and H. Y. Kuo, Mat. Sci. and Eng. 39, 101 (1979).
- Lauridsen et al. (2002) J. Lauridsen, M. Twardos, and M. Dennin, Phys. Rev. Lett. 89, 098303 (2002).
- Ghaskadvi and Dennin (1998) R. S. Ghaskadvi and M. Dennin, Rev. Sci. Instr. 69, 3568 (1998).
- Rodts et al. (2003) S. Rodts, J. C. Baudez, and P. Coussot, preprint (2003).