Percolation and localization in the random fuse model
Abstract
We analyze damage nucleation and localization in the random fuse model with strong disorder using numerical simulations. In the initial stages of the fracture process, damage evolves in an uncorrelated manner, resembling percolation. Subsequently, as the damage starts to accumulate, current enhancement at the tips of the microcracks leads eventually to catastrophic failure. We study this behavior quantifying the deviations from percolation and discussing alternative scaling laws for damage. The analysis of damage profiles confirms that localization occurs abruptly starting from an uniform damage landscape. Finally, we show that the cumulative damage distribution follows the normal distribution, suggesting that damage is uncorrelated on large length scales.
pacs:
46.50.+a, 64.60.Ak1 Introduction
Understanding the scaling properties of fracture in disordered media represents an intriguing theoretical problem with important implications for practical applications breakdown . Experiments have shown that in several materials under different loading conditions, the fracture surface is rough and can be described by self-affine scaling man with universal exponents bouch . Scaling is also observed in acoustic emission experiments, where the distribution of pulses decays as a power law over several decades. Experimental observations have been reported for several materials such as wood ciliberto , cellular glass strauven , concrete ae and paper paper , but universality does not seem to hold.The experimental observation of power law behavior suggests an interpretation in terms of critical phenomena and scaling theories, but a complete theoretical explanation has not been found. The statistical properties of fracture in disordered media are often studied with lattice models, describing the medium as a discrete set of elastic bonds with random failure thresholds breakdown . These numerical simulations are used in estimating the roughness of the fracture surface, which is found to be self-affine hansen91b ; bat-98 ; rai-98 ; sep-00 , and the power law distribution of avalanche precursors hansen ; zrvs ; zvs ; gcalda ; alava . While the results agree qualitatively with experiments a quantitative comparison is not always satisfactory.
Apart from the comparison with experiments, an important theoretical issue is to understand the origin of the scaling behavior observed in the numerical simulations of lattice model. A very well studied model is the random fuse model (RFM), where a lattice of fuses with random threshold are subject to an increasing voltage deArcangelis85 ; breakdown ; zrvs ; kahng88 ; delaplace ; deArcangelis89 ; nukalajpamg . A resistor network represents a scalar analog of an elastic medium and is thus relatively simple to analyze, while retaining some important characteristic features of the problem.
Simulations of the RFM show that the type of behavior at macroscopic fracture is significantly influenced by the amount of disorder kahng88 . When the disorder is narrowly distributed, materials breakdown without significant precursors. As the disorder increases, substantial damage is accumulated prior to failure and the dynamics resembles percolation sornette . Indeed, in the limit of infinite disorder, the damage accumulation process can exactly be mapped onto a percolation problem guyon88 . It is still debated, however, if percolation is applicable to the case of strong but non-infinite disorder. Recently, some evidence has been provided in this direction hansen003 suggesting that the critical exponent, , of the correlation length in the RFM with strong disorder is same as that of uncorrelated percolation (i.e. ), and that the fuse model is in the same universality class of percolation. Close to failure damage would then localize and the resulting crack roughness would ensue from a gradient percolation mechanism hansen003 .
In the present work, we propose a different interpretation of damage localization in the RFM: while in the initial stages damage accumulates as in a percolation process, the final crack nucleates abruptly due to current enhancement, yielding the observed localization profiles. As a consequence of this, the damage localization length follows closely the scaling of crack width. In addition, we test percolation scaling by simulating the RFM with triangular and diamond (square lattice with 45 degrees inclined bonds to the bus bars) lattice topologies deArcangelis85 ; breakdown and different disorder distributions (uniform and power law). The numerical results allows us to exclude that , but could still be compatible with another value of , although devations from scaling are observed for large sizes.
Finally, we show that the cumulative damage probability distribution at failure can be collapsed for different lattice sizes and follows the normal distribution. This suggests that damage is the sum of uncorrelated variables and thus no long-range correlation are present as would be expected in critical phenomena. This fact, together with the abrupt localization occurring right at failure, suggests the validity of the first-order transition hypothesis discussed in Ref. zrvs .
The paper is organized as follows: in section II we define the model and in section III we discuss the role of disorder. The percolation hypothesis is tested in section IV, while section V is devoted to damage localization. The scaling of the number of broken bonds is discussed in section VI. Section VII presents the analysis of the failure probability distribution and section VIII summarizes briefly our conclusions.
2 Model
In the random thresholds fuse model, the lattice is initially fully intact with bonds having the same conductance, but the bond breaking thresholds, , are randomly distributed based on a thresholds probability distribution, . The burning of a fuse occurs irreversibly, whenever the electrical current in the fuse exceeds the breaking threshold current value, , of the fuse. Periodic boundary conditions are imposed in the horizontal direction to simulate an infinite system and a constant voltage difference, , is applied between the top and the bottom of lattice system bus bars.
Numerically, a unit voltage difference, , is set between the bus bars and the Kirchhoff equations are solved to determine the current flowing in each of the fuses. Subsequently, for each fuse , the ratio between the current and the breaking threshold is evaluated, and the bond having the largest value, , is irreversibly removed (burnt). The current is redistributed instantaneously after a fuse is burnt implying that the current relaxation in the lattice system is much faster than the breaking of a fuse. Each time a fuse is burnt, it is necessary to re-calculate the current redistribution in the lattice to determine the subsequent breaking of a bond. The process of breaking of a bond, one at a time, is repeated until the lattice system falls apart. In this work, we consider a uniform probability distribution, which is constant between 0 and 1, and a power law distribution , with .
Numerical simulation of fracture using large fuse networks is often hampered due to the high computational cost associated with solving a new large set of linear equations every time a new lattice bond is broken. The authors have developed rank-1 sparse Cholesky factorization updating algorithm for simulating fracture using discrete lattice systems nukalajpamg . In comparison with the Fourier accelerated iterative schemes used for modeling lattice breakdown batrouni , this algorithm significantly reduced the computational time required for solving large lattice systems. Using this numerical algorithm, we were able to investigate damage evolution in larger lattice systems (e.g., ), which to the authors knowledge, is so far the largest lattice system used in studying damage evolution using initially fully intact discrete lattice systems. However, in this paper, we consider results up to due to insufficient number of available sample configurations for , which will be considered in a future publication.
Using the algorithm presented in nukalajpamg , we have performed numerical simulations on two-dimensional triangular and diamond (square lattice inclined at 45 degrees between the bus bars) lattice networks. For many lattice system sizes, the number of sample configurations, , used are excessively large to reduce the statistical error in the numerical results (see Tables 1 and 2). Each numerical simulation was performed on a single processor of Eagle (184 nodes with four 375 MHz Power3-II processors) supercomputer at the Oak Ridge National Laboratory. The statistically independent number of configurations were simulated simultaneously on number of processors available for computation.
3 The role of disorder
The disorder distribution has clearly an important effect on the fracture behavior and a classification has been proposed in terms of a scale-invariant spectrum hansen91 ; hansen001 , which for the uniform thresholds distribution in terms of intensive variables, and , is given by hansen91 ; hansen001
| (1) |
where
| (2) | |||||
| (3) |
Hence, for the uniform distribution between 0 and 1, the two control parameters , and that characterize the thresholds distribution close to zero and infinity, respectively, are given by , and hansen91 ; hansen001 , where are defined by
| (4) |
For the power law thresholds distributions as the one we are using, the scale-invariant thresholds spectrum is given by
| (5) |
and the two control parameters are and hansen91 ; hansen001 . According to Ref. hansen91 ; hansen001 , based on the values of these two control parameters, and , both the uniform thresholds distribution and power-law thresholds distributions (as long as hansen001 ) belong to the same scaling regime characterized by diffusive damage and localization (see regime B of Figure 18 in reference hansen001 ). According to this analysis, if the exponent were to be universal and is in the same universality class as that of uncorrelated percolation as conjectured in hansen003 , then we expect to find for uniform and power law threshold distributions.
4 Damage and percolation
In the case of strong disorder, in the initial stages of damage evolution, bond breaking events occur in an uncorrelated manner and thus resemble percolation. As the damage starts to accumulate, some degree of correlation can be expected because of the current enhancement present at the crack tips. A natural question to ask concerns the relevance of these correlations as failure is approached. If correlations are irrelevant one should observe percolation scaling up to failure, as in the case of infinite disorder. On the other hand, in the weak disorder case, the current enhancement at the crack tips is so strong that a spanning crack is nucleated soon after a few bonds (or even a single bond) are broken kahng88 . The interesting situation corresponds to the diffuse damage and localization regime, where a substantial amount of damage is accumulated prior to failure. In this regime one should test if damage follows percolation scaling up to failure.
Hansen and Schmittbuhl hansen003 have considered broad threshold distributions , with two different and values, to see if percolation scaling was observed for . Based on the similarities with percolation, they hansen003 suggested the following finite size scaling law for the fraction of broken bonds, given by
| (6) |
In the Eq. (6), and represent the fracture thresholds in a lattice system size of and infinity, respectively. As the system size , the broken bonds at failure . The correlation critical exponent was found in Ref. hansen003 to be consistent with the percolation value . An additional test is provided by the damage standard deviation at failure ramstad which should scale as
| (7) |
Here we test these scaling laws for a wider finite size range than Ref. hansen003 , wherein simulations with sizes up to are reported. The fraction of broken bonds for each of the lattice system sizes is obtained by dividing the number of broken bonds with the total number of bonds, , present in the fully intact lattice system. For triangular lattice topology, , and for diamond lattice topology, . The lattice system sizes considered in this work are . However, since corrections to the scaling laws are strongest for small lattice systems, in the following, we use lattice sizes for obtaining the scaling exponents. Table 1 presents mean and standard deviations in the broken bond density (fraction of broken bonds) at the peak load and at failure for various lattice system sizes in both the triangular and diamond lattice systems for uniform thresholds distribution. In order to compare diamond and triangular lattice topologies, we find it more convenient to use rather than as a finite size parameter. This is because the two lattices have a different dependence of the real lattice size (i.e., ) on the linear size . We plot in Fig. 1, the mean fraction of broken bonds at failure as a function of for diamond and triangular lattices, which in principle should obey Eq. 6 as well. While to accept the percolation hypothesis one should observe a linear regime, a net curvature is apparent in the data especially for sizes . A similar curvature is found in the 50% survival probability .
We repeated the same analysis using the power law threshold distribution with in triangular lattices of sizes . Table 2 presents mean and standard deviations in the broken bond density (fraction of broken bonds) at the peak load and at failure for power law thresholds distribution. The result is reported in Fig. 2, and is once again in contrast with percolation scaling (i.e. )


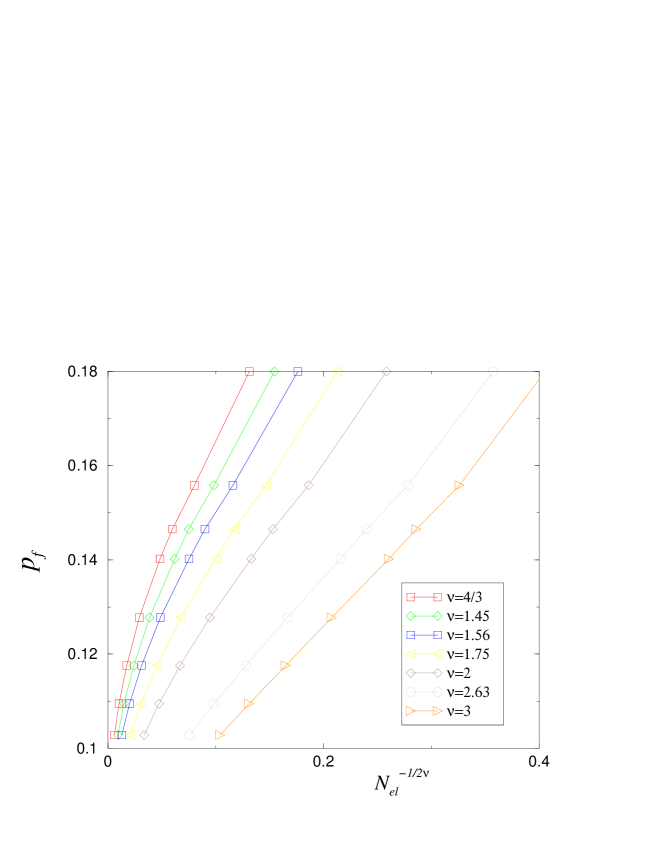
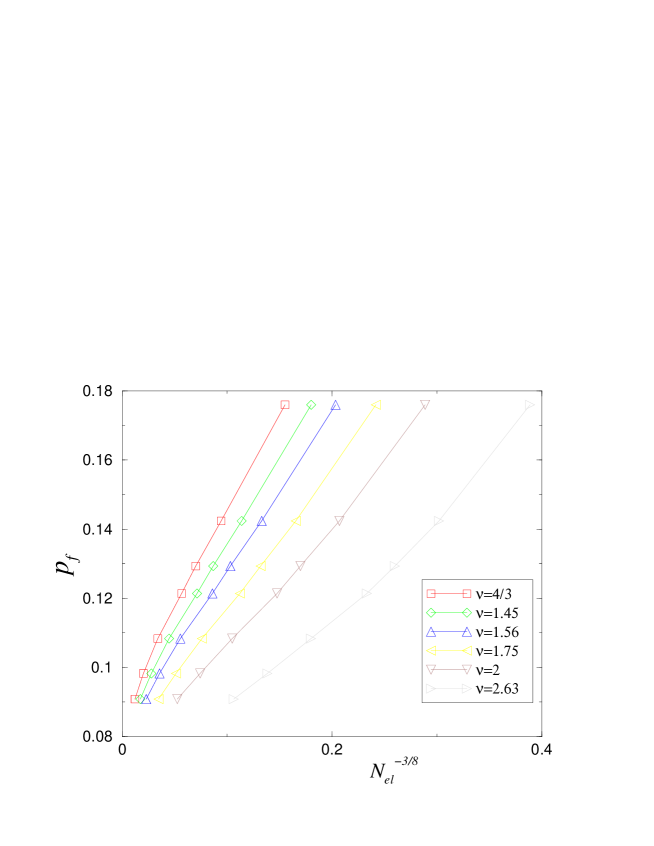
Thus we can conclude that in the random fuse model with a uniform and power law distributions is not equal to . On the basis of the results, however, we can not exclude the possibility that Eq. (6) is valid with a different value of . This would correspond to some sort of correlated percolation, which, being a second order critical phenomenon, is expected to be universal with respect to the lattice structure. A way to test this idea is to plot the data as in Figs. 1-2 using a different value of . In Figs. 3a and 3b we report similar plots for the triangular and diamond lattice topologies with uniform thresholds distribution, where it can be seen that a straight line is obtained only for large values of . In addition, the values for which a straight line is obtained in Figs. 3a and 3b are quite different from one another. For example, a direct fit of the data for yields
| (8) |
for triangular lattices, and
| (9) |
for diamond lattices. Hence, Eqs. (8) and (9) for triangular and diamond lattice topologies, estimate the scaling exponent to be equal to and , respectively.
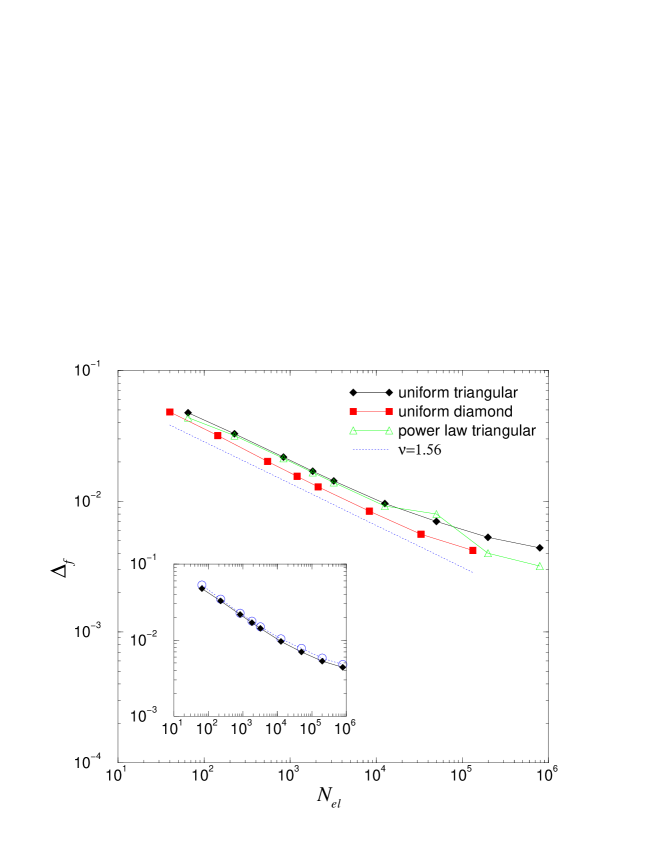
An additional test is provided by plotting the standard deviation of bonds at failure, which in case of percolation should follow Eq. 7. For small lattice sizes the data follow a power law with an exponent , but deviations occur at large sizes. In the framework proposed in Ref. hansen003 one could interpret the data in Fig. 4 as an indication of an initial correlated percolation process with , which then crosses over to a localized state where scaling is obscured by the presence of a damage concentration profile. We will show in the next section, however, that there is apparently no localization at peak load (i.e. the maximum current before catastrophic failure). On the other hand, the damage standard deviation at peak load follows closely the behavior at failure as shown in the inset of Fig. 4. Thus the damage profile does not appear to be responsible from the deviation from scaling. A different explanation would be that there is no scaling just because the lattice fails abruptly far from a (correlated) percolation critical point.
5 Damage localization
As discussed in the previous section, damage is not described by percolation critical scaling up to the largest sizes. Fracture is abrupt and damage localizes. Here we clarify when and how localization takes place. In particular, we will consider the damage accumulated up to the peak load (i.e. the highest current that the lattice can bear without breaking) and after the peak load up to failure.
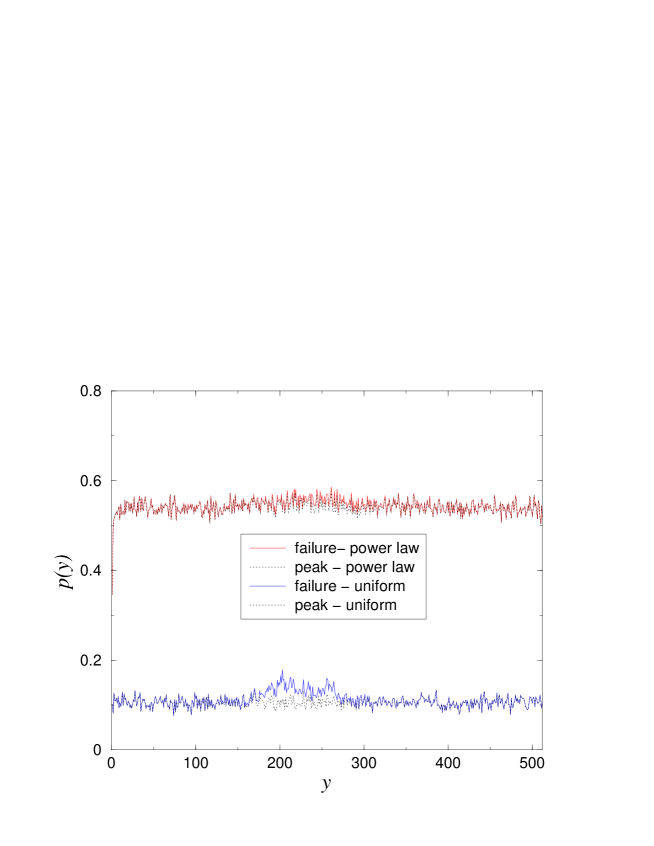
In Fig. 5 we display the damage profile at failure and at peak load in a single simulation, for the cases of uniform and power law disorders. For uniformly distributed thresholds, localization appears clearly at failure, while at peak load the damage spreads homogeneously though the lattice. For power law disorder, it is difficult to assess from these curves the extent of localization. To obtain a quantitative description of the localization process it is necessary to average over different realizations.
Averaging the profiles is a delicate task since localization does not necessarily take place in the center, but can in principle occur anywhere along the length of the lattice. Thus one can not perform a simple average because this would yield a flat average profile irrespective of the individual profile shapes in a single realization. The authors of Ref. mikko04 proposed to first shift the profiles so that they are centered around the maximum and then average. This method emphasizes the noise too much, yielding a spurious cusp in the center. Another possibility is to shift instead by the center of mass of the damage or, to avoid any effects due to shifting, one can use the Fourier method.
We first consider the damage accumulated up to peak load shifting the data by the center of mass method. The result displayed in Fig. 6 for the uniform disorder distribution clearly shows that there is no localization at peak load. In the case of power law disorder the profile as presented in Fig. 7 is not completely flat for small scales, but flattens more and more as the size is increased. We tend thus to attribute the apparent profile to size effects. These data imply that the localization profiles already observed in the literature hansen003 ; hansen-other ; mikko04 reflect mostly the final breakdown event, after the final spanning crack is nucleated. To quantify the corresponding damage localization, we can then average the profiles obtained considering only the damage accumulated between the peak load and failure. In addition, this procedure considerably reduces the background noise.
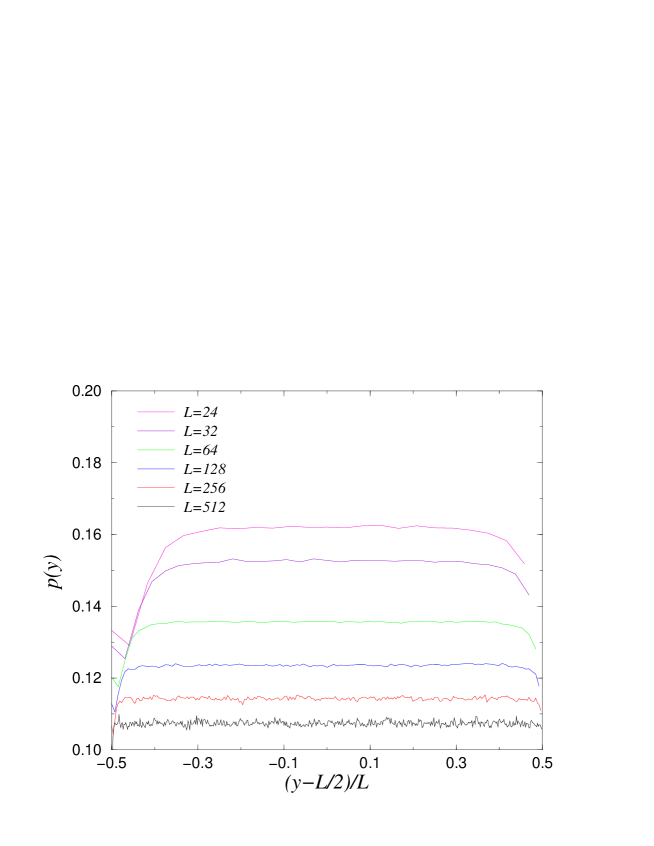
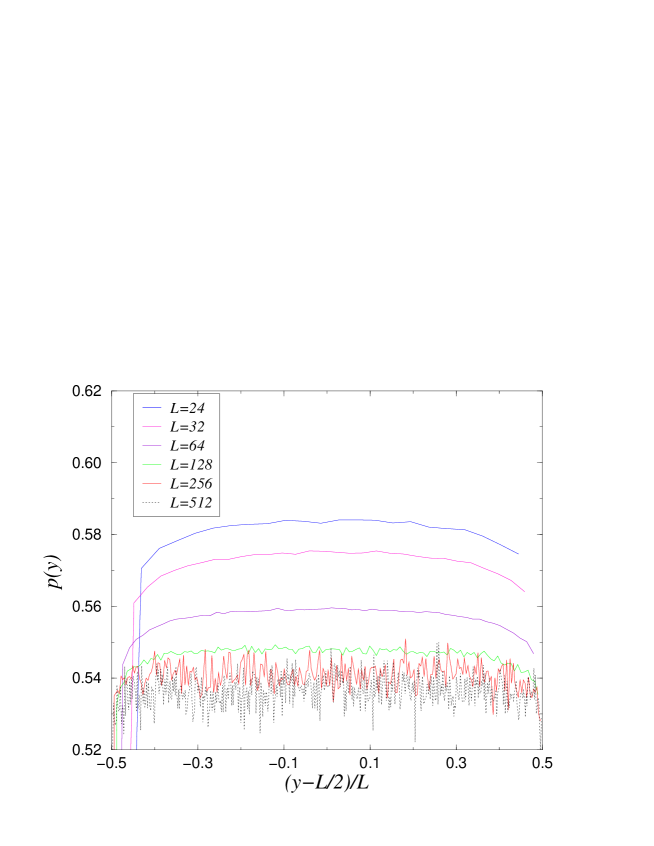
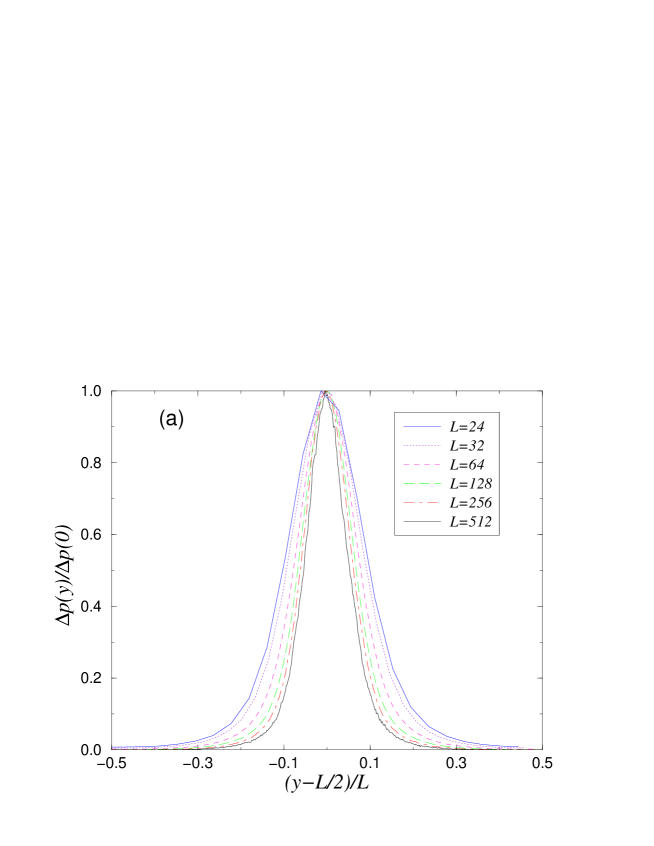
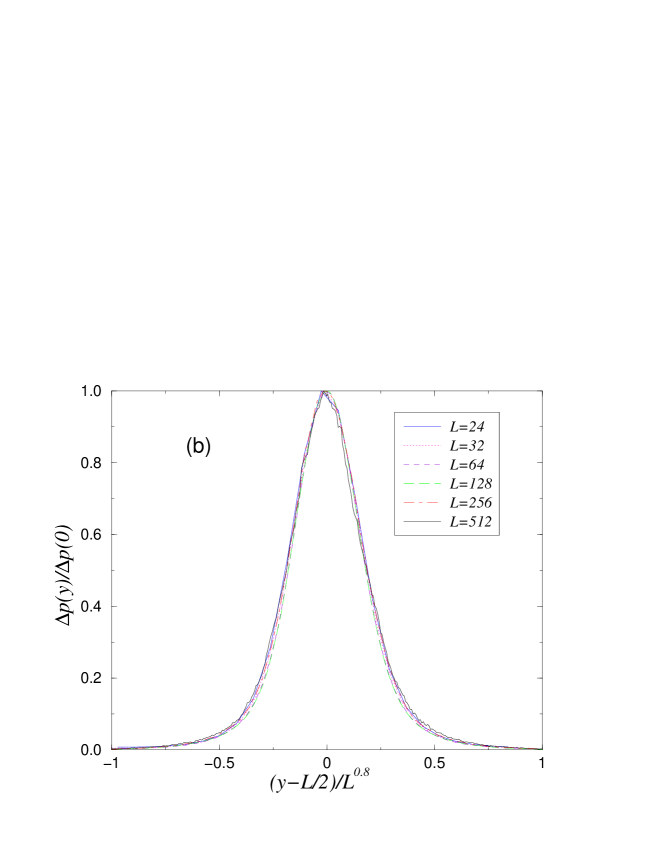
The center of mass shifted averaged profiles for various system sizes are reported in Figs. 8a and 8b for uniform and power law disorder cases and these profiles show that the profile shapes decay exponentially at large system sizes. The damage peak scales as for the uniform distribution and is roughly constant for the power law distribution. We have tried different ways to collapse these profiles to extract a localization length. The simple linear scaling , proposed in Ref. hansen003 , does not yield a very good collapse (see Fig. 9a). A perfect collapse is instead obtained using the form
| (10) |
where and , with (see Fig. 9b). The situation for power law disored is similar, but scaling is less precise. As shown in Fig. 8b, the profiles are decaying again exponentially. We could not, however, perform a reliable collapse: a linear scaling seems appropriate for system sizes but fails for larger sizes.
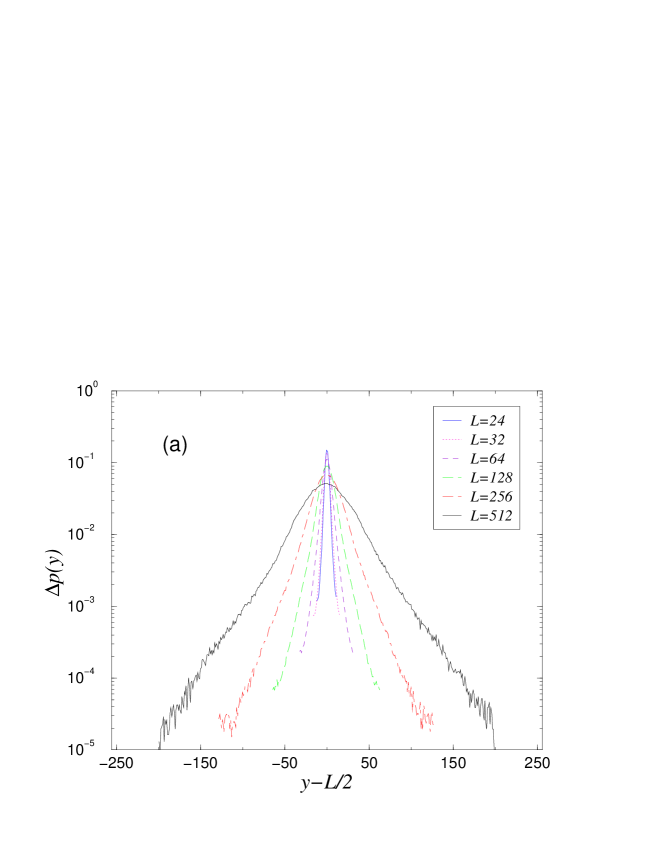
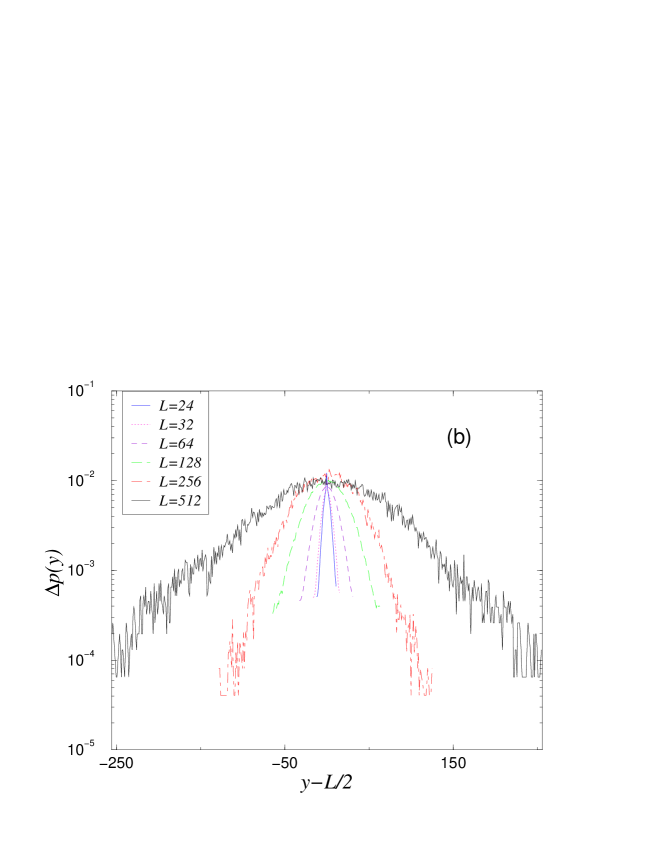
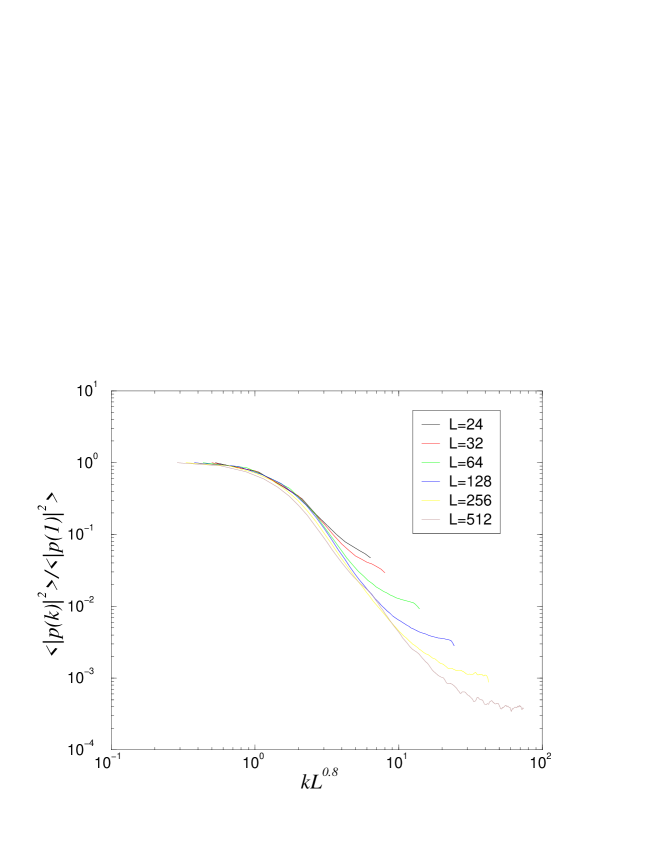
To obtain additional confirmation of these results, we perform a Fourier analysis of the profiles, thus avoiding any possible bias due to the shifting. We first compute the magnitude of the Fourier transform for each realization and then average over disorder. From Eq. 10 we would expect the power spectrum of the profile to follow
| (11) |
This result applies to an infinite system and finite size deviations and other problems of the discrete Fourier transform are expected to affect the data. Nonetheless, as shown in Fig. 10, we can collapse reasonably well the curves using the same exponent as in real space.
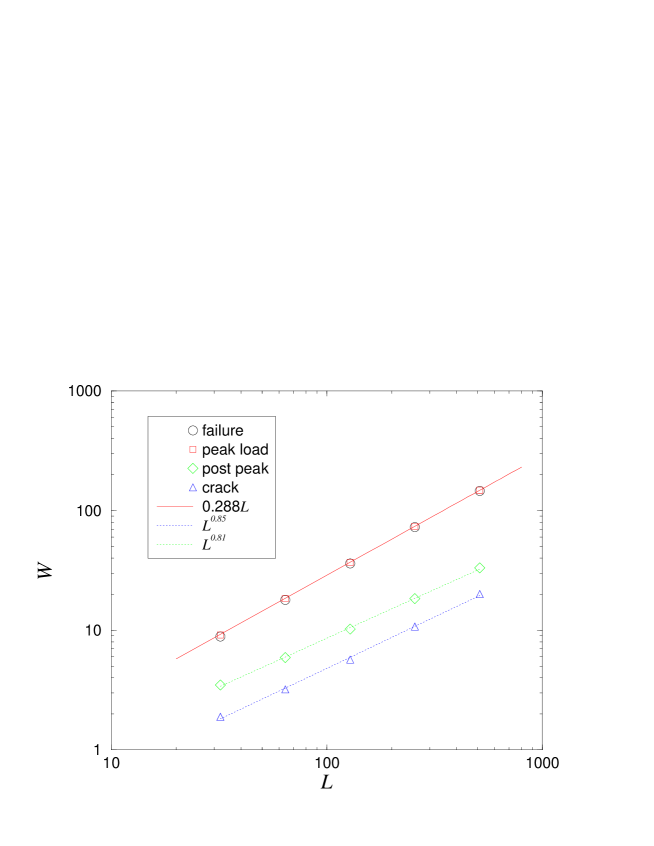
It is also possible to estimate the localization length directly, independently of the profile averaging. This is done by computing the width of the damage cloud as , where is the coordinate of a broken bond and the average is taken over different realizations. We have first measured at peak load and at failure, and obtained a result , consistent with earlier results hansen91 (see Fig. 11). This result is expected, since for a uniformly distributed damage such as at the peak load, , and is in excellent agreement with the numerical data. This is consistent with the fact that there is no localization at peak-load and at failure the damage cloud is dominated by the uniform fluctuations already present at peak load. Any additional scaling due to localization is obscured. To uncover it we can restrict the average only to the bonds broken in the last failure event (post-peak damage), obtaining which is consistent with the data collapse of the profiles. It is interesting to notice that the width of the final crack scales as well with a similar exponent. This supports the idea that localization is produced by catastrophic failure which yields at the same time the crack and the damage profile.
6 Scaling of the damage density
It has been noted in the previous section that the final breakdown event is very different from the initial precursors. Thus, we consider the scaling of the number of broken bonds at the peak load, , that excludes the last catastrophic event. In Fig. 12 we plot as a function of the lattice size for triangular and diamond lattices. The data displays a reasonable power law behavior , with and for triangular and diamond lattice, respectively as previously shown in Ref. delaplace . Thus the difference between the two lattices is marginal and may be attributed to the results obtained from the smaller lattice sizes, where corrections to the fractal scaling may exist. By plotting vs (see the inset of Fig. 12) we show that some systematic deviations appear. The data could be equally well fit by a linear law times a logarithmic correction as suggested in Ref. mikko04 (see Fig. 13). Both these fits imply that in the limit of large lattices the fraction of broken bonds prior to fracture vanishes (i.e. in the thermodynamic limit).
Figure 14 presents the scaling for the number of broken bonds, , after crossing the peak load. Once again, the scaling exponent for is similar for both the triangular and diamond lattice topologies, and is equal to and respectively. This exponent is consistent with the parameters estimated from the profile , The behavior of power law disorder appears to be simpler. The number of broken bonds at peak load scales linearly with , as shown in Fig. 15. A similar result holds asymptotically for (see Fig. 15), which is again consistent with the profile scaling.


7 The failure probability distribution
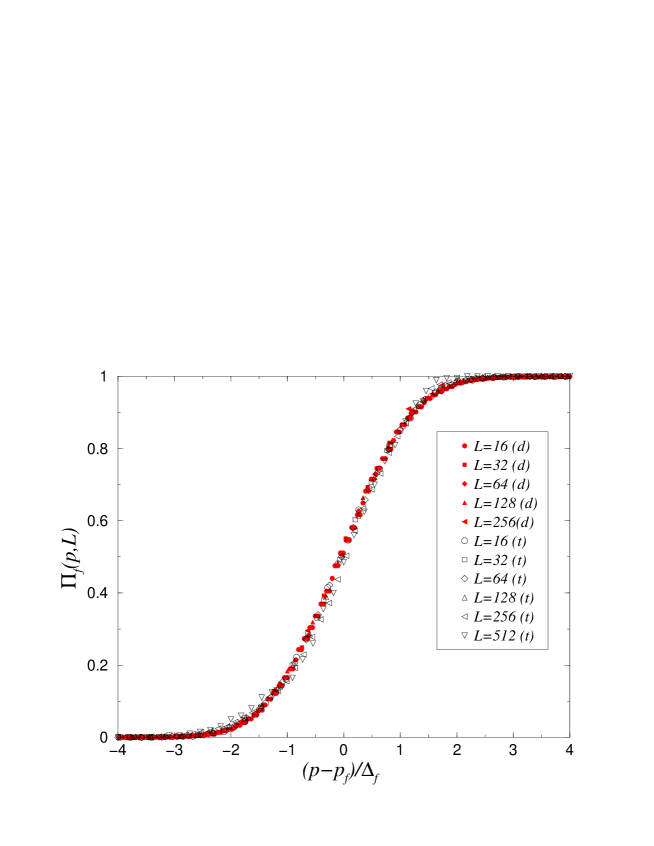
The cumulative probability distribution for the fraction of broken bonds at failure (also termed as cumulative failure probability distribution), defined as the probability that a system of size fails when the fraction of broken bonds equals , where is the number of broken bonds, is plotted in Fig. 16 for varying triangular lattice system sizes. In Ref. hansen003 a data collapse of a different, but, related distribution (i.e., survival probability) was attempted using percolation scaling. As it is evident from the failure of such a scaling (i.e., Eq. (6)), this collapse is poor.
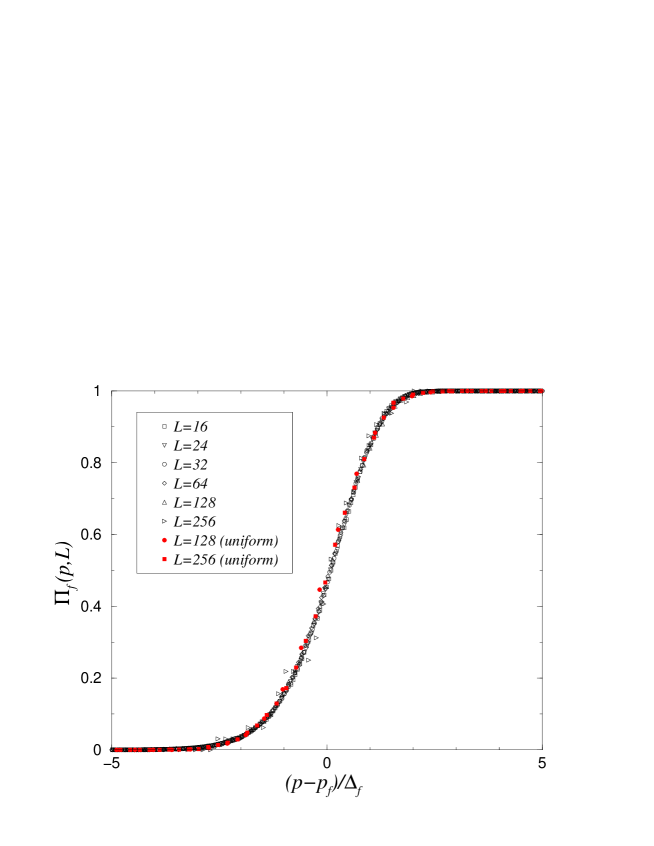
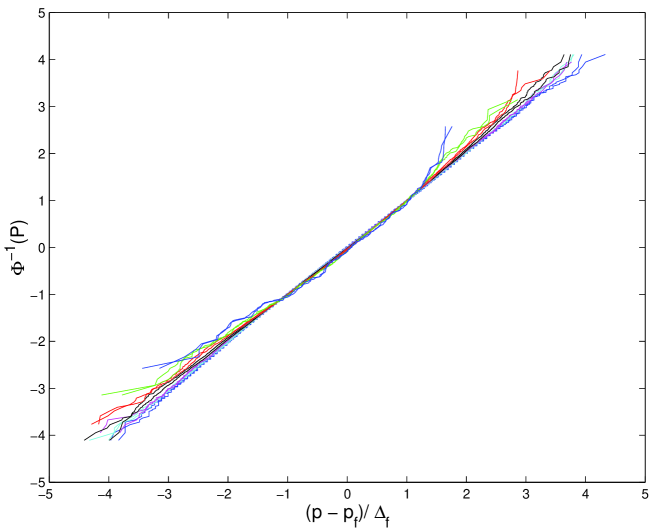
On the other hand, we obtain a very good collapse by simply plotting the distribution in terms of , where and denote the mean and standard deviation of the number of broken bonds at failure, and and denote the mean and standard deviation of fraction of broken bonds at failure. Fig. 17 shows that may be expressed in a universal scaling form such that for both triangular and diamond lattice topologies of different system sizes . A similar collapse can be performed for the power law disorder distribution (see Fig. 18). The excellent collapse of the data in Figs. 17 and 18 suggests that the cumulative failure probability distribution, , may be universal in the sense that it is independent of lattice topology and disorder distribution.We have also checked that the distributions at peak load obey essentially the same laws, i.e., , where is the probability that a system of size is at the peak load when the fraction of broken bonds equals , and is the corresponding reduced variable at the peak load. Finally, the collapse of the data in Fig. 19 indicates that a Gaussian distribution adequately describes .
The fact that damage is Gaussian distributed suggests that there is no divergent correlation length at failure consistent with the conclusions of Ref. delaplace that reported a finite correlation length at failure. Long-range correlations in the damage would imply that the central limit theorem does not hold and hence the normal distribution would not be an adequate fit to the data. The absence of long-range corralation is again in agreement with the hypothesis that fracture is analogous to a first-order transition zrvs .

8 Discussion
This paper presents numerical simulations on large two-dimensional triangular and diamond lattice fuse networks with uniform and power law disorder distributions. We focus our analysis on the statistical properties and localization features of the damage as a function of the lattice type, size and disorder form. The use of high statistical sampling and relatively large lattice sizes is essential to obtain reliable results.
The picture emerging from our analysis is that, for strong disorder, damage accumulates first in the system in an uncorrelated (or short range correlated) manner. This process continues up to the peak load, where no apparent sign of localization is present. Further increase of the current leads to catastrophic failure through a large avalanche event, whose size scales with the lattice size as . The damage accumulated in this event is localized in a cloud surrounding the final crack. The damage profile has exponential tails and can be collapsed for different system sizes using an appropriate scaling law.
The accumulated damage density at failure appears to be far from a percolation like critical point, since we could not find a reliable universal scaling law as the system size is varied. A different possibility that we have tested is that as , but a fit using simple scaling forms show some deviation as well. Thus we can not conclude whether decays slowly to zero, or to a non vanishing asymptotic value. This value, however, would not necessarily coincide with a critical point.
Finally, this study also presents the scaling of cumulative failure probability distribution, which is defined as the probability that a lattice system fails at a given fraction of broken bonds. Based on the numerical results presented, we show that the cumulative failure probability distribution is universal in the sense that it does not depend on the lattice topology, i.e., the distributions are identical for both triangular and diamond lattice topologies. Furthermore, a normal distribution presents an adequate fit to the data.
References
References
- (1) Herrmann HJ and Roux S (eds.), Statistical Models for the Fracture of Disordered Media, (North-Holland, Amsterdam, 1990). Bardhan KK, Chakrabarti BK and Hansen A (eds.), Non-linearity and breakdown in soft condensed matter, (Springer Verlag, Berlin, 1994). Chakrabarti BK and Benguigui LG, Statistical physics of fracture and breakdown in disordered systems (Oxford Univ. Press, Oxford, 1997). Krajcinovic D and van Mier, Damage and fracture of disordered materials, (Springer Verlag, New York, 2000).
- (2) Mandelbrot BB, Passoja DE, and Paullay AJ 1984 Nature (London) 308, 721
- (3) For a review see Bouchaud E 1997 J Phys. C 9, 4319
- (4) Garcimartín A, Guarino A, Bellon L and Ciliberto S 1997 Phys. Rev. Lett. 79, 3202 ; Guarino A , Garcimartín A and Ciliberto S 1998 Eur. Phys. J. B 6, 13 .
- (5) Maes C, Van Moffaert A, Frederix H and Strauven H 1998 Phys. Rev. B 57, 4987.
- (6) Petri A, Paparo G, Vespignani A 1994 Alippi A and Costantini M, Phys. Rev. Lett. 73, 3423
- (7) Salminen LI, Tolvanen AI , and Alava MJ 2002 Phys. Rev. Lett. 89, 185503
- (8) Hansen A, Hinrichsen EL, and Roux S, 1991 Phys. Rev. Lett. 66, 2476
- (9) Batrouni GG and Hansen A 1998 Phys. Rev. Lett. 80, 325 (1998).
- (10) Räisänen VI, Seppälä ET, Alava MJ 1988 and Duxbury PM, Phys. Rev. Lett. 80, 329 (1998).
- (11) Seppälä ET, Räisänen VI, and Alava MJ 2000 Phys. Rev. E 61, 6312 (2000)
- (12) Hansen A and Hemmer PC 1994 Phys. Lett. A 184, 394 (1994).
- (13) Zapperi S, Ray P, Stanley HE, and Vespignani A 1997 Phys. Rev. Lett. 78, 1408; 1999 Phys. Rev. E 59, 5049
- (14) Zapperi S, Vespignani A, and Stanley HE 1997 Nature (London) 388, 658
- (15) Caldarelli G, Di Tolla FG and Petri A 1996 Phys. Rev. Lett. 77, 2503
- (16) Räisänen VI, Alava MJ, Nieminen RM 1998 Phys. Rev. B, 58, 14288
- (17) Kahng B, Batrouni GG, Redner S, de Arcangelis L and Herrmann HJ 1988 Phys. Rev. B 37, 7625
- (18) Delaplace A, Pijaudier-Cabot G, and Roux S 1996 Journal of Mechanics and Physics of Solids, 44, 99
- (19) de Arcangelis L, Hansen A, Herrmann HJ, and Roux S 1989 Phys. Rev. B, 40, 877
- (20) Nukala PKVV, and Simunovic S 2003 J. Phys. A: Math. Gen. 36, 11403
- (21) de Arcangelis L, Redner S, and Herrmann HJ 1985 J. Phys. (Paris) Lett. 46 585; Sahimi M and Goddard JD 1986 Phys. Rev. B, 33, 7848.
- (22) Andersen JV, Sornette D, and Leung KT 1997 Phys. Rev. Lett. 78, 2140 Sornette D and Andersen JV 1998 Euro. Phys. Journal B. 1 353 Johansen A and Sornette D 2000 Euro. Phys. Journal B. 18 163
- (23) Roux S, Hansen A, Herrmann HJ, and Guyon E 1988 J. Stat. Phys. 52, 237
- (24) Hansen A and Schmittbuhl J 2003 Phys. Rev. Lett. 90, 45504
- (25) Bakke JOH, Bjelland J, Ramstad T, Stranden T Hansen A and Schmittbuhl 2003 Physica Scripta T106 65
- (26) Reurings F and Alava MJ 2004 preprint cond-mat/0401592
- (27) Ramstad T et al. , preprint cond-mat/0311606
- (28) Batrouni GG, Hansen A, and Nelkin M 1986 Phys. Rev. Lett. 57, 1336; 1988 J. Stat. Phys. 52, 747
- (29) Hansen A, Hinrichsen EL and Roux S 1991 Phys. Rev. B, 43, 665
- (30) Hansen A and Roux S 2000, Statistical toolbox for damage and fracture, 17-101, in book Damage and Fracture of Disordered Materials, eds. D. Krajcinovic and van Mier, Springer Verlag, New York.
| L | Triangular | Diamond | |||||||
|---|---|---|---|---|---|---|---|---|---|
| 4 | 50000 | 0.2070 | 0.0532 | 0.3030 | 0.0476 | 0.2367 | 0.0625 | 0.3611 | 0.0482 |
| 8 | 50000 | 0.1813 | 0.0346 | 0.2440 | 0.0329 | 0.1794 | 0.0365 | 0.2576 | 0.0318 |
| 16 | 50000 | 0.1612 | 0.0225 | 0.2023 | 0.0218 | 0.1470 | 0.0222 | 0.1972 | 0.0202 |
| 24 | 50000 | 0.1513 | 0.0177 | 0.1841 | 0.0170 | 0.1340 | 0.0169 | 0.1731 | 0.0155 |
| 32 | 50000 | 0.1451 | 0.0150 | 0.1731 | 0.0143 | 0.1267 | 0.0139 | 0.1596 | 0.0129 |
| 64 | 50000 | 0.1325 | 0.0104 | 0.1524 | 0.0096 | 0.1132 | 0.0092 | 0.1353 | 0.0084 |
| 128 | 12000 | 0.1222 | 0.0078 | 0.1362 | 0.0070 | 0.1031 | 0.0064 | 0.1181 | 0.0056 |
| 256 | 1200 | 0.1142 | 0.0058 | 0.1238 | 0.0053 | 0.0955 | 0.0048 | 0.1052 | 0.0042 |
| 512 | 200 | 0.1072 | 0.0048 | 0.1136 | 0.0044 | ||||
| L | Triangular | ||||
|---|---|---|---|---|---|
| 4 | 50000 | 0.5360 | 0.0450 | 0.5568 | 0.0437 |
| 8 | 50000 | 0.5454 | 0.0324 | 0.5535 | 0.0318 |
| 16 | 50000 | 0.5489 | 0.0217 | 0.5531 | 0.0213 |
| 24 | 50000 | 0.5491 | 0.0170 | 0.5526 | 0.0166 |
| 32 | 50000 | 0.5483 | 0.0143 | 0.5517 | 0.0139 |
| 64 | 25000 | 0.5449 | 0.0096 | 0.5489 | 0.0092 |
| 128 | 1400 | 0.5406 | 0.0082 | 0.5449 | 0.0080 |
| 256 | 32 | 0.5379 | 0.0045 | 0.5417 | 0.0040 |
| 512 | 10 | 0.5349 | 0.0037 | 0.5382 | 0.0032 |