Structure of self-organized Fe clusters grown on Au(111) analyzed by Grazing Incidence X-Ray Diffraction
Abstract
We report a detailed investigation of the first stages of the growth of self-organized Fe clusters on the reconstructed Au(111) surface by grazing incidence X-ray diffraction. Below one monolayer coverage, the Fe clusters are in ”local epitaxy” whereas the subsequent layers adopt first a strained fcc lattice and then a partly relaxed bcc(110) phase in a Kurdjumov-Sachs epitaxial relationship. The structural evolution is discussed in relation with the magnetic properties of the Fe clusters.
pacs:
61.10.Nz, 68.55.Ac, 68.55.JkI Introduction
Nanometer-sized objects like metallic clusters or wires grown by controlled self-organization processes on surfaces exhibiting a defined strain-field (e.g. reconstructed surfaces and patterned surfaces) are currently under extensive study. Because of the reduced dimensionality and the inflated importance of surface phenomena these new objects exhibit original properties. In particular, they are models for investigating the magnetic properties of low dimensionality systems.Gambardella02 ; Ohresser01 ; Shen03 As a matter of fact, the magnetic properties are closely related to the intimate crystalline structure. Very small objects can present new and/or highly strained crystallographic phases with respect to the bulk equilibrium ones. These phases may in turn lead to peculiar spin phases or magnetic anisotropies. Investigating the structure of such small objects is therefore important but very difficult because of the very small amount of deposited material. Recently, the magnetic properties of self-organized Fe deposits on the reconstructed Au(111) surface were investigated by X-ray Magnetic Circular Dichroism (XMCD). Three different spin-phases were identified, as a function of coverage.Ohresser01 To fully understand these magnetic properties it is mandatory to precisely determine the crystalline structure of the Fe deposits. For such small clusters grown on a surface with a large lattice mismatch, one may expect strong differences compared to the bulk structure.
In this paper, the crystalline structure and strain relaxation of Fe deposits on Au(111) is investigated by Grazing Incidence X-Ray Diffraction (GIXD) as a function of Fe coverage. In a first part, the characteristics of the reconstructed Au(111) surface are given, and the reciprocal lattice is analyzed by GIXD. In a second part the structure of Fe layers by GIXD as a function of coverage is studied. The structural evolution of these Fe clusters is then discussed with respect to the structural and morphological properties of the reconstructed Au(111) surface. The analyzed Fe thicknesses range from isolated and self-organized clusters to several monolayers (ML). It is shown that Fe clusters first grow in close registry on the highly inhomogeneous reconstructed Au(111) surface, then after the coalescence, a relaxation starts upon the growth of the second layer. Above 3 ML, the film undergoes a phase transition from a fcc(111) phase to a bcc(110) phase.
II Experimental
The experiments were performed in ultra-high vacuum conditions on the Surface Diffraction Beamline (ID3) at the ESRF on a z-axis diffractometer.FCO95 ; ESRFWWW The single crystalline Au substrate was of (111) orientation within 0.1∘. It was prepared in situ by Ar+ sputtering and annealing cycles, up to 1000 K. The Fe was evaporated from a high purity-rod, heated by electron bombardment in an evaporation cell equipped with a flux monitor. During the evaporation the pressure was in the low mbar range. The growth was made with the substrate held at room temperature. After each analyzed coverage, the sample was cleaned and the Fe deposition repeated. The thickness of the deposit was controlled by fitting the specular reflectivity Kiessig fringes. The surface and Fe deposits cleanliness were controlled by Auger Electron Spectroscopy. The (111) single crystalline surface was described by the classical triangular unit cell.SMZ91 ; Grubel defined by the surface in-plane basis vectors , , making a 120∘ angle (==, where = 2.88 Å is the fcc bulk parameter of gold) and , perpendicular to the surface (). In this way the reciprocal space indices and describe the in-surface plane momentum transfer, and the perpendicular to the surface momentum transfer. The photon energy was set to 17.176 keV. The angular resolution for in-plane scans was 0.03 mdeg and the incidence angle was tuned close to the value for total external reflection of the X-rays (0.3 ∘ at 17.176 kev).
III Au(111) surface reconstruction
In order to understand the modifications in the X-ray diffraction scans induced by the evaporation of very small amounts of Fe it is important to first precisely describe the Au(111) reciprocal lattice. The strong relativistic effects experienced by the electrons in gold produce a large mismatch between the bulk equilibrium interatomic distance and the surface one.relat ; BGO02 Moreover, since the chemical nature of the surface and bulk atoms is the same, the interactions between two surface atoms and between a surface and a bulk atom have approximately the same magnitude. Hence, for the surface atoms, a competition results between the trend to get closer, or to adopt the bulk equilibrium distance. In the case of the Au(111) surface, the most favorable energetic situation consists of a surface split into domains of two different types: domains where the interatomic distance is the one of an ideal gold surface (hcp stacking) and domains with the bulk interatomic distance (fcc stacking). The two types of domains are separated by discommensuration lines, several atomic distances wide, which make the junction between the hcp and the fcc domains. The interatomic distances between surface atoms are very inhomogeneous since they vary from 2.65 Å to 2.86 Å.BGO02 The periodic succession of parallel fcc and hcp stripe domains along the denser atomic direction forms an uniaxial reconstruction. The density increase along rows (by introducing one additional Au atom every 22 bulk atoms) produces stress in the other symmetry equivalent directions (Au(111) belongs to the Fm3m space group). Hence the stripe domain reconstruction is unstable for large areasalerhand ; marchenko and the best compromise is the formation of three types of stripe domain reconstructions, each of them associated with one of the three equivalent directions. The intersection between the discommensuration lines of the different stripe domains induces the formation of kinks. The kinks are themselves ordered, and this leads to a structure in which two of three possible rotational equivalent domains of the stripe domain structure alternate periodically across the surface, forming the well-known zigzag pattern.Barth ; SMZ91 ; Vanderbilt
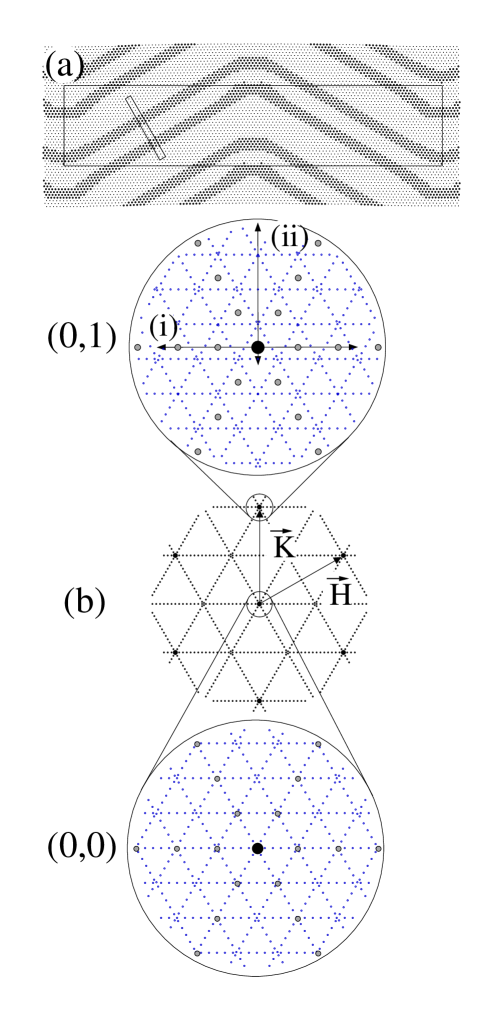
In summary, the herringbone-reconstructed Au(111) surface can be understood as the superposition of three different lattices (figure 1a):
-
1.
The fcc bulk lattice with lattice parameter .
-
2.
The surface reconstruction lattice, used to be called , which is the consequence of the density increase along the rows. In a direction there is a 22a0 super-periodicity, whereas in the perpendicular direction, the super-periodicity is .
-
3.
The rectangular () kink super-lattice with =7.2 nm (fixed precisely by the 22a0 reconstruction periodicity), and varying typically between 15 nm and 50 nm. The length experiences very large fluctuations from one sample to another, depending on the preparation conditions and the density of defects in the crystal.Fruchart03
The resulting Au(111) reciprocal space is made of the superposition of the reciprocal lattices of the three different lattices and the symmetry-equivalent domains (figure 1b). The large disks are the intersections with the (H,K) plane of the crystal truncation rods (CTR),Robinson the small grey disks represent the lattice of the reconstruction, and the dots represent the theoretical lattice formed by the regular arrangement of the kinks.
The Au(111) surface reconstruction has already been investigated in detail by GIXD with a high angular resolution by Sandy et al..SMZ91 Note however that the reciprocal space represented in Fig. 6 of ref. SMZ91, is in fact only valid around the specular reflection: since the rectangular lattice is incommensurate, one does not have exactly the same positions of the kink reflections around a (0 1) reflection (see figure 1b). Indeed, the representation of our figure 1b corresponds much better to the experimental scans of Sandy et al. (figure 8 of ref. SMZ91, ).
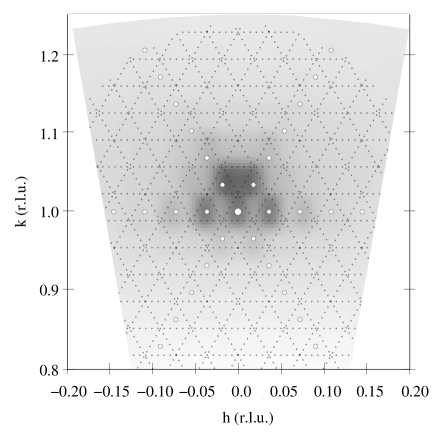
Figure 2 shows a map around the (H K L) = (0 1 0.12) region of the reciprocal space at constant L of the clean Au(111) surface. One can clearly see up to two orders of the reconstruction. The signature of the rectangular lattice produced by the kinks cannot be seen on this representation but it is clearly visible in the top HK scan of figure 3 (this scan is referenced as (i) in fig.1b) there are several faint peaks close to the (0 1) reflection and one may also guess some faint kinks in the first order reconstruction peaks, which actually correspond to the projections of the rectangular kink lattice reflections on the scanned axis.

In figure 4a, representing a K-scan at H=0 and L=0.12 (referenced as (ii) in fig.1b) for clean gold, one can identify several features: the Au crystal truncation rod at 2.88 Å-1 (K=1) momentum transfer, and the projection on the [H=0] direction of the first, second and third orders of the reconstruction. Due to the strong interatomic distance inhomogeneity, the contributions are rather broad, and it is difficult to quantitatively determine the modifications of the X-ray diffraction scans upon Fe deposition at very low coverage. The K-scans were therefore fitted by different lorentzian contributions. For clean gold, the K-scan was simulated by the superposition of 5 lorentzian peaks (figure 4a), one for the Au crystal truncation rod, three for the first, second and third order peaks of the reconstruction. The fifth peak was added to take into account the fourth and fifth order, and the background. The presence and positions of the different orders of the gold reconstruction peaks were unambiguously determined from the HK-scan of figure 3. The contribution due to the kinks was not considered in the K-scan fits because they give only faint projections.

Note that the small bump at K1.225 is always present on clean gold and likely belongs to a residual disoriented crystallite.
IV Fe deposition
It is well known that the kink positions of the herringbone reconstruction act as preferential nucleation sites for most metals.Voigtlaender ; Stroscio ; Chambliss ; Meyer ; Fonin In the case of Fe, this leads to the growth of monolayer-high clusters, located at the kinks, expanding laterally with increasing coverage. Stroscio
Upon Fe deposition, the main effect is the reduction of the intensity of the reconstruction peaks (figure 3). At about 0.5 ML, the second order peak has nearly vanished. The first order reconstruction peak can however be observed up to about 2 ML. This means that the reconstruction is progressively lifted, but the surface is still over close-packed since the first order peak remains. Interestingly, the features due to the rectangular kink lattice remain present. Intuitively one would argue that these features can only be present if there is a reconstruction. Since they do not disappear together with the reconstruction, one must assume that the Fe clusters nucleated at the kinks somehow help the Au substrate to keep the memory of the rectangular lattice. A possible mechanism would be the introduction of a periodic strain field in the gold substrate during the growth. A similar mechanism has indeed been proved recently in the case of N/Cu(100) Croset02 and was also suggested by Grazing Incidence Small Angle X-ray Scattering experiments performed on self-organized Co/Au(111) clusters.Fruchart03
The positions, widths and intensities of the CTR and the first order reconstruction peaks are easily determined through the fit procedure of the K-scans. Importantly, the rocking scans show that the positions, even for higher reconstruction orders, do not change at all with increasing coverage. Up to 2 ML the K-scans are dominated by the first and second contributions that do not vary in position. Conversely, the three other contributions show intensity and position changes (figure 4). Since the second and next orders of the reconstruction peaks quickly disappear in the type (i) HK-scans (figure 3), we can confidently attribute the increase of the three additional contributions to the Fe clusters. There are only minor changes below 1 ML, indicating that the Fe atoms grow in near registry with the underlying gold atoms. From the fits, one can locate more precisely the different contributions. In figure 5a, the corresponding real space distances of the different contributions are plotted as a function of the Fe coverage. The widths of the different contributions are plotted as ”error bars”. This graph confirms that the CTR and the first order reconstruction peaks remain nearly unchanged in lattice parameter, one corresponding to the bulk parameter (2.88 Å), the other to the average nearest-neighbor distances between gold atoms at the surface (2.78 Å). The third contribution () shows a slight and sudden increase of the lattice parameter at about 0.4 ML, from about 2.62 Å to 2.72 Å before staying more or less constant with increasing thickness. Between 0.4 ML and 3 ML there is a fcc contribution () with a slightly decreasing parameter and a very large width in K.
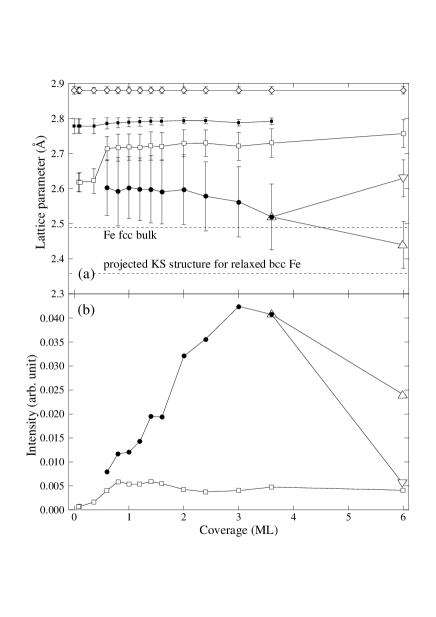
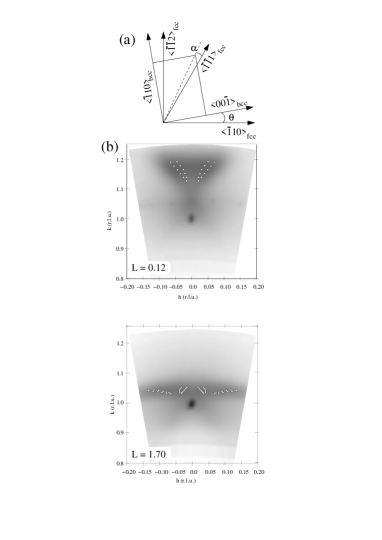
Above 3 ML, the fcc peak () splits progressively into two large contributions (,), which correspond to a phase transition towards the stable bulk Fe bcc(110) phase. The epitaxial relationship corresponds to an intermediate orientation between the Kurdjumov-Sachs (KS) and the Nishiyama-Wassermann (NW) orientations (figure 6a). Since the global symmetry corresponds to the KS symmetry, we will refer to this particular orientation as KS. Diffracted intensity maps around (0 1 0.12) and (0 1 1.7) at constant L show indeed typical patterns, although fuzzy, for such an orientation (figure 6b) (see ref. Boukari99, and refs. therein). Simulations of the peak positions in the reciprocal space reproduce the experimental data rather well (see discusion). This structure induces a projected contribution in the K-scan at about (0.05 1.17 0.12).
V Discussion
From the results above, one immediatly notices that the crystalline structure of the Fe clusters evolves as a function of coverage. The individual contributions in the diffraction scans deserve to be discussed separately.
The first contribution (() in figure 5b) exhibits a linear intensity increase with the Fe thickness and then becomes constant after 1 ML. Its average lattice parameter varies from 2.62 Å to 2.72 Å and then remains almost constant. This behavior results from the competition between the Fe-Fe and Au-Fe interactions. The Fe-Fe interactions tend to favor small Fe-Fe interatomic distances. Moreover, in the case of clusters, the edge atoms emphasize this effectstep . Conversely, the Au-Fe interactions tend to impose an iron registry growth. In the 0–0.4 ML thickness range, the nucleation takes place on the kinks, where the interatomic distances are the smallest (2.60 to 2.65 ÅBGO02 ). While growing laterally upon increasing the coverage, they spread over the hcp or fcc regions where the gold atoms are separated by 2.80 to 2.85 Å, what leads to an increased mismatch. The 1D-coalescence ( 0.4 ML) of adjacent islands along directions produces a sudden loss of edge atoms. This latter effect, associated with the large mismatch between Fe and Au at this coverage, enhances the weight of Fe-Au interactions leading to the observed transition.
A second Fe phase (() in figure 5b) with a slightly smaller lattice parameter starts growing at about 0.5 ML up to 3 ML. The intensity increase is proportional to the additional Fe thickness showing that all incoming Fe atoms adopt this crystallographic configuration. This is concomitant to the onset of the growth of a second Fe layer, with a slightly relaxed parameter on top of the first epitaxial Fe layer: indeed, the onset of the second layer growth starts between 0.5 and 0.8 ML as noticed by STM experiments Stroscio . In this thickness range (0.5-3 ML) the Fe film must be understood as a relaxed Fe fcc layer on an interfacial pseudomorphic layer.
Above 3-4 ML, the strain in the Fe layer starts to relax through a progressive transformation into the bcc Fe phase with the KS bcc(110)//fcc(111) epitaxial relationship. Indeed, this epitaxy does not yield any Bragg position along our K-scans (figure 4) and the contribution observed at K1.17 is only due to the tail of the bcc Bragg peaks located outside the K-scan. This interpretation fairly well explains the decrease, and finally splitting into two distinct bcc (,) contributions of the fcc () signal in figure 5b. The () contribution corresponds to the projection of the KS structures, seen on the figure 6b, on the direction. The () feature results from the crossing of the two KS structures on the axis. At large coverage the Fe film consists of a bcc layer on top of an interfacial pseudomorphic 1 ML thick fcc layer. It is interesting to note that the fcc to bcc transition occurs once the fcc lattice parameter has reached the value adopted by the bulk -Fe phase. The somewhat blurred diffraction patterns in figure 6b are due to both rotational disorder in the angle (as defined in 6a) and to a parametric spreading in the bcc direction, from about 2.50 Å to 2.65 Å. For the highly strained domains, the orientation is rather NW (), with nearly no orientational disorder, whereas for the less strained domains, corresponds roughly to half of the ideal angle expected for the KS orientation, with an angular distribution of about 1∘. This can be seen in figure 6 where the reflection for different orientations and parameters are superimposed to the experimental maps.
VI Conclusion
The structure and growth of Fe deposits on reconstructed Au(111) have been investigated by GIXD. Up to one monolayer, Fe grows in close registry with the reconstructed Au(111) substrate. However, due to the great inhomogeneity of the gold interatomic distances at the surface, slight changes in the in-plane atomic distances already occur during the lateral expansion of the monolayer-high Fe clusters upon growth. We qualify the structure as ”local pseudomorphism”. At the coalescence of the clusters along , there is a slight expansion of the average lattice parameter of the Fe clusters. The second Fe layer grows, with a slightly reduced parameter. Above 3 ML the film transits progressively and breaks into partly relaxed bcc(110) domains, in an orientation intermediate between the Kurdjumov-Sachs and Nishiyama-Wassermann epitaxial relationships. These structural results are consistent with the XMCD observations Ohresser01 where strong changes in the magnetic properties were evidenced. In particular, the magnetic spin moment showed a sharp increase at the unidimensional coalescence around 0.4 ML (going from 1.4 to 2.4). This change can now be correlated to the increase of the lattice parameter. Indeed, it is well known that for fcc Fe magnetism and structure are linked with, in particular, a tendency to high magnetic spin values for larger atomic volume. Moreover to fit the evolution of the magnetic anisotropy energy with the coverage a Néel model was used in reference Ohresser01, assuming a pseudomorphic growth of the first Fe layer. This assumption is now further experimentally confirmed by the present GIXD results.
Acknowledgements.
The authors are pleased to acknowledge the ID03 beamline staff of the ESRF for excellent experimental conditions and support during these experiments. We would also like to thank O. Fruchart for fruitfull discussion and A. Tagliaferri for his technical help.References
- (1) P. Gambardella, A. Dallmeyer, K. Malti, M.C. Malagoli, W. Eberhardt, K. Kern, C. Carbone, Nature 416, 301 (2002).
- (2) P. Ohresser, N. B. Brookes, S. Padovani, F. Scheurer, and H. Bulou, Phys. Rev. B 64, 104429 (2001).
- (3) J. Shen, J.P. Pierce, E.W. Plummer, and J. Kirschner, J. Phys. Condens. Matter 15, R1 (2003).
- (4) S. Ferrer and F. Comin, Rev. Sci. Instr. 66, 1674 (1995).
- (5) http://www.esrf.fr
- (6) A.R. Sandy, S.G.J. Mochrie, D.M. Zehner, K. G. Huang, and D. Gibbs, Phys. Rev. B 43, 4667 (1991).
- (7) G. Grübel, K. Huang, Doon Gibbs, D. M. Zehner, A. R. Sandy, and S. G. J. Mochrie, Phys. Rev. B 48, 18119 (1993).
- (8) J. Ferreirinho, R. Ruffini, and L. Stella, Phys. Lett. 91B, 314 (1980).
- (9) H. Bulou, and C. Goyhenex, Phys. Rev. B 65, 045407 (2002).
- (10) V. I. Marchenko, Zh. Eksp. Teor. Fiz. 81, 1141 (1981); Sov. Phys. JETP 54, 605 (1981).
- (11) O. L. Alerhand, D. Vanderbilt, R. D. Meade, and J. D. Joannopoulos, Phys. Rev. Lett. 61, 1973 (1988).
- (12) J. V. Barth, H. Brune, G. Ertl, and R. J. Behm, Phys. Rev. B 42, 9307 (1990).
- (13) S. Narasimhan, D. Vanderbilt, Phys. Rev. Lett. 69, 2455 (1992).
- (14) O. Fruchart, G. Renaud, A. Barbier, M. Noblet, O. Ulrich, J.-P. Deville, F. Scheurer, J. Mane-Mane, V. Repain, G. Baudot, and S. Rousset, Europhys. Lett. 63, 275 (2003).
- (15) I. K. Robinson, Phys. Rev. B 33, 3830 (1986).
- (16) B. Voigtländer, G. Meyer, N.M. Amer, Phys. Rev. B 44, 10354 (1991) and Surf. Sci. 255, L529 (1991).
- (17) J.A. Stroscio, D.T. Pierce, R.A. Dragoset, P.N. First, J. Vac. Sci. Tech. A 10, 1981 (1992).
- (18) D.D. Chambliss, R.J. Wilson, S. Chiang, Phys. Rev. Lett. 66, 1721 (1991).
- (19) J.A. Meyer, J.D. Baikie, E. Kopatzki, R.J. Behm, Surf. Sci. 365, L647 (1996).
- (20) M. Fonin, Y.U. Dedkov, U. Rüdiger, G. Güntherodt, Surf.Sci. 529, L275 (2003).
- (21) B. Croset, Y. Girard, G. Prévot, and M. Sotto, Y. Garreau, R. Pinchaux, and M. Sauvage-Simkin, Phys. Rev. Lett. 88, 056103 (2002).
- (22) S. Boukari, E. Beaurepaire, H. Bulou, B. Carrière, J.P. Deville, F. Scheurer, R. Baudoing-Savois, M. De Santis, Surf. Sci. 430, 37 (1999).
- (23) V. S. Stepanyuk, D. I. Bazhanov, A. N. Baranov, W. Hergert, P. H. Dederichs, and J. Kirschner, Phys. Rev. B 62, 15398 (2000).