Kinetic model of II-VI(001) semiconductor surfaces: Growth rates in atomic layer epitaxy
Abstract
We present a zinc-blende lattice gas model of II-VI(001) surfaces, which is investigated by means of Kinetic Monte Carlo (KMC) simulations. Anisotropic effective interactions between surface metal atoms allow for the description of, e.g., the sublimation of CdTe(001), including the reconstruction of Cd-terminated surfaces and its dependence on the substrate temperature . Our model also includes Te-dimerization and the potential presence of excess Te in a reservoir of weakly bound atoms at the surface. We study the self-regulation of atomic layer epitaxy (ALE) and demonstrate how the interplay of the reservoir occupation with the surface kinetics results in two different regimes: at high the growth rate is limited to layers per ALE cycle, whereas at low enough each cycle adds a complete layer of CdTe. The transition between the two regimes occurs at a characteristic temperature and its dependence on external parameters is studied. Comparing the temperature dependence of the ALE growth rate in our model with experimental results for CdTe we find qualitative agreement.
pacs:
81.10.Aj, 68.55.-a, 68.35.Bs, 81.05.DzI Introduction
Molecular beam epitaxy (MBE) and its variations continue to attract significant interest as a technique for the production of, for instance, high quality semiconductor films. In addition to its practical relevance, epitaxial growth is highly attractive from a theoretical point of view. It offers many challenging open questions and provides a workshop in which to develop novel tools for the modeling and simulation of non-equilibrium systems in general. Reviews of the experimental techniques and theoretical investigations can be found in, e.g., Refs. pimpinelli, ; corfu, .
II-VI semiconductors, as a promising class of materials, have been the subject of many experimental studies, see Ref. zwosechs, for a recent overview. Among other aspects, competing surface reconstructions and their interplay with growth or sublimation have been investigated. tatarenko ; neureiter ; faschinger ; hartmann ; cibert ; tatarenko2 As an example we will concentrate on the CdTe(001) surface, in the following, but many of the results should apply to other II-VI compounds as well. The focus will be on atomic layer epitaxy (ALE), a technique which aims at self-regulated layered growth by alternating deposition of the elements in ultra high vacuum. Specific properties of the material system and the attractive clarity of the ALE technique allow for an efficient theoretical modeling of the growth scenario.
In earlier investigations we employed two-dimensional lattice gas models of the CdTe(001) surface epl ; flat for the investigation of the temperature and flux dependence of surface reconstructions. Chemical bonds and the influence of the underlying crystal were accounted for by effective pairwise anisotropic interactions. Sublimation and ALE growth have been studied in the framework of a simple cubic model,surflett which accounted only for the most essential features of CdTe. The correct zinc-blende lattice was first considered in Ref. aachen, , but here we extend the model significantly by taking into account the formation of Te-dimers at the surface. More importantly, we will consider weakly bound excess Te, which provides a reservoir of highly mobile atoms. A similar approach with weakly bound arsenic has recently been suggested by Itoh et al.itoh98 ; itoh01 in order to describe the growth on reconstructed GaAs(001) and InAs(001) surfaces.
Within the framework of our model we demonstrate how the surface reconstruction and limited Cd-coverage restrict the ALE growth rate at high temperatures. Our model shows how this limitation is overcome if weakly bound excess Te is present on the surface at low temperatures. We observe a sudden increase of the growth rate with decreasing temperature, in qualitative agreement with experiments.
Due to the increased number of parameters compared with our earlier models a quantitative match with experimental observations is hard to achieve at the present stage of the model. One possibility to overcome this problem is to combine density functional calculations (DFT) with Kinetic Monte Carlo (KMC) simulations as was done e.g. by Grosse et al.grosseprb ; grosseprl in the context of growth on III-V(001) semiconductor surfaces. However, the available DFT input for II-VI(001) surfaces, especially CdTe(001), does not suffice for a full parametrization of our growth model.
The paper is organized as follows: before introducing the model and method in section III, we summarize essential properties and experimental findings concerning II-VI(001) surfaces in the next section. In section IV we discuss the simulated growth scenario and present the results. The last section summarizes and gives an outlook on perspective projects based on this work.
II Properties of the material system
A detailed overview of II-VI(001) surfaces, with emphasis on Te-compounds, can be found in Refs. tatarenko, ; cibert, ; tatarenko2, , for instance. Whereas we will mostly refer to CdTe, many of the features mentioned here apply to other compounds, e.g. ZnTe or ZnSe.
CdTe crystallizes in a zinc-blende lattice and consists of alternating layers of Cd and Te which are parallel to the (001) surface of the crystal. In the bulk, each of these layers forms a regular square lattice, cf. Figure 1. Cd atoms are bound to two neighboring Te atoms in the layer below with bonds oriented along the direction, which will be termed -direction for short. Accordingly, Te is always bound to two underlying Cd along the or -direction.
Under vacuum conditions and in absence of particle deposition, the CdTe(001) surface is terminated by a Cd-layer with limited coverage . At low temperatures one finds a dominant vacancy structure, which corresponds to a checkerboard like occupation of the available square lattice sites. Above the surface is dominated by a local ordering where the Cd atoms arrange in rows along the or -direction which alternate with empty rows. Despite the fact that significant sublimation sets in even below , the temperature driven re-ordering of the Cd-terminated surface has been discussed in terms of a phase transition in effective equilibrium. neureiter ; cibert ; epl ; flat
Electron counting rules,pashley and density functional theory (DFT) calculations garcia ; park ; gundel show that the simultaneous occupation of nearest neighbor (NN) sites in the -direction should be extremely unlikely within a terminating Cd layer. Such pairs of NN-Cd would lead to an unfavorable local concentration of positive charges. Note that in both the above mentioned arrangements NN pairs of Cd-atoms in -direction do not occur, indeed. DFT calculations show furthermore that the ordering has a slightly lower surface energy than the competing structure. garcia ; park ; gundel
The ordered Cd-termination can be restored in the presence of a stationary Cd flux even at high .tatarenko ; cibert On the other hand, a steady deposition of Te stabilizes Te-terminated surfaces.tatarenko ; cibert At relatively small fluxes and high temperatures a coverage is observed, hence there is no vacancy structure as for Cd-terminated surfaces. The Te atoms arrange in rows of dimers along the -direction at the surface, corresponding to a reconstruction pattern.
At high flux and low temperatures Te-coverages with a surface symmetry are observed. It has been hypothesized that Te atoms form trimers,tatarenko ; cibert but the precise mechanism of binding the excess Te to the surface remains unclear.tatarenko2 The evaporation of terminating Te-layers after ending deposition has been studied in the different temperature regimes.tatarenko ; cibert ; tatarenko2 The analysis of the corresponding Arrhenius-plots supports the hypothesis of a very weak binding of excess Te.
As we will demonstrate in the following, the influence of the excess Te is of particular importance for ALE growth. One ALE cycle, i.e. a sequence of one Cd and one Te pulse, could add a complete layer of CdTe to the system, in principle. However, in a wide range of temperatures, one observes a growth rate of at most layer per ALE cycle.faschinger ; hartmann This limitation reflects the restricted coverage of Cd-terminated surfaces. Only for sufficiently low one finds the expected rate of approximately 1 layer per cycle, with a temperature driven, sudden transition from one regime to the other. faschinger ; hartmann We will explain within the framework of our model how the above mentioned presence of weakly bound Te atoms at the surface allows to overcome the limitation.
III The model
III.1 Representation of the crystal and energetics
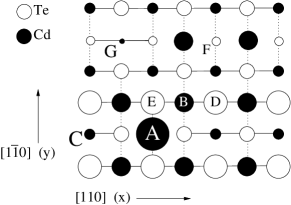
As a simplification we exclude the incorporation of defects or vacancies into the crystal. Hence, the bulk can be represented in a Solid-On-Solid (SOS) manner, cf. Figure 1. Any atom with more than two chemical binding partners, i.e. with at least one NN in the layer above, is considered immobile. When measuring the surface coverage with Cd/Te atoms we count only those atoms which are mobile.
Every Cd–Te bond in the system contributes an energy . The crystal structure is further stabilized by an effective intra-layer NN interaction of immobile particles of the same species.
Effective interactions of the mobile particles at the surface are chosen to reproduce known properties of the system, e.g. surface reconstructions. Consequently, mobile Cd and Te are treated on different footings.
As in the planar models of Refs. epl, ; flat, an infinite repulsion excludes NN pairs of mobile Cd atoms in -direction at the surface. The repulsion does not apply to pairs of one mobile and one immobile Cd, if the latter has three or four Te partners. An attractive interaction energy between mobile Cd-NN in -direction and a competing interaction between diagonal neighbors (NNN) favor the or arrangement, respectively. As demonstrated in Refs. epl, ; flat, , the temperature dependence of the Cd reconstruction is reproduced qualitatively, if we set .
NN pairs of mobile Te which do not form a dimer contribute an energy , whereas the energy is assigned to a pair which forms a dimer. Note that dimerization introduces additional degrees of freedom to the model without changing the topology of the lattice. Pairwise interactions of neighboring dimers in -direction favor their arrangement in rows along , corresponding to a surface symmetry. For NN pairs of one mobile and one immobile Te we assume the same interaction as for pairs of incorporated atoms.
In addition to Te particles at regular SOS lattice sites, we include the capture of Te atoms in a weakly bound state, denoted as Te∗ atoms in the following. The energy contribution of each Te∗ atom is where . This accounts for the fact that the binding of a Te∗ is weaker than that of an isolated mobile atom at a regular lattice site which has two Cd–Te bonds.
Following an earlier hypothesis,tatarenko ; cibert these weakly bound Te∗ might be associated with atoms which occupy Cd-sites temporarily and hence form a Te-trimer.ahrdiss But, as already mentioned in section II the precise nature of the Te∗ is still unknown. Here, we abandon the assumption of Te-trimers and instead include Te∗ particles in an effective fashion.
We introduce a reservoir of Te∗ with particles, where is the number of atoms in one complete bulk layer of Te. The total reservoir occupation is composed of two parts: . The quantity accounts for the fraction of Te∗ which are localized on top of mobile Cd and thus neutralize the infinite repulsion between Cd-NN in y-direction.ahrdiss This effect will be discussed in more detail in the next section. On the contrary, corresponds to the remaining Te∗ atoms which are highly mobile and no assumption is made about their precise location and the nature of the binding. In general, during our simulations holds for most of the time.
For the calculation of the Te coverage besides mobile Te atoms at regular lattice sites both localized and mobile Te∗ atoms are taken into account as well, i.e. includes . According to the experimentally observed range of Te-coveragescibert ; tatarenko2 the total reservoir occupation thus is restricted to values . In our model we will exclude larger values by a simple cut-off: if has reached its maximum value all processes leading to an increase of are forbidden, i.e. their rate is set to zero.
We furthermore assume that an attractive pairwise interaction of Te∗ stabilizes the reservoir. In a mean field fashion we represent the latter by an energy contribution with parameter .
In summary, the total energy of a given configuration can be written as
| (1) | |||||
which depends on the number of Cd-Te bonds (), bulk NN pairs of Cd () and Te (), NN pairs of one mobile and one immobile Te (), NN and NNN pairs of mobile Cd at the surface ( and ), and NN pairs of mobile Te not forming a dimer (). The number of Te-dimers is denoted as , whereas counts pairs of neighboring Te-dimers along the -direction. The last line in Eq. (1) accounts for the contribution of the Te∗ reservoir which is occupied by atoms.
Throughout this paper we refer to the following parameter set:
| (2) |
Note that only fixes the energy scale in the following. In addition we set formally and, hence, measure the temperature on the same scale. Later we will comment on a potential quantitative comparison with experiments.
III.2 Dynamics and growth
As we are interested in the non-equilibrium dynamics of the system under sublimation or growth conditions, specifying the energy of a given configuration is not sufficient. In fact, only the energy contribution of a few active layers which contain mobile particles will be relevant in the following. The kinetics of the system is governed by the energy barriers which have to be overcome in transitions between the different configurations.
Unfortunately, the available experimental data and first principles results are not sufficient for a systematic fit of our model parameters. In particular, reliable evaluations or estimates of, e.g., diffusion barriers are not available, apart from very few exceptions. Therefore, we do not aim at a precise quantitative description of the CdTe(001) surface at this stage.
Nevertheless, essential features can be deduced from experimental data and physical insight. Important qualitative features of the model turn out to be quite robust against variations of the parameters, as long as they comply with some essential conditions. In our simulations we will use a parameter set which is mainly based on our previous investigations of related models and their comparison with experimental findings.
In our previous studies of simpler models, appropriate choices of the parameter set enabled us to reproduce qualitatively the observed temperature dependent structure of Cd-terminated surfaces in step-flow sublimation. Furthermore, a semi-quantitative match of the re-ordering temperature, macroscopic sublimation rates etc. has been achieved, see Refs. aachen, ; ahrdiss, .
The microscopic processes considered in our Kinetic Monte Carlo (KMC) dynamics are deposition of Cd and Te adatoms, diffusion and desorption of mobile atoms, transitions of Te atoms between regular lattice sites and the reservoir, and desorption of reservoir atoms.
Deposition of Cd and Te atoms occurs with fluxes and , respectively. First, a lattice site is chosen randomly. Then, a search is performed within an incorporation radius for the site with the lowest height where adsorption is possible.ahrdiss If this is, for a Cd atom, a site with a neighboring mobile Cd atom in y-direction, adsorption is only possible if there is either a localized Te∗ on top of the Cd neighbor, already, or a mobile Te∗ attaches to the impinging Cd. This occurs with probability . For a Te atom proper adsorption sites include, besides regular Te sites, mobile Cd atoms with no localized Te∗ attached as well as empty Cd sites. In the latter two cases, the Te then becomes a mobile reservoir Te∗ with probability , whereas with probability deposition is rejected and the particle evaporates. As a consequence, the reservoir occupation is limited to values .
| process | |||
|---|---|---|---|
| Cd or Te diffusion | |||
| Cd diffusion (Te∗ involved) | |||
| Cd or Te desorption | |||
| Te Te | |||
| Te Te | |||
| Te Te | |||
| Te Te | |||
| Te desorption |
The rates for all thermally activated processes are of the Arrhenius form
| (3) |
where and denote the activation energy and attempt frequency for process , respectively. The prefactor accounts for rates which depend explicitly on the reservoir occupation (cf. Table 1). To calculate the activation energy we assume the energy of the transition state between the starting () and the final () configuration of the system to be equal to the greater of the energies and of both configurations plus an additional barrier:newman99 . The values of the barrier heights and in general are not the same but depend on the type of process . For the activation energies one obtains
| (4) |
for diffusion of mobile atoms and transitions of Te atoms between regular lattice sites and reservoir states with the energy change given by Eq. (1). Diffusion includes moves to available NN or NNN sites in the same layer, as well as hops across terrace edges, cf. Figure 1. For all diffusion steps we set in Eq. (4) with barrier , similar to Refs. aachen, ; ahrdiss, . On the contrary, the assumption that Te∗ atoms in the reservoir are less strongly bound implies and for the transition of a Te atom into the reservoir and, conversely, and for the opposite process (cf. Table 1).
Desorption of atoms from regular lattice sites or mobile Te∗ requires an activation energy . We consider only desorption of single atoms, neglecting the fact that Te probably evaporates from the surface in the form of Te2 molecules, in reality.
For all diffusion processes and the desorption of mobile atoms at regular surface sites we assume an attempt frequency , whereas a lower frequency is used for the transition of Te∗ atoms to regular Te states and the evaporation of mobile Te∗.
This choice is based on the reasonable assumption that Te∗ atoms reside in potential energy minima which are much shallower than those for Te atoms at regular surface sites.zangwill According to transition state theory the attempt frequency which corresponds to the harmonic oscillation frequency at the local energy minimum will become smaller.tst A similar argument was used by Itoh itoh01 in order to motivate an attempt frequency of weakly bound arsenic as low as . In our simulations, we will also set . This choice is further motivated by comparison with experimental observations as discussed in the following section.
The formation or breaking of dimers from NN pairs of mobile Te atoms is taken into account implicitly. A diffusion hop of a Cd atom onto a Te dimer, for instance, requires the breaking of the dimer which has to be considered in the energy balance of the process. The deposition of a Cd atom will always break all underlying Te dimers involved.
On the other hand, dimer formation is assumed to occur instantaneously, whenever it is possible due to the resulting energy gain. A similar simplification was used in Ref. barnett, for the description of Si-dimerization on Si(001) surfaces. Hence, if any event results in two un-dimerized Te atoms which are in the correct configuration for forming a dimer pair, a dimer bond will be created immediately. For diffusion and desorption events, dimer formation will be accounted for in .
The existence of a weakly bound state for Te atoms is essential to facilitate growth in our model. Consider a Cd-terminated surface with reconstruction and maximum coverage : clearly, deposition of Te at a regular lattice site would violate the SOS condition. On the other hand, the incorporation of additional Cd is impossible due to the infinite repulsion of NN neighbors in -direction.
It is plausible to assume, however, that an additional Te bound to a Cd would neutralize the repulsion as it provides three negatively charged dangling bonds. In our model, mobile Cd can hop to empty sites neighboring another mobile Cd in -direction, provided there is either already a Te∗ localized on top of the neighboring Cd, or a mobile Te∗ attaches to the diffusing particle. This Te∗ then would become localized itself. The latter scenario is assumed to happen with a probability which is reflected in the prefactor of the corresponding rate (cf. Table 1).
Thus, we assume that mobile Te∗ which are not attached to Cd atoms are available instantaneously everywhere at the surface. Note that after the diffusion step the reservoir occupation remains the same but the ratio has increased. If at any point of the simulation a localized Te∗ is no longer needed because for example the underlying Cd atom has evaporated, it will become a mobile Te∗ again. Through the mediation of Te∗ atoms, Cd atoms at the surface can coalesce into islands in spite of the NN repulsion, provided the reservoir of Te∗ is not empty.
In our simulations we consider also transitions of Te between regular lattice sites and reservoir states as well as the desorption of mobile Te∗ into the vacuum. In general, the rates of these processes depend on the reservoir occupation, i.e. (cf. Table 1). For instance a mobile Te at the surface may become a mobile Te∗ provided the reservoir is not fully occupied. This happens with a rate according to Eq. (3) with which is zero if the reservoir density has reached its maximum value . Conversely, the transition of a mobile Te∗ to a regular Te state is proportional to the density of mobile Te∗ atoms. Localized Te∗ atoms which are on top of Cd atoms in order to neutralize the infinite repulsion may become bound at one of the two neighboring regular Te sites, if available, thus reducing the density .
The results presented in the following sections were obtained in simulations with energy parameters according to Eq. (III.1) and the following barriers and frequencies:
| (5) |
IV Simulations and results
IV.1 The reservoir of excess Te∗
Before presenting results of the ALE simulations we discuss the properties of the Te∗ reservoir in greater detail. In our model, the occupation results from the complex interplay of deposition, evaporation and transitions between Te∗ and Te states. However, the basic temperature dependence of can be understood from considering a flat surface in the presence of a steady flux of Te atoms.
After the Te coverage has reached the value , only deposition directly into the reservoir is possible. If we neglect the desorption of regular Te from the surface and transitions of the type Te Te∗, the temporal evolution of is governed by the balance of direct deposition and evaporation of Te∗. The rate of the latter is a function of itself and one obtains the following simplifying ODE:
| (6) |
Whereas the Te flux increases , desorption of Te∗ occurs with a frequency proportional to multiplied with the Arrhenius rate for single particle evaporation from the reservoir. Clearly, the filling of the reservoir must saturate at . However, the precise nature of the saturation process is not essential for the following arguments and we choose a simple cut-off represented by the Heaviside-function .
Given and , the right hand side in Eq. (6) is positive for all if the temperature is low enough. Hence, the reservoir will be filled in this case. Above a characteristic temperature the r.h.s. displays two zeros at fairly small values of . As a consequence, the differential equation has an attractive fixed point with a stationary value for .
Figure 2 (left) shows as function of for the choice of parameters and . There is a rapid increase of for very low values of which becomes weaker and weaker for higher fluxes. With we obtain , as an example, and at the stationary occupation is as low as . Hence, starting from , the reservoir cannot be filled significantly for . The behavior predicted from Eq. (6) is in excellent agreement with simulations of the situation in the full model. We would like to mention that in Ref. faschinger, a simple evaporation model of ALE growth was proposed which produces a flux-dependence of the characteristic temperature which is similar to the one in Figure 2 (left).
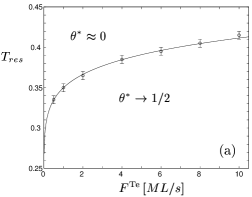
(a) The temperature above which an initially empty reservoir of Te∗ cannot be filled. The curve shows the result as obtained from Eq. (6). Additionally, symbols indicate the temperature where the growth rate drops from to CdTe per ALE cycle in the KMC simulations (cf. section IV.2).
(b) Sublimation of Te∗ from an initially filled reservoir for three different temperatures. Solid lines represent the numerical integration of Eq. (6) with , symbols correspond to simulations of the situation in the full model.
The simplified Eq. (6) is also useful in investigating the initial sublimation of Te∗ from a surface with maximum coverage , i.e. . Figure 2 (right) displays the evolution of for and three different temperatures as obtained from the numerical integration of (6) with . The results from simulations of the corresponding situation in the full kinetic model are again in excellent agreement with the simplified description, which neglects evaporation of regular Te and other processes.
One obtains a well-defined characteristic time for the decrease of from to, say, . The precise value of is of little relevance as decreases to zero very rapidly, cf. Figure 2 (right panel). The temperature dependence of is very well described by an Arrhenius law of the form with macroscopic activation energy and prefactor . In Refs. tatarenko, ; cibert, experimental data is discussed for the initial sublimation of Te starting from coverage . There, the macroscopic activation energy is reported to be , providing a potential reference point for attempting a quantitative fit of the model.
Note that the prefactor obtained from Fig. 2 (right) is not too different from the time constant assumed for Te∗ desorption. This should be expected, as the latter is the limiting microscopic process of the scenario. In a naive attempt to extract the prefactor from an analogous Arrhenius plot of experimental data tatarenko we obtain a value of about the same order, i.e. . On the contrary, the value from data for Cd desorption tatarenko corresponds to frequencies which are larger by orders of magnitude. Of course, a reliable determination of prefactors from experimental data for relatively small temperature ranges is questionable if not impossible (and was not attempted by the authors of Ref. tatarenko, ). Nevertheless one might interpret the very rough comparison as another qualitative justification for choosing much smaller than other frequencies in the model.
IV.2 ALE growth
In order to gain a qualitative understanding of the ALE growth scenario we perform simulations with the parameter set specified in Eqs. (III.1,5). All simulation results presented here were obtained from systems with Cd and Te atoms in a bulk layer, averaged over independent runs.
We model a situation in which Cd and Te are deposited in alternate pulses of length , each with a constant flux . The pulses are separated by a dead time of , hence, the duration of one complete ALE cycle is in total. Note that the characteristic time for reservoir sublimation is large compared with the dead time interval for all relevant temperatures. In the results discussed here, the initial surface was perfectly flat and Te-terminated with coverage , . Deposition always started with a Cd pulse.
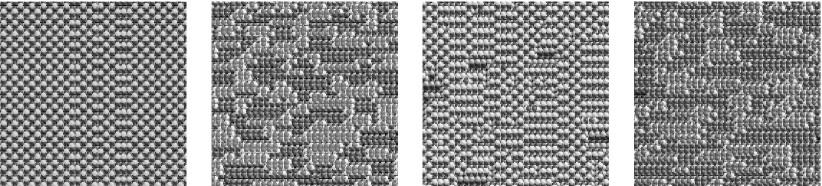
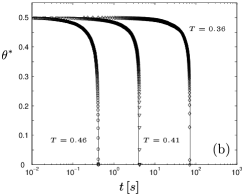
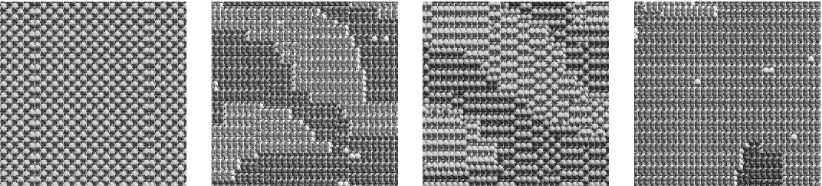
Illustrating surface snapshots of growing surfaces are shown in Figures 3 and 4 for the two different growth regimes discussed in the following. Additional illustrations and mpeg-movies are available from our web pages.web
At fairly high temperatures, growth proceeds according to the following scenario in our simulations:
-
I)
The first Cd pulse adds half a layer of Cd to the system. The infinite repulsion of NN in -direction prevents coverages . The predominant arrangement of Cd atoms is in a local ordering, i.e. a checkerboard pattern. The contribution of the row structure as a thermal excitation increases with higher T.
-
II)
After the first Te pulse and the dead time, half a layer of Te has been incorporated. Diffusion of particles leads to the formation of islands upon the Te-terminated surface. Note that the existence of the Te∗-reservoir state is crucial for this process, as discussed above. Surface Te atoms form dimers, preferentially, and these arrange in rows along the -direction, yielding a predominant symmetry of the surface. Although incorporation of Te occurs to a considerable degree through the reservoir state Te∗, at the end of the dead time one finds , as discussed above.
-
III)
The second Cd pulse places mobile atoms on top of existing islands and in between. The pre-dominant local ordering is the pattern, i.e. rows of Cd alternating with empty rows. This is due to the influence of the island edges on the reconstruction, see Refs. aachen, ; surflett, ; ahrdiss, for a discussion of an analogous effect in layer by layer sublimation. At the end of the dead time, the islands from stage II are still present but now they are Cd-terminated.
-
IV)
During the second Te pulse, atoms are deposited onto the Cd-terminated islands and in between. The particles rearrange by means of diffusion, leveling off the islands and forming a flat Te-terminated surface. At the end of the dead time, the initial state of the system is restored with one complete layer of CdTe added to the system. In the simulations the filling of gaps is incomplete to a degree which depends on the temperature and the length of the dead time interval.
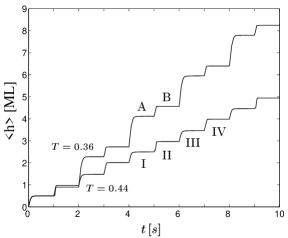
Hence, at temperatures , our model reproduces ALE growth in the same double cycle sequence which was hypothesized and discussed for CdTe and ZnTe in the literature, see Refs. cibert, ; tatarenko2, and references therein. Figure 5 shows the evolution of the film height with time in the ALE process at , which is well above the characteristic obtained for .
The picture changes qualitatively for temperatures . Again, a flat Te-terminated surface with coverage , was prepared, and the deposition started with a Cd pulse. The surface structures obtained after the first Cd and Te pulse are very much alike the ones of stages I and II of the high temperature scenario, since initially the Te∗ reservoir was empty. Note however, that due to a decreased mobility of the atoms the islands on the Te terminated surface are less compact. Since , at the end of the Te pulse the surface is not only Te terminated but also the Te∗ reservoir is filled, i.e. .
Thus, from this point on the ALE growth scenario proceeds along the following lines in our model:
-
A)
The Cd pulse places atoms onto the islands and in between which is analogous to stage III of the high temperature scenario. But now Cd particles at the surface can coalesce, because Te∗ from the reservoir are available to neutralize the NN repulsion of mobile Cd in -direction. Therefore the gaps between the islands are leveled out by half a monolayer of Cd atoms and the reservoir which provides also approx. monolayer of Te. The surface is then covered by another half layer of Cd atoms arranging preferentially in a vacancy structure. Thus, the adsorption of one complete monolayer of Cd and a half monolayer of Te which came from the reservoir leads to an increase of the surface height by of a complete CdTe layer. At the end of step A) the reservoir is empty.
-
B)
The following Te pulse leads to a Te terminated surface with islands, which is identical to the one described above. Again, due to low temperature and short dead time, also the Te∗ reservoir is filled. Hence, another half monolayer of Te is adsorbed and in total one complete layer of CdTe added in only one ALE cycle. At the end of step B) the reservoir has reached its maximum occupation.
As an example, Figure 5 shows the evolution of the mean surface height with time at , i.e. below for . Note that for the first Cd and Te pulse, the curve is essentially identical with that of the high regime, because in both simulations the reservoir was empty, initially. Hence the upper curve of Figure 5 corresponds to the sequence of stages A/B only for times . The mean height as displayed in Figure 5 increases by of a complete CdTe layer during the Cd pulse A) because takes into account only particles at SOS lattice sites, disregarding the Te∗ reservoir.
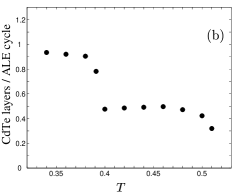
From simulations for different temperatures we have obtained the average growth rate per ALE cycle. Figure 6(b) shows that, with increasing , the growth rate drops very rapidly in the vicinity of the characteristic as obtained from the considerations of section IV.1. The comparison with Figure 6(a) shows qualitative agreement with experimental results for an analogous growth scenario.faschinger Very similar data has been published by Hartmann et al.hartmann and is also discussed in Ref. cibert, . Note that in both experiments growth rates above 1 layer of CdTe per ALE cycle were observed at very low temperatures. This is presumably due to the formation of Cd crystallites at the surface and cannot be reproduced in our model.tatarenko2
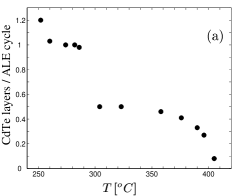
(a) Experimentally observed growth rates of CdTe(001) as published by Faschinger and Sitter, plot generated after Fig. 3 in Ref. faschinger, . The pulse duration was with a total deposition of 1.5 layers of each element, followed by dead time intervals of length . The most prominent feature is the sudden decrease of the growth rate at . One additional data point has been omitted here (growth rate 1.4 layers per cycle at 230).
(b) Average growth rate in our simulations with parameters as in Fig. 5 for different temperatures. is measured in dimensionless units of . The growth rate drops at for .
The temperature driven break-down of the growth rate is due to the fact that the reservoir cannot be filled significantly for . Simulation results for various values of the flux strongly support this assumption as can be seen from Figure 2 (left): the symbols which indicate the temperature where the growth rate drops in the simulations lie almost exactly on the curve that marks .
In principle, the re-evaporation of Te∗ during the dead time interval could be an alternative cause for the reduced growth rate. Note, however, that even for a flux as high as with , one finds that the characteristic time for reservoir sublimation is , cf. Figure 2 (right panel). Hence, it appears safe to say that during dead time intervals shorter than, say, , will remain close to the maximum value , provided all other conditions allow for the filling of the reservoir during a Te pulse.
As a consequence, we expect that the characteristic
value of which marks the drop
of the growth rate in Figure 6 should be essentially
independent of the pulse duration or dead time interval
within a wide range of reasonable values.
Comparing the experimental results by Hartmann et al.hartmann and Faschinger and Sitterfaschinger for the ALE growth rate one finds that for the latter the temperature where the growth rate drops to approx. layers of CdTe per cycle is shifted to higher temperatures by about . Within the framework of our model this can be explained if one takes into account the different experimental conditions. Whereas Hartmann et al. combined particle fluxes of about with pulse time and dead times, the flux used by Faschinger and Sitter was with a pulse duration of and a dead time of . As discussed above, the difference of the dead times can be neglected, but for the given fluxes one reads off from Fig. 2 (left) a significant increase of by about . As demonstrated, practically coincides with the temperature where the growth rate drops which consequently is expected to increase by the same amount. The difference of the absolute temperatures observed in Refs. hartmann, and faschinger, is about (of the lower one) which is indeed comparable with our results.
For very high , sublimation of the crystal dominates over the incoming flux and growth becomes impossible. The ALE growth rate vanishes at a temperature which is essentially independent of the properties of Te∗ atoms.
V Summary and Outlook
In summary, we have presented a detailed lattice gas model of II-VI semiconductor compounds. In contrast to many simpler growth models, it takes into account the correct zinc-blende lattice as well as essential, material specific effects which have been discussed in terms of the CdTe(001) surface, as an example. The model reproduces, for instance, the reconstruction of Cd-terminated surfaces by means of vacancy structures and its dependency on temperature and flux. This includes the temperature driven transition from the reconstructed surface to a disordered state with local ordering. This re-arrangement of the surface is observed under step flow sublimation, as demonstrated earlier in Refs. aachen, ; surflett, , and a semi-quantitative agreement with experimental data can be achieved.
Here, in addition, the dimerization of Te at the surface is introduced to the model. Thus, the reconstruction of Te-terminated surfaces is reproduced. We demonstrate furthermore that the presence of weakly bound Te∗ atoms is necessary to facilitate growth by, e.g., atomic layer epitaxy. Although the precise nature of such a weakly bound Te∗ state at the surface is unknown, its existence is clearly evident from various experimental observations.cibert ; tatarenko2
By means of Kinetic Monte Carlo simulations of our model we show that the reservoir of Te∗ also explains the experimentally observed temperature dependence of the ALE growth rates. Only below a characteristic temperature a significant amount of Te∗ is present and facilitates growth rates of approximately layer of CdTe per ALE cycle. As in the corresponding experiments, we observe a sudden transition from the self-limited growth rate of about layer per ALE cycle at high to the low temperature regime with a rate close to complete layer per cycle.
Our analysis shows that the characteristic transition temperature should depend only weakly on the model (or experimental) parameters within a wide range of reasonable choices. The key dependence is on the particle flux during Cd and Te pulses, respectively, and our model reproduces its effect on the transition qualitatively correct.
As an attempt towards a more quantitative comparison with experiments, one might identify the temperature for a flux of in our model (cf. Fig 2) with the experimental value by Faschinger et al.faschinger Thus, the energy scale may be fixed, and we obtain, for example, a value of for the macroscopic activation energy for desorption of Te∗ atoms which roughly agrees with the experimentally determined .tatarenko ; cibert Furthermore, the value of for our simulations with translates into which agrees well with results of the simple evaporation model from Ref. faschinger, .
We thus believe, that, in principle, our model offers the potential for a quantitative match with experimental data. In simpler versions of the model it was possible to reproduce the temperature dependence of the surface reconstruction as well as macroscopic sublimation rates on a semiquantitative level.aachen The larger number of parameters in the current extension, however, requires further input from experiment. Moreover, we hope to obtain reliable estimates of microscopic activation barriers from first principle quantum chemical calculations as are already available for III-VI semiconductors.grosseprb ; grosseprl Such calculations will be extremely useful and should also shed light on the nature of the weakly bound Te∗ states on the surface.
Acknowledgements.
We would like to thank S. Tatarenko for useful discussions. This project was supported by the Deutsche Forschungsgemeinschaft through Sonderforschungsbereich 410.References
- (1) A. Pimpinelli and J. Villain, Physics of Crystal Growth, (Cambridge University Press, Cambridge, 1998).
- (2) M. Kotrla, N.I. Papanicolaou, D.D. Vvedensky, and L.T. Wille (eds.), Atomistic Aspects of Epitaxial Growth, Kluwer (2002).
- (3) J. Gutowski, H. Heinke, D. Hommel, and P. Michler (eds.), Proceedings of the Tenth International Conference on II-VI Compounds, Phys. Stat. Sol. (b) 220, No. 1-2 (2002).
- (4) S. Tatarenko, B. Daudin, D. Brun, V.H. Etgens, M.B. Veron, Phys. Rev. B 50, 18479 (1994).
- (5) H. Neureiter, S. Tatarenko, S. Spranger, M. Sokolowski, Phys. Rev. B 62, 2542 (2000).
- (6) W. Faschinger and H. Sitter, J. Cryst. Growth 99, 566 (1990).
- (7) J.M. Hartmann, G. Feuillet, M. Charleux, and H. Mariette, J. Appl. Phys. 79, 3035 (1996).
- (8) J. Cibert, S. Tatarenko, Defect and Diffusion Forum 150-151, 1 (1997), and references therein.
- (9) K. Saminadayar, S. Tatarenko, K. Kheng, V. Huard, and D. Martrou, in Handbook of Advanced Electronic and Photonic Materials and Devices, edited by H.S. Nalwa (Academic Press, New York, 2001), Vol. 1, pg. 2.
- (10) M. Biehl, M. Ahr, W. Kinzel, M. Sokolowski, T. Volkmann, Europhys. Lett. 53, 169 (2001).
- (11) M. Ahr and M. Biehl, Surf. Sci. 505, 124 (2002).
- (12) M.D. Pashley, Phys. Rev. B 40, 10481 (1989).
- (13) A. Garcia and J. Northrup, J. Vac. Sci. Technol. B 12, 2678 (1994).
- (14) C.H. Park and D.J. Chadi, Phys. Rev. B 49, 16467 (1994).
- (15) S. Gundel, A. Fleszar, W. Faschinger, and W. Hanke, Phys. Rev. B 59, 15261 (1999), and S. Gundel, Diploma Thesis, Universität Würzburg, 1997.
- (16) M. Ahr, M. Biehl, and T. Volkmann, Comp. Phys. Comm. 147, 107 (2002).
- (17) M. Ahr and M. Biehl, Surf. Sci. Lett. 488, L553 (2001).
- (18) M. Ahr, Ph.D. thesis, Universität Würzburg, 2002, available at http://arxiv.org/abs/cond-mat/0211581.
- (19) M. Itoh, G.R. Bell, A.R. Avery, T.S. Jones, B.A. Joyce, and D.D. Vvedensky, Phys. Rev. Lett. 81, 633 (1998).
- (20) M. Itoh, Prog. Surf. Sci. 66, 53 (2001).
- (21) F. Grosse and M.F. Gyure, Phys. Rev. B 66, 075320 (2002).
- (22) F. Grosse, W. Barvosa-Carter, J. Zinck, M. Wheeler, and M.F. Gyure, Phys. Rev. Lett. 89, 116102 (2002).
- (23) S.A. Barnett and A. Rockett, Surf. Sci. 198, 133 (1988).
- (24) A. Zangwill, Physics at Surfaces (Cambridge University Press, Cambridge, 1988).
- (25) F. Jensen, Introduction to Computational Chemistry (Wiley, New York, 1999).
- (26) M.E.J. Newman and G.T. Barkema, Monte Carlo Methods in Statistical Physics (Clarendon Press, Oxford, 1999).
-
(27)
Illustrating images and mpeg-movies are available at
http://theorie.physik.uni-wuerzburg.de/~volkmann{~biehl}.