A metallic phase in lightly doped La2-xSrxCuO4 observed by electron paramagnetic resonance
Abstract
In the low doping range of from 0.01 to 0.06 in La2-xSrxCuO4, a narrow electron paramagnetic resonance (EPR) line has been investigated. This line is distinct from the known broad line, both due to probing Mn2+ ions. The narrow line is ascribed to metallic regions in the material, and its intensity increases exponentially upon cooling below 150 K. The activation energy deduced = 460(50) K is nearly the same as that found in the doped superconducting regime by Raman and neutron scattering. The intensity of the narrow EPR line follows the same temperature dependence as the resistivity anisotropy in lightly doped La2-xSrxCuO4 single crystals.
pacs:
74.25.Dw, 74.72.Dn, 74.20.Mn, 76.30.-vThe generic phase diagram in hole-doped cuprates is by now well established. At a critical concentration of doping 0.06, superconductivity sets in at = 0, and ends at a higher doping level 0.25 Tallon . Both are the critical endpoints of the superconducting phase- transition line Schneider . At the former, a transition from an insulating to the superconducting state has been assumed untill very recently Schneider . However, using finite-size scaling for the susceptibility of a series of concentrations , the following was inferred: The material consists of antiferromagnetic (AF) domains of variable size, separated by metallic domain walls Johnston . More recently Ando et al. corroborated this early finding by measuring the in-plane resistivity anisotropy in untwinned single crystals of La2-xSrxCuO4 (LSCO) and YBa2Cu3O7-δ (YBCO) in the lightly doped region, interpreting their results in terms of metallic stripes present Ando1 . Previouse electron paramagnetic resonance (EPR) measurements in LSCO at revealed in addition to a broad EPR line observed in the entire doping range Alika1 , a narrow line Alika2 . It was interpreted as stemming from a metallic phase distinct from the volume in which the broader line is due to. The latter showed a clear isotope effect in its linewidth Alika1 ; Alika2 , the narrow one did not. In the present letter, we describe a thorough EPR investigation of the behavior of the narrow line for concentrations 0.01 0.06, i.e. below . Of special interest is the exponential increase of the narrow-line intensity upon cooling. The activation energy inferred is nearly the same as that deduced from other experiments for the formation of bipolarons Bipolaron , pointing to the origin of the metallic stripes present.
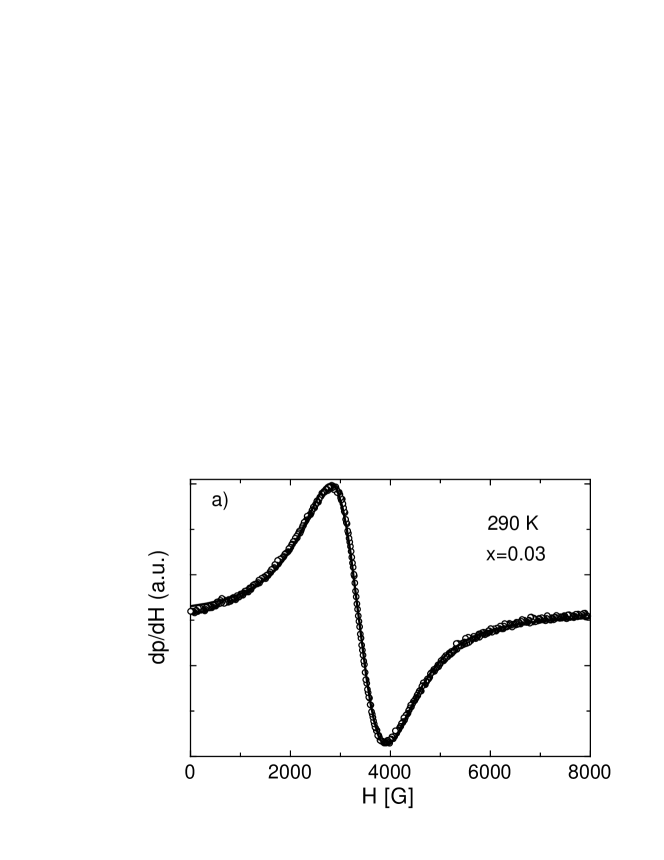
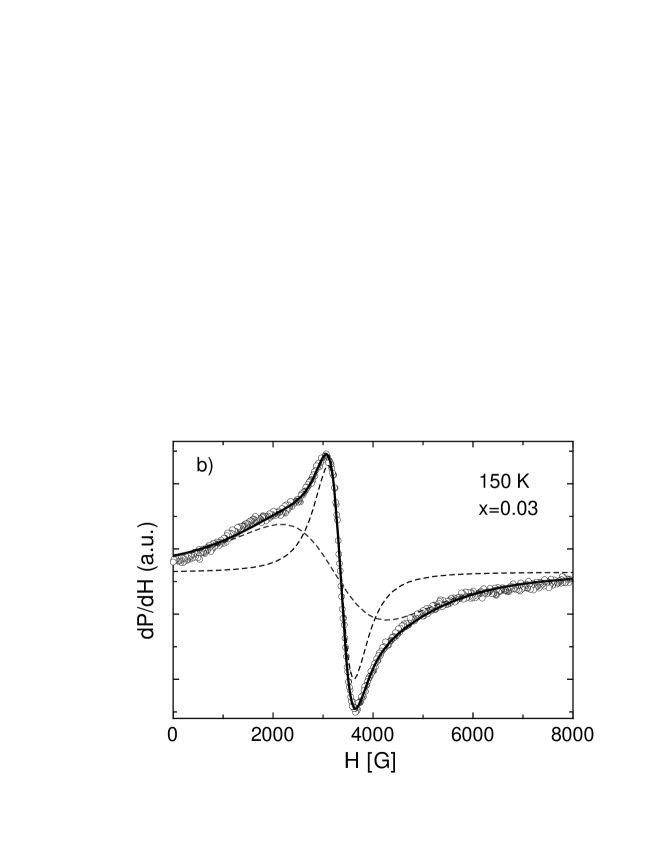
The La2-xSrxCu0.98Mn0.02O4 polycrystalline samples with 0x0.06 were prepared by the standard solid-state reaction method. The EPR measurements were performed at 9.4 GHz using a BRUKER ER-200D spectrometer equipped with an Oxford Instruments helium flow cryostat. In order to avoid a signal distortion due to skin effects, the samples were ground and the powder was suspended in paraffin. We observed an EPR signal in all samples. The signal is centered near , a value very close to the -factor for the Mn2+ ion. Figure 1 shows typical EPR spectra for an = 0.03 sample at two different temperatures. One can see that at 290 K only a single EPR line of Lorentzian shape is observed. However, with decreasing temperature a second line appears (see Fig. 1 (b)), and the EPR spectra can be well fitted by a sum of two Lorentzian lines with different linewidths: a narrow and a broad one. Figure 2 presents the temperature dependence of the linewidths of the two signals. Similar two-component EPR spectra were observed in other samples with different Sr concentrations up to = 0.06. At = 0.06, only a single EPR line is seen in the entire temperature range, in agreement with our previous studies of samples with 0.06 0.20 Alika1 .
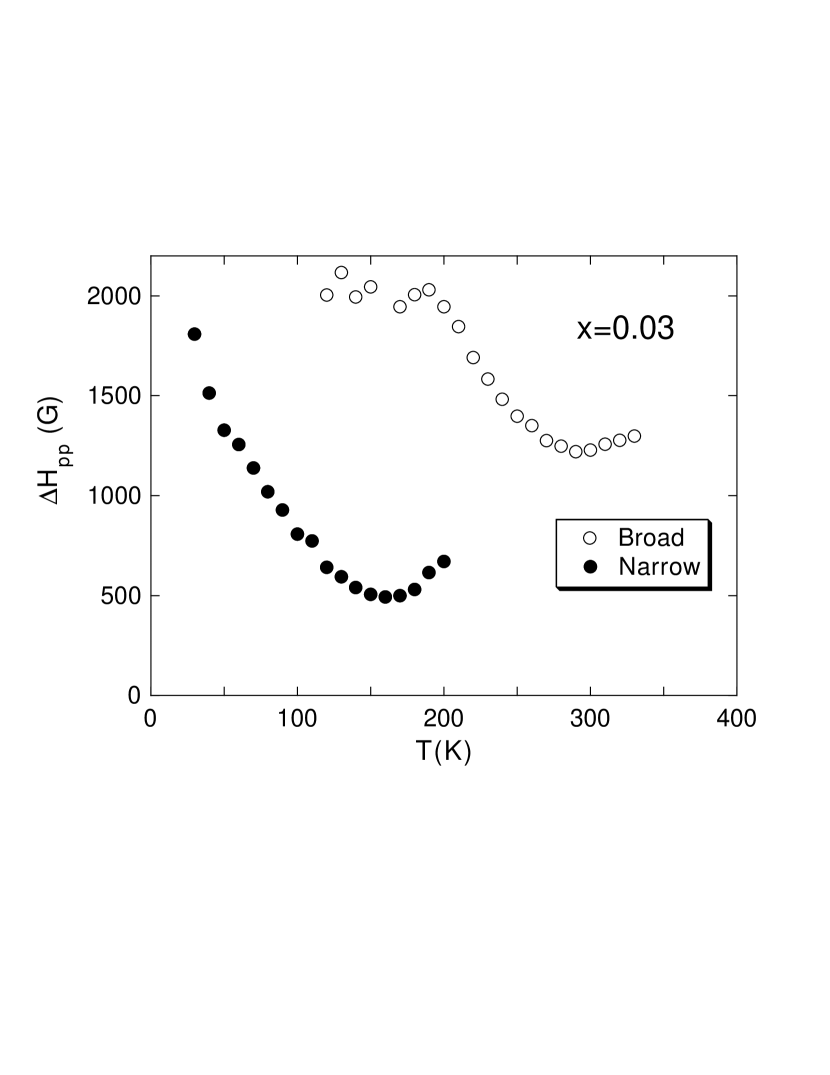
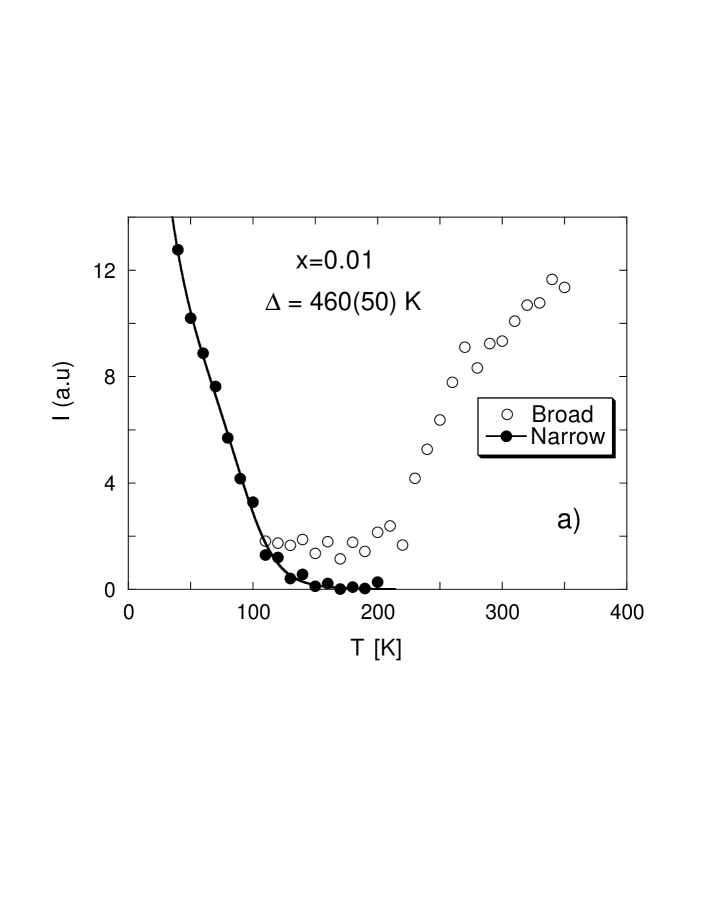
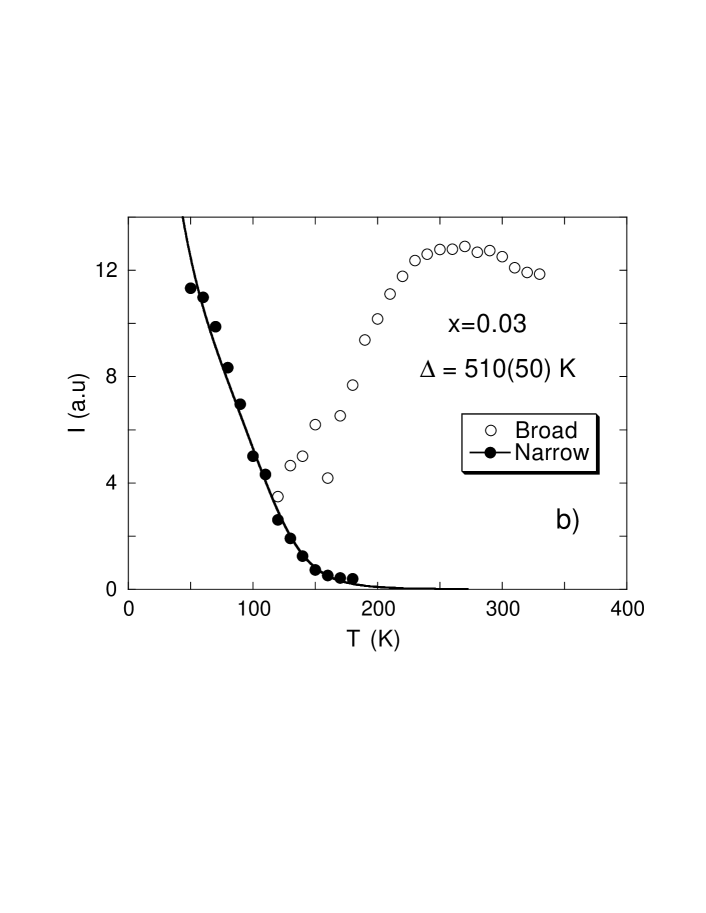
Figure 3 shows the temperature dependence of the EPR intensity for samples with different Sr concentrations. One can see that the two components observed for samples below = 0.06 follow a completely different temperature dependence. The intensity of the broad component strongly decreases with decreasing temperature. On the other hand, the intensity of the narrow component is negligible at high temperatures and starts to increase substantially below 150 K. We note that the temperature below which the intensity of the broad line decreases shifts to lower temperatures with increasing doping. However, the dependence for the narrow line is practically doping-independent. It starts to increase almost exponentially below 150 K. A similar tendency is observed also for the temperature dependence of the EPR linewidth. The linewidth of the broad component and its temperature dependence are strongly doping-dependent, whereas the linewidth of the narrow component is very similar for all samples with different Sr doping.
It is important to point out that the observed two-component EPR spectra are an intrinsic property of the lightly doped LSCO and are not due to conventional chemical phase separation. We examined our samples using x-ray diffraction, and detected no impurity phases. Moreover, the temperature dependence of the relative intensities of the two EPR signals rules out macroscopic inhomogeneities and points towards a microscopic electronic phase separation. The qualitatively different behavior of the broad and narrow EPR signals indicates that they belong to distinct regions in the sample. First we notice that the broad line vanishes at low temperatures. This can be explained by taking into account the AF order present in samples with very low Sr concentration Johnston . It is expected that upon approaching the AF ordering temperature, a strong shift of the resonance frequency and an increase of the relaxation rate of the Cu spin system will occur. This will break the bottleneck regime of the Mn2+ ions, and as a consequence the EPR signal becomes unobservable Alika1 .
In contrast to the broad line, the narrow signal appears at low temperatures and its intensity increases with decreasing temperature. This indicates that the narrow signal is due to the regions where the AF order is supressed. It is known that the AF order is destroyed by the doped holes, and above = 0.06 AF fluctuations are much less pronounced Niedermayer . Therefore, it is natural to relate the narrow line to regions with locally high carrier concentration and high mobility. This assumption is strongly supported by the absence of an oxygen isotope effect on the linewidth of the narrow line as well Alika2 . It was shown previously that the isotope effect on the linewidth decreases at high charge-carrier concentrations close to the optimum doping Alika1 . We obtain another important indication from the temperature dependence of the EPR intensity. Because we relate the narrow line to hole-rich regions, an exponential increase of its intensity at low temperatures indicates an energy gap for the existence of these regions. In the following we will argue that this phase separation is assisted by the electron-phonon coupling. More precisely, the latter induces anisotropic interactions between the holes via the phonon exchange, resulting in the creation of extended nano-scale hole-rich regions.
It was shown that the interaction between holes via the phonon exchange reduces to usual elastic forces if we neglect the retardation effects and optical modes Aminov . In this case the interaction between the holes is highly anisotropic, being attractive for some orientations and repulsive for others Kochelaev . The attraction between holes may result in a bipolaron formation when holes approach each other closely enough. The bipolaron formation can be a starting point for the creation of hole-rich regions by attracting of additional holes. Because of the highly anisotropic elastic forces these regions are expected to have the form of stripes. Therefore the bipolaron formation energy can be considered as an energy gap for the formation of hole-rich regions. In applying this model to the interpretation of our EPR results we have to keep in mind that the spin dynamics of the coupled Mn-Cu system experiences a strong bottleneck regime Elshner . In a bottleneck regime, the EPR linewidth of the joint signal is controlled mainly by the spin relaxation rate of the Cu spin-system, and the EPR intensity is proportional to the sum of spin susceptibilities Elshner . The latter results in a Curie-Weiss temperature dependence of the EPR intensity as the spin susceptibility of Mn is much larger than that of the strongly correlated Cu spin system.
Taking into account this remark we conclude that the EPR intensity of the narrow line is proportional to the volume of the sample occuppied by the hole-rich regions because Mn ions are randomly distributed in the sample. We expect that in the underdoped samples the volume in question is proportional to the number of bipolarons, which can be estimated in a way used by Mihailovic and Kabanov Bipolaron . If the density of states is determined by , the number of the bipolarons is
| (1) |
where is the bipolaron formation energy, is the level of hole doping, and is a temperature- and dopig-independent parameter. The EPR intensity from the hole-rich regions will be proportional to the product of the Curie-Weiss susceptibility of the bottlenecked Mn-Cu system and the number of the bipolarons
| (2) |
The experimental points for the narrow-line intensity were fitted for the two-dimensional system (=0), and we used the value = -8 K, which was found from measurements of the static magnetic susuceptibility (an attempt to vary yielded about the same value). The parameters and were kept the same for all samples; the only free parameter was the energy gap . The results of the fit are shown in Fig. 3 (a,b). For the bipolaron formation energy we obtained =460(50) K, which is practically doping-independent. These values agree very well with the value of obtained from the analysis of inelastic neutron-scattering and Raman data in cuprate superconductors Bipolaron . Recently Kochelaev et al. performed theoretical calculations of the polaron interactions via the phonon field using the extended Hubbard model Kochelaev . They estimated the bipolaron formation energy and obtained values of 100 K 730 K, depending on the value of the Coulomb repulsion between holes on neighboring copper and oxygen sites , 0 1.2 eV. This means that the experimental value of can be understood in terms of the elastic interactions between the polarons.
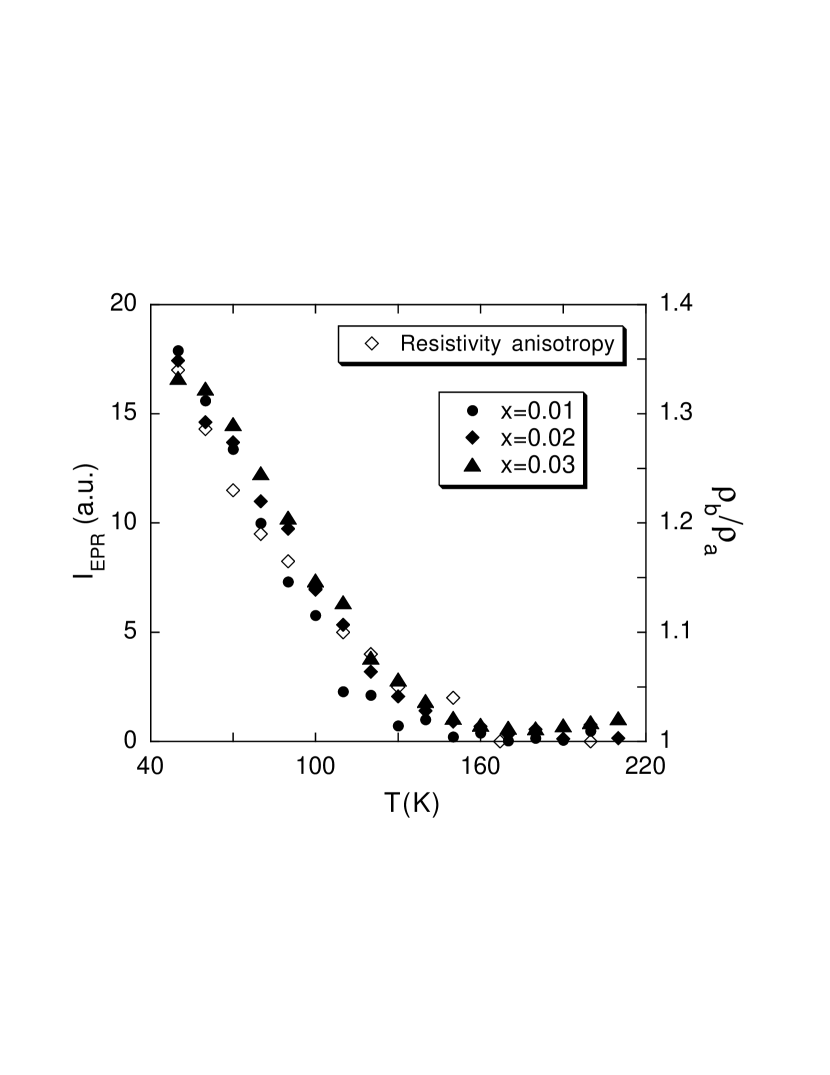
It is interesting to compare our results with other experiments performed in lightly doped LSCO. Recently Ando et al. measured the in-plane anisotropy of the resistivity in single crystals of LSCO with = 0.02-0.04 Ando1 . They found that at high temperatures the anisotropy is small, which is consistent with the weak orthorhombicity present. However, grows rapidly with decreasing temperature below 150 K. This provides macroscopic evidence that electrons self-organize into an anisotropic state because there is no other external source to cause the in-plane anisotropy in La2-xSrxCuO4. We notice that the temperature dependence of the narrow EPR line intensity is very similar to that of obtained by Ando et al. (see Fig. 2(d) in Ref. 4). To make this similarity clear, we plotted and on the same graph (see Fig. 4). It is remarkable that both quantities show very similar temperature dependences. It means that our microscopic EPR measurements and the macroscopic resistivity measurements by Ando et al. provide evidence of the same phenomenon: the formation of hole-rich metallic stripes in lightly doped LSCO well below = 0.06. This conclusion is also supported by a recent angle-resolved photoemission (ARPES) study of LSCO that clearly demonstrated that metallic quasiparticles exist near the nodal direction below =0.06 Shen .
Finally, we would like to comment on the observability of the phase separation in our EPR experiments. The main difference of the EPR signals from the hole-rich and hole-poor regions is the spin relaxation rate of the Cu spin system, which results in different EPR linewidths. One would expect these local differences of the relaxation rate to be averaged out by the spin diffusion. The spin diffusion in the CuO2 plane is expected to be very fast because of the huge exchange integral between the Cu ions. A rough estimate shows that during the Larmor period a local spin temperature can be transported over 100 Cu-Cu distances. It means that all the different nanoscale regions will relax to the lattice with a single relaxation rate, and we cannot distinguish them with EPR. However, the AF order which appears below in the hole-poor regions in lightly doped LSCO freezes the process of spin diffusion, and this is the reason we can see different EPR lines from the two types of regions. From this we expect that with increasing doping, where magnetic order gets suppressed, spin diffusion will become faster, extended, and we can no longer distinguish different regions with EPR. This is most probably what happens in samples with 0.06, where only a single EPR line is observed Alika1 . This does not mean that the phase separation in hole-rich and hole-poor regions does not exist at 0.06, but that the spin diffusion averages out the EPR response from these regions. In fact, recent Raman and infrared measurements provided evidence of one-dimensional conductivity in LSCO with = 0.10 Hackl . Also, recent ARPES measurements showed that the nodal quasiparticle spectral weight changes smoothly with doping without any anomaly at = 0.06 Shen , indicating that the electronic phase separation exists also at higher doping levels.
In summary, EPR measurements in lightly doped LSCO revealed the presense of two resonance signals: a narrow and a broad one. Their behavior indicates that the narrow signal is due to hole-rich metallic regions and the broad signal due to hole-poor AF regions. The narrow-line intensity is small at high temperatures and increases exponentially below 150 K. The activation energy inferred, = 460(50) K, is nearly the same as that deduced from other experiments for the formation of bipolarons, pointing to the origin of the metallic stripes present. We found a remarkable similarity between the temperature dependences of the narrow-line intensity and recently measured resistivity anisotropy in CuO2 planes in lightly doped LSCO Ando1 . The results obtained provide the first magnetic resonance evidence of the formation of hole-rich metallic stripes in lightly doped LSCO well below = 0.06.
This work is supported by SNSF under the grant IP7-, BIK and AS are partially supported by INTAS-01-0654 and CRDF REC-007.
References
- (1) J. F. Tallon et al., Phys. Rev. B 51, 12911 (1995).
- (2) See, e.g., T. Schneider, The Physics of Conventional and Unconventional Superconductors, edited by K. H. Bennemann and J. B. Ketterson (Springer Verlag, Berlin, 2003).
- (3) J. H. Cho et al., Phys. Rev. Lett. 70, 222 (1993).
- (4) Y. Ando et al., Phys. Rev. Lett. 88, 137005 (2002).
- (5) A. Shengelaya et al., Phys. Rev. B 63, 144513 (2001).
- (6) A. Shengelaya et al., J. Supercond, 13, 955 (2000).
- (7) V. V. Kabanov and D. Mihailovic, Phys. Rev. B65, 212508 (2002).
- (8) Ch. Niedermayer et al., Phys. Rev. Lett. 80, 3843 (1998).
- (9) L. K. Aminov and B. I. Kochelaev, Zh. Eksp. Theor. Fiz. 42, 1303 (1962).
- (10) B. I. Kochelaev et al., Mod. Phys. Lett. B 17, 415 (2003).
- (11) B. I. Kochelaev et al., Phys. Rev. B 49, 13106 (1994).
- (12) T. Yoshida et al., Phys. Rev. Lett. 91, 027001 (2003).
- (13) F. Venturini et al., Phys. Rev. B 66, R060502 (2002).