Polymer-Induced Bundling of F-actin and the Depletion Force
Abstract
The inert polymer polyethylene glycol (PEG) induces a ”bundling” phenomenon in F-actin solutions when its concentration exceeds a critical onset value . Over a limited range of PEG molecular weight and ionic strength, can be expressed as a function of these two variables. The process is reversible, but hysteresis is also observed in the dissolution of the bundles, with ionic strength having a large influence. Additional actin filaments are able to join previously formed bundles. PEG polymers are not incorporated into the actin bundles.
Estimates of the Asakura-Oosawa depletion force, Coulomb repulsion, and van der Waals potential are combined in order to explain the bundling effect and hysteresis. Conjectures are presented concerning the apparent limit in bundle size.
pacs:
87.16.Ka, 82.35.Rs, 82.35.Pq, 61.25.HqI Introduction
Cells and tissues are crowded with macromolecules such as proteins, DNA, and various polymers. While the ligand-substrate specific binding model forms the central dogma of biochemistry, many protein-protein interactions are facilitated in large part by physical drives such as the excluded volume effect, electrostatic interaction, and depletion force. Chemically inert polymers such as polyethylene glycol (PEG) and dextran are often added into solutions of biomolecules in order to mimic the crowded biochemical environment and understand various biomolecular functions ranging from protein filament assembly Suzuki et al. (1989), ion channel opening and closing Parsegian et al. (2000), to transcription of DNA Sidorova and Rau (1996). This study focuses on the physical effects of PEG on the lateral aggregation of a filamentous protein assembly, with the goal of a first principle explanation of its aggregation property. Similar phenomena occur in many cellular and physiological settings, which by large are dictated by the common physical mechanisms, although often in more complicated and less defined conditions.
The protein selected for this study is actin. Actin is a ubiquitous cytoskeletal protein of molecular weight (MW) 42000 Dalton. In solutions of low ionic strength it exists as a globular monomer, G-actin. As or is increased beyond 50 mM, the monomers polymerize into helical filaments (37 nm pitch) of side-by-side monomers incorporated into two strands Sheterline and Sparrow (1994); Holmes et al. (1990), known as filamentous actin, or F-actin. F-actin is polydisperse in length, and consists of 370 monomers per m unit length. The diameter of F-actin is 8 nm. At pH 8, the linear charge density is about 4 e/nm and surface charge density 0.15 e/nm2. This value is derived from the amino acid sequence of -skeletal muscle actin, where each monomer has a net charge of Sheterline and Sparrow (1994); Tang and Janmey (1996). In a dilute solution F-actin is a freely undulating filament with a bending modulus such that the persistence length Gittes et al. (1993); Isambert et al. (1995). This length is larger than an averaged filament length of F-actin. In the study of lateral aggregation of F-actin as induced by flexible polymers such as PEG, the effect of flexibility of F-actin is negligible, and the filaments are treated as charged colloidal rods.
The physical insight into the interaction of free polymers with colloidal particles was first achieved by Asakura and Oosawa (AO) a half century ago Asakura and Oosawa (1954). The essential prediction from the AO treatment is that an attractive force is generated between two colloidal particles in the presence of non-interacting polymers. The effect, known widely as the depletion force, is essentially of entropic origin, and has been calculated for various sizes and geometries of the colloids Kulkarni et al. (2000); Louis et al. (2002a, b); Tuinier et al. (2002); Schafer (1999).
To apply the AO model, flexible polymers are typically treated as freely interpenetrating hard spheres of radius , which are excluded from the colloid surface by a thin layer of thickness . It was shown Asakura and Oosawa (1954) that this shell creates a positive free energy difference, , where is the osmotic pressure due to the polymer, and the surface area of the colloid. If two colloidal particles share part of this volume, the volume accessible to the polymers is increased. Consequently, the total entropy of the system is increased and thus the free energy of the system is lowered. In terms of the Helmholtz free energy,
| (1) |
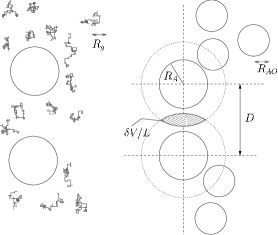
For an ideal gas, , thus it is clear that the AO interaction is entropically driven. However, osmotic pressure and volume of exclusion are more accessible to measurement and calculation. The geometry of the colloids and their depletion layer is portrayed in Fig 1. The volume of the exclusion layer is a function of the polymer radius of gyration , the radius of the colloidal rods , and the axis-to-axis separation between the rods . It has been shown Louis et al. (2002a) for an ideal random chain polymer that , where is the radius of gyration.
Polyethylene glycol (PEG) has long been used as an agent for precipitation and crystallization of proteins. PEG is a polymer that finds water a ”good” solvent, in that it assumes the configuration of an almost ideal self-avoiding random walk Devanand and Selser (1991), with radius of gyration deGennes (1979). As the polymer concentration exceeds a value , the molecules begin to overlap, and direct scaling arguments deGennes (1979) show that the correlation length begins to decrease as . The thickness of the polymer depletion layer at the colloid surface Louis et al. (2002b) scales with , with the polymer monomer number density continuously passing from zero at the colloid surface to its bulk value. The nature of this profile is the subject of continuing investigation. Nevertheless, in a continuum approach Eqn. 1 becomes a volume integral, .
Two analytical treatments have been proposed recently to calculate the correlation length and osmotic pressure in the semidilute regime. The renormalization group theory Schafer (1999) yields expressions Tuinier and Lekkerkerker (2001); Ohta and Oono (1982) for and as functions of polymer concentration and molecular weight. A second treatment has been developed by Schweizer and co-workers Kulkarni et al. (2000); Chandler (1988), which employs the polymer reference interaction site model (PRISM). The numerical results from these two treatments agree with each other in a range of concentrations spanning the dilute and semidilute regimes. The predictions also agree well with the available experimental data. Therefore, results from both treatments are applied later in this work in calculating the depletion force.
Interacting charged colloids in saline solution are typically modeled as bodies with Coulomb repulsion and attractive short-range dispersion forces, a combination known as the DLVO theory Verwey and Overbeek (1948); Israelachvili (1985). The electrostatic interaction in this situation is modeled with the Poisson-Boltzmann equation, which describes the relation between charge density and electrical potential , under the assumption that the ionic charges deviate from their bulk concentration according to the Boltzmann law. For monovalent ions:
or
With boundary conditions of moderate surface charge, the solutions of this equation are associated with a characteristic exponential decay length known as the Debye screening length , which for monovalent ions is proportional to .
Dispersion forces are the result of mutually induced dipole attraction between two bodies, and as such follow a law for interaction potential Verwey and Overbeek (1948), and are of course shorter in range than the electrostatic interaction. At high enough salt concentration, the electrostatic repulsion between colloidal particles of like charge can become weaker than the attractive dispersion force. As a result, the colloids precipitate.
The rest of the paper is organized as follows. Section II describes materials and methods employed for this work. Section III presents quantitative data and microscopic observations about the formation of F-actin bundles that result when the PEG concentration exceeds a critical onset value . Much of the analytical effort is made in section IV, by employing what are basically estimates of the electrostatic repulsion, van der Waals attractions (the DLVO theory), and the depletion effect. Qualitative explanations are made concerning onset of bundle formation, hysteresis, as well as the bundle size limit. Limitations of the present treatment and the experiments performed are also discussed.
II Materials and Methods
II.1 Materials
G-actin was prepared from acetone powder of rabbit skeletal muscle after Spudich and Watt Spudich and Watt (1971) and stored as 0.2 mL aliquots, 7.9 g/L, at -80 oC until use. G-actin was polymerized by first diluting to 3.2 g/L with ”G-buffer”, and then adding 3 M KCl to bring [KCl] to 150 mM. Polymerization to F-actin was immediately evident by a rapid increase in viscosity. Polymerization was always allowed to proceed for several hours. ”G-buffer” is 0.2 mM , 0.5 mM ATP, 0.5 mM , 0.5 mM DTT, 2.0 mM tris-HCl at pH 8.0. To create stock solutions where , the salt was added directly to G-buffer. PEG of molecular weights 4000 to 20000 were purchased from Sigma and PEG 35000 from Alfa-Aesar. Radiolabeled PEG was obtained from American Radiolabeled Chemicals (ARC-1565, -labeled PEG 35000) and labeled PEG 4000 from Amersham Biosciences, Inc. (CFA508).
II.2 Light Scattering Measurement of
Ninety degree light scattering was measured by adopting a Perkin-Elmer LS-5B luminescence spectrophotometer Tang and Janmey (1996) using a 1 mL culture tube (4.5 mm ID) to hold the sample. The tube was aligned with the probe beam for the least refraction by the glass tube and maximum illumination of the sample. Monochromatic light of 550 nm wavelength was used for illumination and detection, with spectral slit width selected from 3 to 15 nm to keep the detected light in the linear range of the photomultiplier. Once a measurement was commenced by adding the initial PEG for a certain KCl concentration, the spectrophotometer settings were kept unchanged for consistency.
Concentrated PEG solution was typically added in volumes of for a typical increment of 0.2% in the w/w percentage of PEG. Thorough mixing was achieved using a long, 0.2 mL pipet tip with a cut end ( 1 mm dia), and shear was minimized by keeping the flow rate below 0.2 mL/1 sec. During the first couple of mixing cycles, the contrast in the index of refraction in the mixture was seen to quickly diminish. This observation suggests that the mixture became homogeneous following several cycles of pipeting. F-actin concentration was 0.3 g/L with a sample volume of 0.4 mL. was characterized by a sudden rise in turbidity, developing in less than 60 seconds, and a corresponding increase in light scattering.
II.3 The amount of PEG in the bundle structure
Approximately 2000 Bq (2000 counts/s) of labeled PEG 35000 was added to 0.7 mL F-buffer, 600 mM KCl, in a glass test tube of 1 cm diameter. The sample was then mixed with 0.2 mL of 3.2 g/L F-actin. To induce bundling, 10 L increments of 13% w/w unlabeled PEG 35000 in F-buffer containing 0.6 M KCl were added with thorough yet gentle mixing. When the light scattering (turbidity) characteristic of bundling was observed, one more 10 L aliquot was added, and the mixture was allowed to sit for 10 min. This resulting w/w concentration of PEG solution for the onset of bundling is denoted . Then the entire sample was transfered to a 1.5 mL plastic Eppendorf vial and centrifuged at 1200 g for 5 min. in a swinging bucket rotor. The supernate was extracted and the pellet was immediately resuspended in of 7% w/w unlabeled PEG F-buffer containing 600 mM KCl. At this point 1.2 mL more of the same unlabeled PEG buffer was added and any remaining clumps resuspended by pipet. To minimize shear in resuspension, the flow rate was limited to in pipeting, and the pipet tip had the nozzle cut for a 0.5 mm opening.
After allowing the resuspension to re-equilibrate for 30 min, the protein was pelleted again at 8000 g for 5 min. in a swinging bucket rotor, and the supernate extracted. To minimize the pellet mass, the vial was again centrifuged at 13000 g for 5 min. in a fixed angle rotor, and the last remaining supernate removed with capillary action. The total weight of the vial was then obtained to accuracy, and the pellet weight derived from the vial tare. The pellet was then suspended in of 2% SDS and quantitatively washed into 5 mL of scintillation fluid (IRL BioSafe II). samples of and were added to 5 mL of scintillation fluid, and the activity measured with a Beckman LS6500 scintillation counter.
II.4 Hysteresis in bundle formation
For a given KCl concentration (100 mM or 600 mM) and 0.3 g/L F-actin, PEG 35000 was added in 0.2 % increments, with thorough but gentle mixing. When the qualitative change in turbidity associated with bundle formation was observed, the mixture was allowed to equilibrate for 30 minutes. Then, the sample was split into 0.3 mL aliquots, and each centrifuged at 2000 g. An appropriate volume was removed from the top, and replaced with F-buffer to reduce the PEG concentration. The bundles were then gently resuspended with a cut pipet tip. After 12 hours at 4 oC, the bundles were pelleted at 2000 g 7 min. and the supernate removed. Centrifugation was repeated to remove remaining traces of F-buffer. The bicinchoninic acid method (Sigma B-9643) was used to assay the remaining bundled protein in the pellet. DTT from the F-buffer was found to interfere with this assay, but was not significant in relation to the final amount of measured protein.
II.5 Numerical solution of cylindrical PB equation
A ’shooting’ technique Press et al. (1992), with potential as the independent variable Philip and Wooding (1970), was applied to numerically generate solutions to the PB equation with boundary conditions for an infinite cylinder. Exploiting the symmetry of the problem, we set for . Debye-Huckel theory tells us that the counter charge density between and is , where . Charge conservation is expressed with the relationship
where represents the net linear charge density enclosed within the ith shell. This, with the following approximation of Gauss’s Law
allows a quadratic equation to be solved for :
After an initial guess of , for the outer boundary condition, is calculated iteratively. If, at , , the solution set is accepted. If not, a new is chosen. A value of 0.1 mV = is used for . Typically the charge balance condition is satisfied to within 2 %.
III Results
III.1 Threshold and reversibility of bundle formation
Four parameters of phase separation were explored: PEG MW, PEG concentration , ionic strength, and actin concentration. The solution pH was held fixed at 8.0. As polymer concentration is increased, a sudden increase in light scattering marks the concentration where the onset of bundling is induced Tang et al. (1997); Tang and Janmey (1996); Suzuki et al. (1989). At monovalent ionic strength near 100 mM and PEG MW 8000 or below, the turbidity of the sample is low as the structures are small. These small structures were also measured by fluorescent imaging (data not shown). For 35 kD PEG, the light scattering is stronger, as the structures are much larger in both length and diameter.
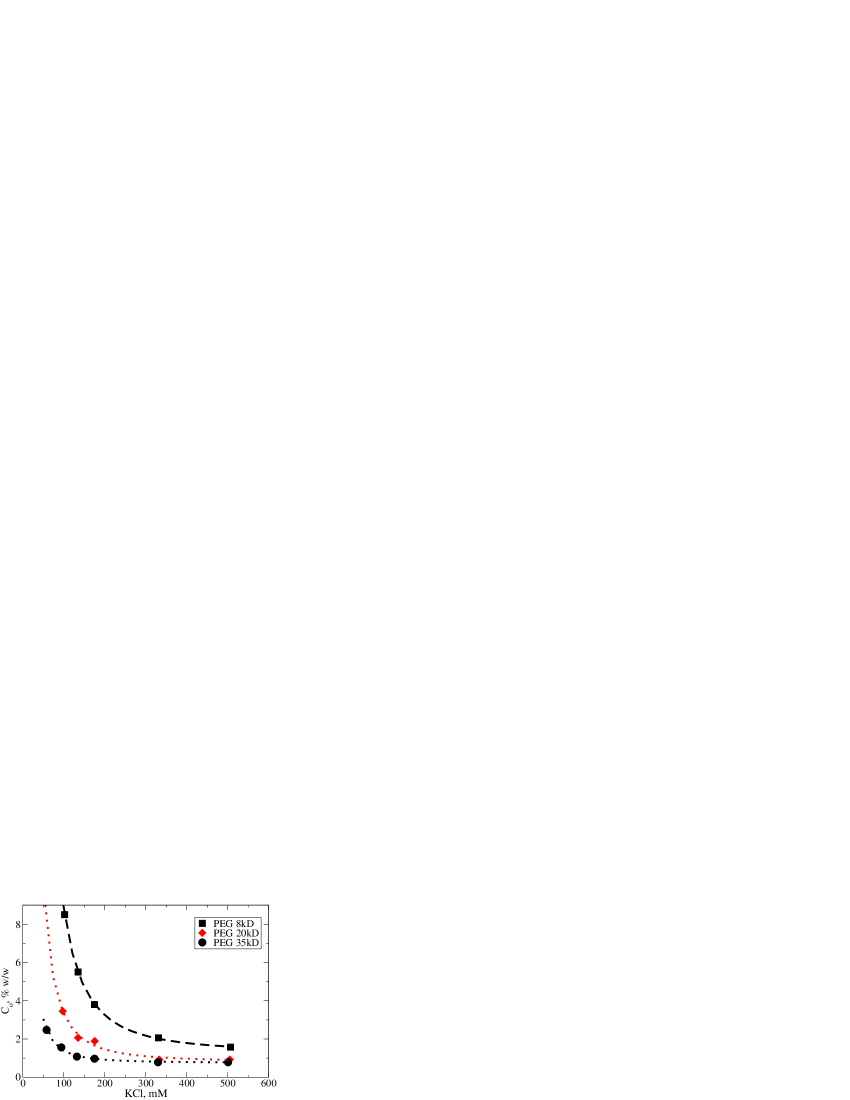
The effects of PEG MW and the solution ionic strength on are shown in Fig 2. The data clearly suggest an interplay of Debye screening length and polymer . These curves can be fit with the following semi-empirical function:
| (2) |
where is percent w/w of PEG. is found to be a rather strong function of molecular weight. A powerlaw fit yields . Separate measurements at 600 mM KCl show that is a weak function of molecular weight, . The term could be interpreted as the result of mass action ion association between the total bound charge of the F-actin and the solution potassium ions of concentration :
| (3) |
Hence
where is the association constant in this ligand binding model Dewey (1990). One can speculate that an effective charge dominates the electrostatic interaction at lower ionic strength, where the repulsion between two F-actins, proportional to , is overcome by a depletion force proportional to the osmotic pressure at the onset of bundling. Similar empirical fits can be applied to the mobility of fd virus as a function of monovalent and divalent ionic strength [ Q. Wen and J.X. Tang, unpublished data].
Measurements show small effect of protein concentration on over the range of 0.2 g/L to 0.8 g/L F-actin, although the kinetics for bundle formation, as indicated by light scattering, were appreciably slower for the lowest F-actin concentration (data not shown).
Also, the bundling process is reversible. After PEG concentration passes , the protein may be sedimented by centrifugation and resuspended in F-buffer with a resulting disappearance of turbidity. PEG may then again be added to induce bundles.
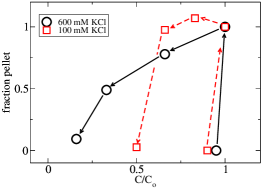
Hysteresis is seen in the disappearance of the bundles if the polymer concentration is increased beyond and then, by dilution, decreased below . As shown in Fig 3, there is a pronounced effect of ionic strength, with bundles formed at a higher ionic strength more stable.
III.2 Nucleation and growth
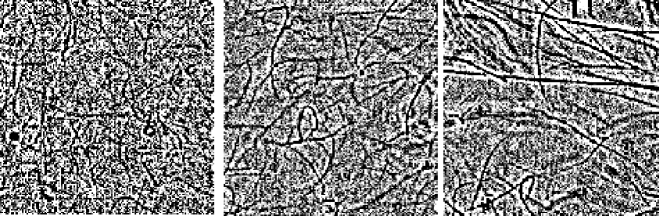
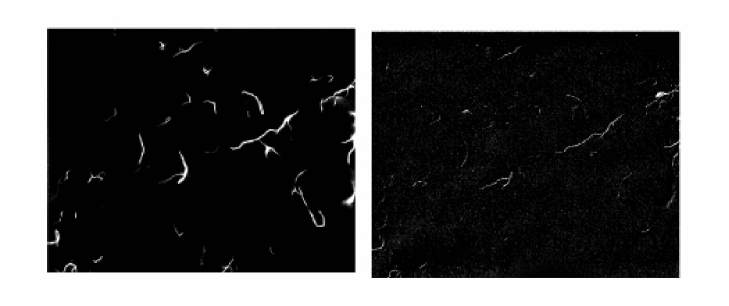
Immediately after the polymer concentration reaches , actin filaments coalesce into thin strings (Fig 4, left). After a few minutes, with mild intermittent mixing, the typical size increases (Fig 4, middle). Then, with mild intermittent mixing over 30 min, these initial structures grow into polydisperse structures larger in diameter and length (Fig 4, right). The bundles in the first image have roughly F-actin filaments each; those in the final image are at least an order of magnitude more massive. Therefore, some consideration must be given to the kinetics of bundle formation. The series of images in Fig 4 shows a typical time progression of the actin bundles induced by PEG 35000. It should be noted that there is no role of PEG concentration heterogeneity in the maturation, as the polymer concentration is entirely homogeneous after the mixing process completed within the first few seconds. It was found, however, through separate experiments, that additional mixing at the later stages also affected the kinetics of the bundle growth. The physical mechanism of this additional observation is clear in that as the bundle size increases, diffusion becomes progressively inefficient in facilitating the self-assembly.
When F-actin is added to a solution where , large aggregates with sheet- or balloon-like structure are formed. This must largely be associated with the macroscopic, slow mixing process of viscous media, easily seen as discontinuities of index of refraction on the mm length scale. Furthermore, actin will coalesce without mixing of the PEG solution. If a drop of F-actin is placed on the surface of a denser 5% PEG solution, the concentrated protein is found as one mass on the surface.
Under all circumstances, there were no signs of slow spinodal decomposition or coexistence of phases.
It appears that individual labeled actin filaments show no size preference when they combine with previously formed, unlabeled bundles. When new phalloidin-labeled F-actin is introduced, the fluorescence seems to be uniformly distributed. As is in Fig 5, the DIC images co-localize with that of the TRITC fluorescence, suggesting that individual F-actin filaments attach themselves to the previously formed bundles. Also, it was possible to show that preformed bundles do not exchange material, as phalloidin-labeled bundles mixed with unlabeled bundles show separate DIC and fluorescence populations (data not shown).
III.3 PEG is not part of the bundle structure
As described in Methods, an elaborate procedure was designed to address the question whether PEG is an integral part of the F-actin bundle structure. Following a systematic set of measurements, it was concluded that less than 0.1% w/w PEG was found to be tightly bound or trapped with the bundles. This result directly confirms that PEG-induced bundle formation is the result of the depletion effect, rather than a putative PEG binding or cross-linking of F-actin.
IV Discussion
We interpret the data in Fig 2 as an interplay between the attractive depletion force and the electrostatic repulsion of two negatively charged cylinders in a monovalent salt solution. We present approximations showing that it is reasonable to expect the depletion force to cause F-actin to laterally aggregate. Inclusion of a van der Waals attraction offers an explanation of the large hysteresis at high ionic strength, although it is not clear exactly how much this interaction contributes to the final bundled state.
In the following three sections we calculate the electrostatic, depletion, and van der Waals potentials between two infinite, parallel F-actin cylinders in order to understand the onset of bundle formation. Based on the results of these calculations, issues such as the observed hysteresis and bundle size are discussed.
IV.1 Depletion Attraction
As described in the Introduction, the depletion layer and osmotic pressure create an additional free energy for a single colloidal particle in a polymer solution. If the layer thickness were constant for all polymer concentrations and the osmotic pressure difference linear in concentration, this positive free energy would be , where continuously passes from at the colloid particle surface to zero in the surrounding solution. Since this is not the case, the energy is found by integration over volume and concentration Tuinier and Lekkerkerker (2001)
| (4) |
where is the local polymer concentration; the bulk polymer concentration is , and the local osmotic pressure is a function of . This expression for integrating total free energy is in analogy with an electrostatic charging process to calculate, for example, the energy required to charge a capacitor.
Following the qualitative reasoning of the AO theory, the free energy for two interacting colloidal particles, as expressed in Eqn. 4, should become less positive as the two approach, indicating an attractive depletion force. To calculate the interaction, one places the two particles at separation and zero polymer concentration. Then the polymer bulk concentration is parametrically ramped to the final value , with Eqn. 4 used to evaluate . This process has the qualitative and intuitively appealing feature of generating a depletion force with a range of the order of for all concentrations. We denote this change in free energy as the particles approach from infinity as .
We employ osmotic pressure data and values from the PRISM theory Kulkarni et al. (2000), and an ansatz about overlapping depletion regions Tuinier and Lekkerkerker (2001) to estimate the attractive depletion potential . For osmotic pressure , we adopt a virial equation from the literature Kulkarni et al. (2000). The values for and thus determined are presented in Table 1.
We use the proposal Tuinier and Lekkerkerker (2001) that the polymer concentration in the overlap region can be expressed as a product of the separate concentrations:
| (5) |
where is the bulk concentration and and are the profiles surrounding the two colloids at infinite separation. is in effect the product of two probability densities. The concentration profile near an isolated cylinder is assigned a cone-shaped function of width 2 :
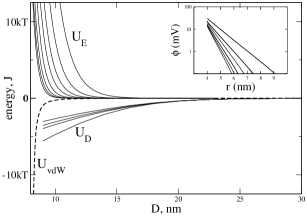
With the virial expressions for and the depletion profile from Eqn. 5, we numerically evaluate Eqn. 4. Letting take the values of in Fig 2 for PEG 35000, namely 1.6, 1.08, 0.97, and 0.80 % w/w (corresponding to 100 mM, 140 mM, 175 mM, and 500 mM KCl respectively), we show the numerical results of in Fig 6. This more elaborate methods of calculating the attractive potential yield values less than the AO hard sphere model, typically by a factor of five.
| PEG MW | ||||
|---|---|---|---|---|
| 8000 | 3112.5 | 771.1 | 4.7 | 3.0 |
| 20000 | 1245.0 | 641 | 8.2 | 1.4 |
| 35000 | 711 | 574 | 11.4 | 0.9 |
IV.2 van der Waals attraction
The standard formula for the van der Waals interaction Israelachvili (1985) for two parallel cylinders, based on the Derjaguin approximation, seemed to have an unreasonably long range, so a numerical integration of the potential was done, based on the force between two elements of identical material. Assuming two elements of material separated by experience a force where is the Hamaker constant Verwey and Overbeek (1948), we see that an element and a rod of area separated by experience a force . Considering a circular slice of F-actin, height , and a parallel cylinder of F-actin with lattice size , one can numerically calculate the total for a series of separations , then numerically integrate to obtain a potential for this slice. This function is shown in Fig 6 for , .
IV.3 Electrostatic Repulsion
For a single cylinder of surface charge density , in salt solution of ionic strength , the potential solution of the linearized Poisson-Boltzmann equation is known to be Zimm and Bret (1983); Harries (1998)
| (6) |
where and are modified Bessel functions, and is the Debye screening length Verwey and Overbeek (1948); for monovalent salts, where is the value of ionic stength in moles/L. The numerical results described in Methods match closely Eqn. 6 for = 100 mM. The inset of Fig 6 shows numerical solutions for KCl from 100 to 600 mM.
We should mention in passing that with divalent counterions, and for cylinders of smaller diameter and higher surface charge, does not have the approximate form . Under these conditions there is a sudden rise in potential as . For a cylinder of modest surface charge, the system free energy is Verwey and Overbeek (1948); Sharp (1990). In this situation, the surface potential is less than , and the positive entropic energy of the counterion cloud is equal to its negative electrostatic energy Oosawa (1971), so change in system free energy is reflected as change in surface potential. For F-actin in 100 mM KCl, the electrostatic potential at the surface is calculated to be 30 mV (see inset of Fig 6). Therefore, F-actin with monovalent counter ions is in the linear regime of the PB equation. In contrast, DNA (5.9 /nm, 0.9 nm diameter) has a significantly higher surface potential, and non-linear effects must be taken into account.
We do not have a calculation of electrostatic interaction for two parallel cylinders in proximity. However, because the highest value for (the surface potential) is not much greater than , we use the sum as an approximate solution:
We take the change in free energy as the two cylinders are forced together to be like two charges in free space:
| (7) |
For this is a very reasonable approximation Harries (1998).
We neglect the effect in the region where the dielectric of one cylinder
displaces the counterions of the other, assuming the
protein cylinder has the same dielectric constant as the
surrounding medium.
In Fig 6 we show the numerical integration of
Eqn. 7 for [KCl] = 100 mM to 600 mM for fully charged F-actin.
These results match the low surface charge example of Harries Harries (1998).
IV.4 Prediction of bundle formation
Our interpretation is that the depletion potential is sufficient to allow the filaments to find a lower energy condensed phase, which is normally denied by Coulomb repulsion, a view consistent with the standard DLVO theory. The qualitative feature to be appreciated is the role of ionic strength in making the vdW interaction accessible.
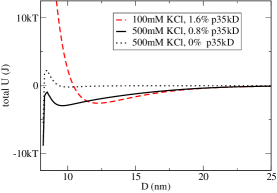
Shown in Fig 7 is the sum for three representative conditions: 500 mM KCl, 0.8% PEG 35kD; 100 mM KCl, 1.6% PEG 35kD; and 500 mM KCl, 0% PEG. The calculations appear successful in explaining features of the results at 500 mM ionic strength, predicting bundle formation with 0.8% PEG 35kD, consistent with Fig 2. With a rather low Hamaker constant, , the electrostatic repulsion is large enough to stabilize the suspension at 0% PEG, as it must. According to Eqn. 7, fully charged F-actin in 100 mM KCl has a large value of that totally prohibits the role of van der Waals forces in the bound state. This is contradictory with the experimental result. Both 100 mM and 500 mM PEG 35kD bundles are similar in appearance, although hysteresis has a wider range for 500 mM KCl, as seen in Fig 3. While the choice of the low Hamaker constant is an obvious cause of the imbalance, it is hard to justify using different values for Hamaker constant at different ionic strengths. Additional mechanisms unaccounted for in our treatment are discussed below.
Counterion fluctuation and redistribution Oosawa (1971); Ha and Liu (1997); Lau and Pincus (2002); Ray and Manning (1994) clearly play important roles in leading to an overall attractive interaction. These effects have not been taken into consideration in our simple electrostatic calculations. Since the effects are more pronounced at lower ionic strength, it is not surprising that our calculated based on PB theory overestimates the repulsion (Fig 6). at low ionic strength. Most of these works seem to focus on polyelectrolytes of high surface charge density, such as DNA, in the presence of multivalent counterions. These theories may also be expanded to treat systems of relatively weak surface charge, such as F-actin.
The semi-quantitative fits to the data shown in Fig 2 suggest ligand binding as an alternative mechanism for predicting bundle formation. With a mass action ligand (counterion) binding interpretation (Eqn. 3) with , half the negative charge would be neutralized at 5 mM KCl, which implies a surface charge down by a factor of 100 at 500 mM. This surface charge could certainly not support a stable suspension. A weaker association constant, say = 1/(100 mM), fails to produce the flat baseline of at higher salt. Experiments Carlier et al. (1986); Kinosian et al. (1989) focused mainly on F-actin’s tightly bound divalent ions and have demonstrated effects of in the rapid phase of fluorescence induction, indicating low affinity binding constants from 1/(10 mM) to 1/(100 mM). The data in Fig 2, together with the fact that F-actin is stable at the highest monovalent ionic strength, seem to demand that F-actin maintain a significant fraction of unneutralized charge at high salt. Indeed, the electrophoretic mobility measurements for filamentous phages fd and M13 suggest that the filaments remain charged up to 500 mM KCl [Q. Wen and J.X. Tang, unpublished data].
A recent study by Yu and Carlsson Yu and Carlsson (2003) directly addresses the question of F-actin electrostatic interaction. This work includes electrostatic and entropic terms in ligand (counterion) binding as well as the actual spacial configuration of the charged groups of the protein structure. These authors point out a role of induced charge condensation as the two filaments begin to interact: as the surface potential of one filament is increased by the other, the effective of each site is raised by a factor , lowering the repulsion by increasing the counterion binding. The actual interaction is found with a largest-error-correction algorithm seeking the lowest energy, which is a function of the charge of all sites. Their treatment may be expanded to predict features of PEG-induced bundle formation, which goes beyond the scope of this work.
IV.5 Distinction from polyvalent cation induced bundle formation
The mechanism of polymer-induced bundling is distinct from the bundling induced by divalent metal ions, cationic complexes, and basic polypeptides Tang et al. (1997); Tang and Janmey (1996); Tang et al. (2002). The most salient feature is the inhibiting nature of monovalent salts for the latter vs.the enhancing effect for the former. Secondly, polyvalent counterions such as basic polypeptides and cationic complexes function as some binding agent in F-actin bundles. An opposite role is held by PEG, which does not bind F-actin, as confirmed in this study with the sedimentation assay using radio-labeled PEG. In addition, we show in this work that under some conditions the PEG-induced bundles are morphologically different in size.
Another distinct property from polyvalent cation induced bundle formation is that no resolubilization was found with high polymer concentration or high ionic strength (2.5 M KCl), in that the structures were stable under these conditions. In contrast, for most colloidal systems, precipitation occurs with the addition of multivalent ions, only to go back into suspension with increased concentration of the multivalent counterions. Long known for some classical colloids, this has recently been shown for the bacteriophages fd and M13 viruses Tang et al. (2002). This phenomenon has been predicted for F-actin by recent theoretical calculations Yu and Carlsson (2003). However, experimental test of such a prediction has yet to be performed.
There is an apparent multitude of proteins which either bind to F-actin, affect the polymerization of actin, or enhance the lateral aggregation of F-actin Tang et al. (1997). In view of the distinction between the polyvalent counterion induced bundling and the one by depletion effect shown in this work, it is helpful to assess their respective contributions to the related biochemical functions. Under the unifying tie of electrostatic effects, however, this work implies a strong relevance of polyelectrolyte physics to the observation that so many biochemically unrelated proteins bind F-actin and induce formation of actin bundles. Is the binding capability due largely to the cylindrical geometry of actin filaments, which tends to diminish electrostatic stability Zimm and Bret (1983); Oosawa (1971)?
IV.6 Hysteresis
The hysteresis in the dissolution of PEG induced actin bundles (Fig 3) can be qualitatively explained by the following scenario: At zero polymer, filament/filament contact is prohibited by the electrostatic barrier. As the height of this barrier is overcome with the depletion potential from increased polymer concentration, F-actin is allowed into the vdW binding configuration. If the polymer concentration is then lowered, the tightly bound state remains stranded inside the barrier. This can be seen in Fig 7 for the case of 500 mM KCl.
IV.7 What limits the bundle size?
Suppose that the total surface charge of a bundle increases with size, while the surface charge density remains constant. Recall that Eqn. 6 shows that the self-energy goes as . If the surface charge density is a constant value (that of an individual F-actin), this electrostatic self-energy per unit length of a bundle would increase as the bundle radius . Assuming the depletion potential to be of depth , per unit length would scale as , which is the shaded area of Fig 1 for small . ¿From these considerations, there is no obvious limit in size because outraces with increasing diameter . This simple scaling argument also predicts that linear polyelectrolytes of larger diameter are more prone to bundling when other parameters are comparable.
The final bundle structure is not necessarily a hexagonal array of rods, but rather it could be the product of diffusion limited aggregation Barabasi and Stanley (1995). Such structures are expected to show surface roughness greater than the standard statistical deviation proportional to the square root of the accumulation. From Fig 5 we know that an individual filament finds a low energy configuration on a previously formed bundle. However, the situation is different for two matured bundles, where, due to surface contour, the relative interaction (contact) area fails to scale with diameter. Such a structure is easily broken up by the turbulence of light mixing. Thus there is a point in the hierarchy of assembly when the macroscopic hydrodynamic forces exceed the surface-surface interaction. This argument explains why the bundles do not collapse into one large mass, but assume polydisperse structures which show no tendency to combine with each other after a certain level of self-assembly.
The arguments above based on the surface roughness do not fully explain how bundles might reach some equilibrium size limit. The experimental observations are inconclusive whether an equilibrium size distribution exists or is practically attainable. PEG 8kD bundles appear to stop growing at smaller sizes (data not shown) than those induced by PEG 35kD (Fig 4 and Fig 5), which clearly grow into large structures, their extent perhaps only limited by the progressively slow kinetics. In the test tube experiments, the effect of diffusion may be surpassed by the sedimentation effect due to gravity for the large bundles observed. Additional experiments are necessary in order to assess which effects are dominant in determining the actin bundle size.
The hysteresis data also implies an inhomogeneity, or variation in ’fitness’, among the actin bundles. Some of the structures ’survive’ with reduced polymer while others have dissolved back to dispersed actin filaments. The inhomogeneity may be related to defects in the structure of the bundles, or more simply a wide variation of the bundle sizes. Additional experiments may also be designed to test these different proposals.
IV.8 Concluding remarks
Our calculations are to be taken as reasonable estimates of the forces involved in bundle formation. More exact calculations, especially of the electrostatic interaction, presumably including a role of mass action counter-charge accumulation, should help explain many aspects of the results quantitatively. Nevertheless, results from the simple experiments reported here provide an opportunity to expand the understanding of some basic problems in lateral aggregation of protein filaments.
V Acknowledgments
We wish to thank Prof. David Daleke for his generosity. This work was supported by NSF-DMR 9988389, NIH-HL 67286, and by Indiana University.
References
- Suzuki et al. (1989) A. Suzuki, M. Yamazaki, and T. Ito, Biochemistry 28, 6513 (1989).
- Parsegian et al. (2000) V. A. Parsegian, R. P. Rand, and D. C. Rau, Proc. Natl. Acad. Sci. 97 (8), 3987 (2000).
- Sidorova and Rau (1996) N. Y. Sidorova and D. Rau, Proc. Natl. Acad. Sci. 93, 12272 (1996).
- Sheterline and Sparrow (1994) P. Sheterline and J. Sparrow, Protein Profile 1, 1 (1994).
- Holmes et al. (1990) K. Holmes, D. Popp, W. Gebhard, and W. Kabsch, Nature 347, 44 (1990).
- Tang and Janmey (1996) J. X. Tang and P. A. Janmey, J. Biol. Chem. 271 (15), 8556 (1996).
- Gittes et al. (1993) F. Gittes, B. Mickey, A. Nettleton, and J. Howard, J. Cell Bio. 120, 923 (1993).
- Isambert et al. (1995) H. Isambert, P. Venier, A. C. Maggs, A. Fattoum, R. Kassab, D. Pantaloni, and M. F. Carlier, J. Biol. Chem. 270, 11437 (1995).
- Asakura and Oosawa (1954) S. Asakura and F. Oosawa, J. Chem. Phys. 22, 1255 (1954).
- Kulkarni et al. (2000) A. M. Kulkarni, A. P. Chatterjee, K. S. Schweizer, and C. F. Zukoski, J. Chem. Phys. 113 (21), 9863 (2000).
- Louis et al. (2002a) A. A. Louis, P. G. Bolhuis, E. J. Meijer, and J. P. Hansen, J. Chem. Phys. 117 (4), 1893 (2002a).
- Louis et al. (2002b) A. A. Louis, P. G. Bolhuis, E. J. Meijer, and J. P. Hansen, J. Chem. Phys. 116 (23), 10547 (2002b).
- Tuinier et al. (2002) R. Tuinier, H. N. W. Lekkerkerker, and D. G. A. L. Aarts, Phys. Rev. E 65, XXX (2002).
- Schafer (1999) L. Schafer, Excluded Volume Effects in Polymer Solutions (Springer Verlag, Berlin, 1999).
- Devanand and Selser (1991) K. Devanand and J. C. Selser, Macromolecules 24 (22), 5943 (1991).
- deGennes (1979) P. deGennes, Scaling Concepts in Polymer Physics (Cornell University, Ithaca, 1979).
- Tuinier and Lekkerkerker (2001) R. Tuinier and H. N. W. Lekkerkerker, Eur. Phys. J. E 6, 129 (2001).
- Ohta and Oono (1982) T. Ohta and Y. Oono, Phys. Lett. 89A, 460 (1982).
- Chandler (1988) D. Chandler, Studies in Statistical Mechanics (vol.8, E. W. Montroll and J. L. Lebowitz, editors, 1988).
- Verwey and Overbeek (1948) E. J. W. Verwey and J. T. G. Overbeek, Theory of the Stability of Lyophobic Colloids (Elsevier, Amsterdam, 1948).
- Israelachvili (1985) J. N. Israelachvili, Intermolecular and Surface Forces (Academic Press, 1985).
- Spudich and Watt (1971) J. Spudich and S. Watt, J. Biol. Chem. 246, 4866 (1971).
- Press et al. (1992) W. H. Press, S. A. Teukolsky, W. T. Vettering, and B. P. Flannery, Numerical Recipes in fortran (Cambridge, 1992).
- Philip and Wooding (1970) J. R. Philip and R. A. Wooding, Jour. Chem. Phys. 52, 953 (1970).
- Tang et al. (1997) J. X. Tang, T. Ito, T. Tao, P. Traub, and P. A. Janmey, Biochem. 36, 12600 (1997).
- Dewey (1990) J. G. Dewey, Biopolymers 29, 1793 (1990).
- Zimm and Bret (1983) B. H. Zimm and M. L. Bret, J. Biomolec. Structure and Dynamics 1, 461 (1983).
- Harries (1998) D. Harries, Langmuir 14, 3149 (1998).
- Sharp (1990) B. Sharp, K. A. and Honig, J. Phys. Chem. 94, 7684 (1990).
- Oosawa (1971) F. Oosawa, Polyelectrolytes (Marcel Dekker, 1971).
- Ha and Liu (1997) B.-Y. Ha and A. J. Liu, Phys. Rev. Lett. 79, 1289 (1997).
- Lau and Pincus (2002) A.-W. Lau and P. Pincus, Phys. Rev. E 66, 41501 (2002).
- Ray and Manning (1994) J. Ray and G. S. Manning, Langmuir 10, 2450 (1994).
- Carlier et al. (1986) M. Carlier, D. Pantolini, and E. D. Korn, J. Biol. Chem. 261, 10778 (1986).
- Kinosian et al. (1989) H. J. Kinosian, L. A. Selden, J. E. Estes, and L. C. Gershman, J. Biol. Chem. 264, 9721 (1989).
- Yu and Carlsson (2003) X. Yu and A. E. Carlsson, Biophys. J. 85, 3532 (2003).
- Tang et al. (2002) J. X. Tang, P. A. Janmey, A. Lyubartsev, and L. Nordenskiold, Biophys. J. 83, 566 (2002).
- Barabasi and Stanley (1995) A. L. Barabasi and H. E. Stanley, Fractal Concepts in Surface Growth (University of Cambridge, 1995).