Semiconservative Replication in the Quasispecies Model
Abstract
This paper extends Eigen’s quasispecies equations to account for the semiconservative nature of DNA replication. We solve the equations in the limit of infinite sequence length for the simplest case of a static, sharply peaked fitness landscape. We show that the error catastrophe occurs when , the product of sequence length and per base pair mismatch probability, exceeds , where is the first order growth rate constant of the viable “master” sequence (with all other sequences having a first-order growth rate constant of ). This is in contrast to the result of for conservative replication. In particular, as , the error catastrophe is never reached for conservative replication, while for semiconservative replication the critical approaches . Semiconservative replication is therefore considerably less robust than conservative replication to the effect of replication errors. We also show that the mean equilibrium fitness of a semiconservatively replicating system is given by below the error catastrophe, in contrast to the standard result of for conservative replication (derived by Kimura and Maruyama in 1966).
pacs:
87.23.Kg, 87.16.Ac, 64.90.+bI Introduction
In 1971, Manfred Eigen introduced the quasispecies formulation of molecular evolution to explain the observed distribution of genotypes in RNA evolution experiments Eigen (1971); Eigen et al. (1989). The central result of his model was that due to mutations, the equilibrium distribution of genotypes did not consist of a fittest sequence, but rather a set of closely related strains, which Eigen termed a “quasispecies.” Eigen showed that a stable quasispecies only exists if the mutation rate is kept below a threshold value. Above this value, the distribution of genotypes undergoes a second-order phase transition termed the error catastrophe, in which the distribution completely delocalizes over the gene sequence space. Subsequent studies on the quasispecies model have focused almost exclusively on the error catastrophe Swetina and Schuster (1982); Tarazona (1992); Galluccio (1997); Pastor-Satorras and Sole (2001); Altmeyer and McCaskill (2001); Franz and Peliti (1997); Campos and Fontanari (1998); Alves and Fontanari (1998), though there has also been some work on the dynamical aspects of the equations Nilsson and Snoad (2002, 2000). More recently, other phase transitions besides the error catastrophe (e.g. the so-called “repair catastrophe”) have been shown to arise from the quasispecies equations Tannenbaum et al. (2003); Tannenbaum and Shakhnovich (2003).
A common feature of previous work on the quasispecies equations has been the implicit assumption that the genome of an organism could be written as a linear symbol sequence, and that replication occurs conservatively (that is, the original genetic material is preserved during replication). These two assumptions allow for a relatively straightforward derivation of a system of equations modelling the evolution of a unicellular, asexual population. In the simplest formulation, we assume that each organism has a genome of length , where each “letter” or “base” is drawn from an alphabet of size ( for all known terrestrial life). We assume first-order growth kinetics, and that the genome determines the first-order growth rate constant, or fitness, denoted by (in general, will be time-dependent, reflecting the generally dynamic nature of the environment). Furthermore, we assume a per base replication error probability of . If we let denote the fraction of organisms with genome , then it may be shown that Eigen (1971); Eigen et al. (1989),
| (1) |
where is simply the mean fitness of the population, and is the first-order mutation rate constant for mutations from to . If denotes the probability of mutation from to , then it is clear that . If we let denote the Hamming distance between and , then it is possible to show that,
| (2) |
The simplest formulation of these equations considers a genome-independent replication error probability , and a time-independent fitness landscape characterized by a single “master” sequence of fitness , with all other sequences set to a fitness of . This so-called Single Fitness Peak model (SFP) has been the subject of considerable theoretical treatment Swetina and Schuster (1982); Tarazona (1992); Galluccio (1997) (and references therein). The central result of this model is that, in the limit of , the mean equilibrium fitness of the population is given by for , and for , where . When , the population is localized in a cluster about the master sequence, resulting in what Eigen called a quasispecies. When , the population is completely delocalized over the gene sequence space, so that no discernible quasispecies exists. The transition between the two regimes, at , is known as the error catastrophe. It should be noted that the result of was first derived in 1966 by Kimura and Maruyama Kimura and Maruyama (2003), and is a standard result in theoretical population genetics.
While the assumption of a linear symbol sequence and conservative replication is correct for modelling single-stranded RNA, a proper extension of the quasispecies model to real organisms should take into account the double-stranded nature of DNA, and also the semiconservative nature of DNA replication. In semiconservative replication, the original DNA molecule is not preserved after replication. Rather, each strand serves as the template for the synthesis of a complementary daughter strand, meaning that after replication, each DNA molecule consists of one parent and one daughter strand Voet and Voet (1995).
The formulation of the quasispecies equations given above are inadequate to describe evolution with double-stranded, semiconservatively replicated genomes. There are two reasons for this: First of all, because DNA is double-stranded, there is no well-defined Hamming distance between two DNA molecules. Furthermore, because in semiconservative replication the original molecule is destroyed, a mathematical formulation of this process must incorporate an effective death term, which is clearly lacking in the quasispecies equations for conservative replication.
The goal of this paper is to extend Eigen’s formulation of the quasispecies equations, to account for the double-stranded and semiconservative nature of DNA replication. This is a necessary first step toward making the quasispecies equations a quantitative tool for analyzing the evolutionary dynamics of unicellular organisms. Then, after obtaining the form of Eigen’s equations for the case of double-stranded DNA, we wish to proceed and solve these equations for the simplest landscape, that of the static single fitness peak.
This paper is organized as follows: In the following section, we present an overview of DNA sequence analysis and replication mechanism, followed by a derivation of the appropriate quasispecies equations. We continue in Section III with a discussion of the single fitness peak model. Specifically, we present the infinite sequence length equations, leaving the details of the derivation, which are fairly involved, for Appendix A. We then go on to discuss the error catastrophe, presenting both analytical results and numerical corroboration using stochastic simulations of replicating populations. In Section IV, we discuss our results, and also the extension of our equations to multiple gene models. Finally, we conclude in Section V with a summary of our results, and a discussion of future research plans.
II Derivation of the Quasispecies Equations for Semiconservative Replication
II.1 An Overview of DNA Sequence Analysis
Double-stranded DNA consists of two anti-parallel, complementary strands. During transcription, messenger RNA (mRNA) is synthesized in the to direction. The DNA template strand from which RNA synthesis occurs is known as the anti-sense strand, and is read in the to direction. The complementary strand, the sense strand, has the same sequence as the transcribed mRNA, and is “read” in the to direction (the quotes are to indicate that the sense strand does not directly participate in the transcription process). We therefore adopt the convention that DNA and RNA sequences are read in the to direction, as illustrated in Figure 1. However, this convention is arbitrary, and it is equally valid to read DNA and RNA sequences in the to directions. Once a convention is adopted, the anti-parallel nature of double-stranded DNA (or RNA) means that the complementary strands are read in opposite directions. A more detailed explanation can be found in Voet and Voet (1995).
We consider a double-stranded DNA molecule with generalized alphabet of size , consisting of “letters” . Each “letter” is assumed to uniquely base pair with . For actual DNA, we of course have , and we may make the assignment , , , .
Given a DNA molecule of sequence length , let one of the strands be denoted by . If the complement of a base is denoted by , then the complementary strand is given by . Note that , and therefore, each DNA molecule may be denoted by the set .

For single-stranded molecules of length and alphabet size , there are distinct sequences. We seek to derive the analogous formula for double-stranded DNA. Given a DNA molecule , define the internal Hamming distance . If we let denote the number of DNA molecules of length with internal Hamming distance , then the total number of distinct sequences is simply given by . We therefore proceed to compute . Due to the possibility of palindromic molecules (), we need to consider the case of even and odd separately.
Given some DNA molecule , with , suppose we have for some . Then , and hence equality between corresponding bases in and comes in pairs whenever . This must always be true, since, if , then , which is impossible. Therefore, and must be equal at an even number of sites, hence must be odd for odd and even for even .
Suppose is odd, so , and consider some . We have complete freedom to choose . We automatically have . Thus, we have remaining sites among where we choose such that . Equivalently, we have sites among where we choose such that . There are ways of choosing these sites, and for each such choice, there are possible values for each taken to be distinct from . Putting together all the degeneracies, we obtain ways of choosing such that . However, this still does not give us the set of all distinct DNA molecules with internal Hamming distance , for if , then our counting method generates a given twice, by generating both and . Since if and only if , which is impossible for odd , we have, finally, that,
| (3) |
for odd . Thus, for odd ,
| (4) |
If is even, then we may write . In this case, is also even, and so for some . We have complete freedom to choose . Proceeding as with the analysis above, we may show that there are ways of choosing so that . If , we need to divide by to get the set of all distinct DNA molecules with internal Hamming distance . Therefore,
| (5) |
for even . Therefore, for even ,
| (6) |
Note the additional term arising from the contribution of the palindromic sequences.
II.2 Modelling DNA Replication
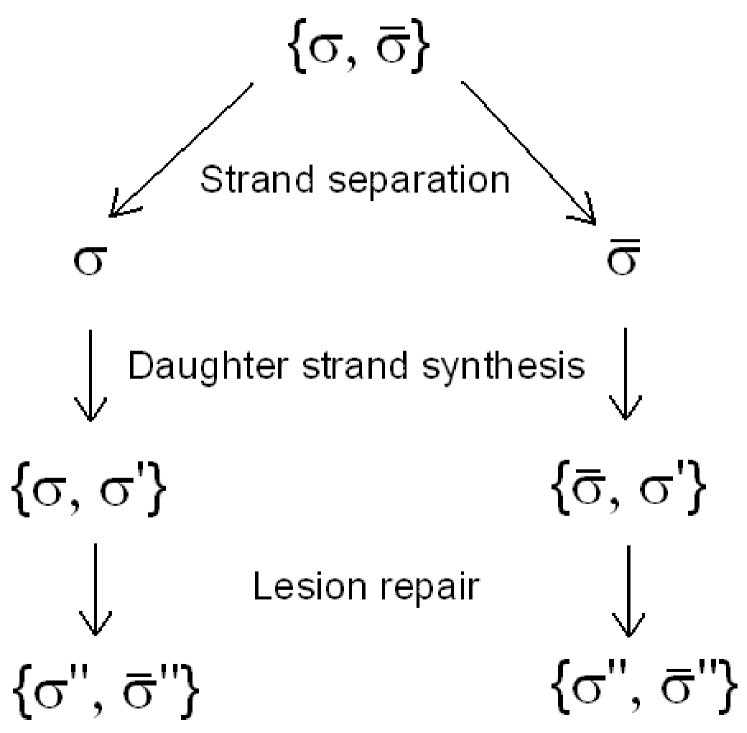
The replication of DNA during cell division may be divided into three stages, which are illustrated in Figure 2.
The first stage of DNA replication is strand separation, with each parent strand serving as a template for synthesizing the complementary daughter strands Voet and Voet (1995). We may model this stage by writing that a given DNA molecule separates into the single-stranded sequences and .
As strand separation occurs, daughter strand synthesis is catalyzed via enzymes known as DNA replicases. However, due to errors in the base pairing process, is not necessarily paired with . Rather, once cell division is finished, the original is paired with some , and similarly for .
Each genome has a characteristic replication mismatch probability (a base-pair-independent mismatch probability is certainly a simplification, but it is an initial starting point). Different genomes may have different replication fidelities, due to various replication error correction mechanisms which may or may not be functioning. For example, in Escherichia coli, the DNA replicase Pol III has a built-in proofreading mechanism which excises mismatched bases in the daughter strand Voet and Voet (1995). In addition, in many prokaryotes and eukaryotes, DNA daughter strand synthesis is followed by mismatch repair Voet and Voet (1995), which can distinguish between the parent and daughter strands, thereby allowing the proper repair of mismatches. All such repair mechanisms are gathered within in our model.
In the final stage, DNA replication and cell division is complete, and the parent and daughter strands have become indistinguishable. Remaining mismatches in the daughter cells’ DNA are eliminated by various maintenance enzymes, which recognize and repair the lesions caused by mismatched base pairs. However, because it is impossible to determine which strand has the incorrect base, the mismatch is correctly repaired with probability . The result is that the pair is converted to some , giving the DNA molecule . A similar process happens for the parent strand.
We wish to derive the probability that a given parent strand produces in the daughter cell. Let us denote this probability by . Also, let denote the probability that is paired with during daughter strand synthesis, and let be the probability that , during post-replicative lesion repair. Then we have, assuming , that,
| (7) | |||||
If , then only one of the sums is kept.
We now proceed to compute . Write , , and . Let . Let us consider some for which . Then can take on any value, for if , then no repair is necessary, and we obtain . If , then repair is necessary, and with probability it is that is repaired to , giving once again that . So, let us now consider some for which . Then must be equal to . Otherwise, if , then no lesion repair occurs, and we get . If , then is repaired with probability to , or is repaired with probability to . Thus, either , or , and so the corresponding does not contribute to the sum , since .
Our analysis allows us to perform the sum, assuming a probability of a mismatch. For a given , let denote the number of sites among the sites which are equal in and for which . There are ways of choosing such a . The probability is equal to . The probability is then , so multiplying by the degeneracy in and summing over all gives,
| (8) | |||||
If we define , then we obtain that . Now, note that , and , so that , and . Therefore, we obtain that,
| (9) |
II.3 The Quasispecies Equations
We are now ready to derive the quasispecies equations for semiconservative replication. We consider a population of unicellular, asexually replicating organisms. Let denote the number of organisms with genome . We let denote the first-order growth rate constant of organisms with genome . Then from the replication mechanism illustrated in Figure 2, we obtain the system of differential equations given by,
| (10) | |||||
The first term is a death term which takes into account the destruction of the original genome during replication. The terms in the summation take into the account the production of from both and .
We now define , and . Reexpressed in terms of the population fractions , the dynamical equations become,
| (11) | |||||
where , so is simply the mean fitness of the population, which arises as a normalization term to ensure that the total population fraction remains .
We now proceed to put these equations into a form which is more easily amenable to analysis than the above equations. To this end, we make the following definitions: (1) , so that . (2) , so that . Finally, if , and if . Clearly, we also have that .
Now,
Therefore, for ,
| (13) | |||||
For we get,
| (14) | |||||
Since we obtain the same set of equations for palindromic and non-palindromic molecules, the final form of our quasispecies equations becomes,
| (15) | |||||
It is readily shown that . It is also readily shown that for all implies that for all , and so is preserved by the evolution.
III The Single Fitness Peak
III.1 Overview and Analytical Results
In the single fitness peak model, there exists a unique, master genome with fitness , with all other genomes having fitness . Our fitness landscape is therefore given by , while for . We also assume that is independent of , so that . For this landscape, we wish to obtain the equilibrium behavior of the system of differential equations given by Eq. (15).
For the case of conservative replication, the single fitness peak model may be solved by first grouping the genomes into Hamming classes Swetina and Schuster (1982). Specifically, given the master sequence , we may define . If denotes the population fraction with genome , then we define . The quasispecies equations are then reexpressed in terms of the , and the equilibrium equations may be readily solved in the limit of infinite sequence length, since the backmutation terms become negligible. The result is,
| (16) |
where for , and for , , and in the limit .
For the case of semiconservative replication, the single fitness peak model for double-stranded genomes becomes an effectively two fitness peak model. Thus, it is not possible to directly group the genomes into Hamming classes. Nevertheless, the single fitness peak for double-stranded genomes is solvable. The details of the solution, which are fairly involved, may be found in Appendix A. The final result, however, is simple to understand. In the limit of infinite sequence length, and become infinitely separated. Therefore, locally around , we have an effectively single fitness peak model. We may therefore exploit the local symmetry of the landscape and define Hamming classes around and . Thus, , and similarly for . We may then define , and may be defined similarly with respect to . However, by symmetry of the landscape we have , and so need only consider the dynamics of the . In Appendix A, we show that when expressed in terms of the , the quasispecies equations become,
| (17) |
In this case, . The reason for this is that is only the fraction of the population on the fitness peak at . By the way we defined our , the total fraction of viable organisms is given by .
We begin the solution of the infinite sequence length equations by solving for the equilibrium value of . We have,
| (18) |
which admits the solutions . Multiplying by , we get the equilibrium solution for of or . To determine the domain of validity of these solutions, we note that we want for . That is, when replication is perfect, then the population resides entirely on the fitness peak . We must also have , which holds as long as . Therefore, by continuity, we have that for , the equilibrium solution is . For , the equilibrium solution becomes . The transition between these two solutions regimes is known as the error catastrophe.
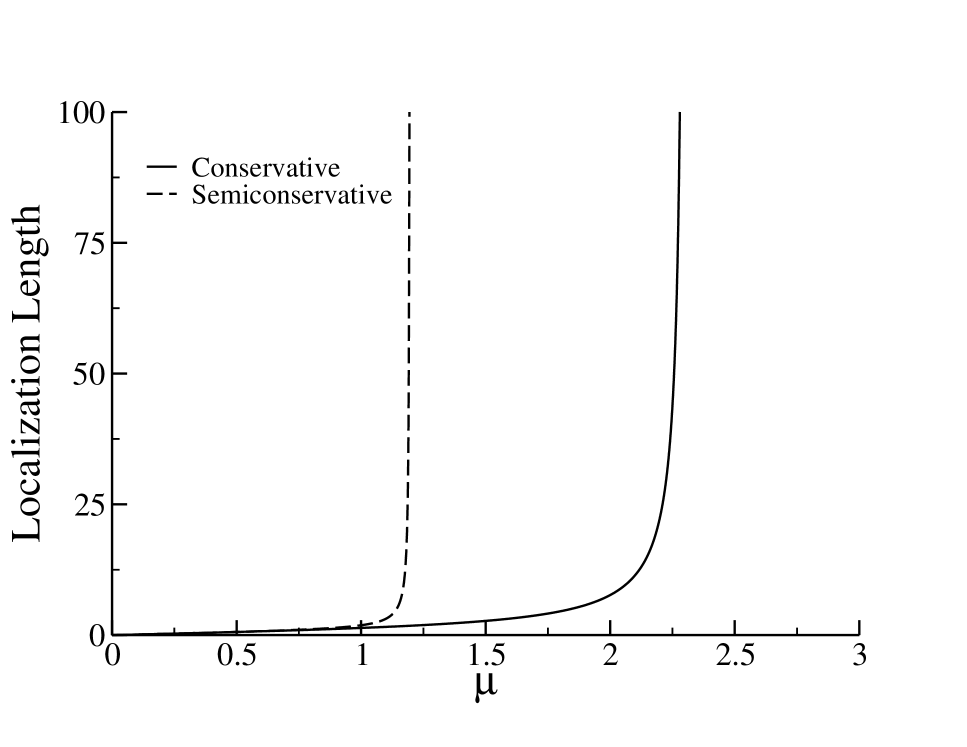
In dealing with conservative replication, another parameter of interest which we consider is the localization length, defined as , where denotes the population fraction at Hamming distance from the master sequence. We wish to extend the definition of localization length to our model. The complication here is that in the limit of infinite sequence length, the Hamming distances and to and (respectively) cannot be simultaneously finite. However, as mentioned previously, the fraction of the population at a Hamming distance from , given by , is equal to the fraction of the population at a Hamming distance from , given by . Therefore, an appropriate definition for the Hamming distance is to define . We may compute by using a technique similar to the one developed in Tannenbaum and Shakhnovich (2003). Briefly, a differential equation for the time evolution of is derived from the evolution equations for the . The result is,
| (19) |
giving at equilibrium that,
| (20) |
Note that the localization length is finite for , but diverges at the error catastrophe.
For convenience, Table I illustrates the difference between conservative and semiconservative replication.
| Parameter | Conservative | Semiconservative |
|---|---|---|
| () | ||
| () | ||
| () |
Figure 3 shows a plot of versus for both the conservative and semiconservative cases. Figure 4 shows a plot of versus for for both the conservative and semiconservative cases. Finally, Figure 5 shows a plot of versus for for both the conservative and semiconservative cases.


III.2 Numerical Verification Using Stochastic Simulations
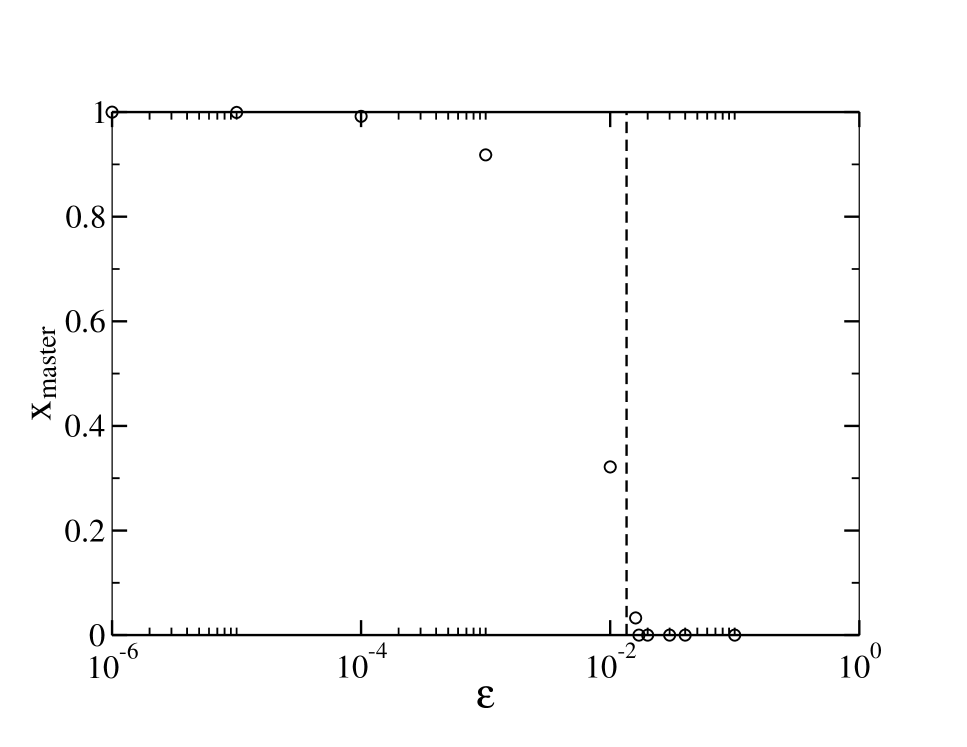
In order to allow for independent verification of the semiconservative error catastrophe, we employ stochastic simulations of evolving organisms rather than numerical integration of the equations themselves. The details of these simulations are given in Appendix B.
Our simulations involve constant population sizes of organisms with genome lengths of base pairs, using an alphabet size to correspond with the alphabet size of DNA. The master sequence on our SFP landscape replicates at each time step with probability ; all other sequences replicate with . Transforming these replication probabilities to replication rates for use in the above equations, we have given .
We run our simulations using the above parameters. For those simulations in which the equilibrium value of , we calculate the equilibrium fraction of viable organisms as the average of equilibrium steps from independent runs. For those simulations in which the equilibrium value of , we verify this behavior in two independent runs. The equilibrium value of is calculated as above for various values of , and the results are displayed in Figure 6. The predicted for the above parameters is indicated in Figure 6 as a dashed line. Note the good agreement between the theoretical prediction of the error catastrophe and the numerical results.
IV Discussion
The key difference between conservative replication and semiconservative replication is the destruction of the parent genome in the semiconservative case, as opposed to its preservation in the conservative case. This is captured by the functions versus in the formulas given in Table 1. For conservative replication, is simply the probability of correct replication. This probability is always positive, and so, by making sufficiently large, it is possible to guarantee that the effective growth rate of the master sequence stays above the growth rate of for the unviable sequences. For semiconservative replication, the probability that each strand is matched with its proper complementary strand is . Therefore, since there are two parent strands, and the parent genome is destroyed during replication, we have the factor , yielding an effective growth rate of . However, is only positive when , or when . When the probability of correct daughter strand synthesis drops below , then the rate of production of viable genomes no longer exceeds the rate of destruction. The result is that replicating faster simply increases the rate of destruction of viable organisms, and therefore does not avoid the error catastrophe.
The semiconservative quasispecies formalism may be naturally extended to more sophisticated models with more than one gene. In this paper, we focused on the single fitness peak model, in which the genome consists of a single, “viability gene,” and the replication error probability is genome-independent.
As an example, we may incorporate mismatch repair into the semiconservative, quasispecies formalism. As with the conservative case Tannenbaum et al. (2003); Tannenbaum and Shakhnovich (2003), we consider a two gene model, in which one gene codes for viability, and the other codes for repair. Thus, a given genome may be written as . As was done in Tannenbaum et al. (2003); Tannenbaum and Shakhnovich (2003), we may assume a single-fitness peak in both the viability and repair genes, so that there exist “master” sequences , and for both viability and repair, respectively. In the single-stranded formulation of the semiconservative model, a given has a first-order growth rate if or . The growth rate constant is otherwise. Furthermore, has a functioning mismatch repair system with failure probability if , or . Otherwise, mismatch repair is inactivated.
While we leave the solution of this two gene model for future work, we may nevertheless compute the location of the repair catastrophe. As with the case for conservative replication, the repair catastrophe occurs when the effective growth rate constant of viable repairers drops below the growth rate of constant of viable non-repairers. For viable repairers, the effective growth rate constant is . We have for the non-repairers an effective growth rate constant of viable organisms given by . The factor of arises because in dealing with the overall growth rate of the mutators, we are only concerned with the production of viable organisms. The repairer gene does not need to be correctly replicated.
V Conclusions
This paper extended the quasispecies formalism to include the case of semiconservative replication, in order to allow for the more realistic modelling of the evolutionary dynamics of DNA-based life. While our model is currently most directly applicable to prokaryotic genomes, which generally consist of a single, circular DNA molecule, we believe that it forms the basis for future extension to genomes consisting of multiple chromosomes.
After deriving the quasispecies equations for semiconservative systems, we proceeded to solve them for the simplest landscape, that of the static single fitness peak. As with conservative replication, the solution of the single fitness peak yielded two regimes: A viable regime, where the population is localized about the “master” genome, and an unviable regime, where the population is delocalized over the genome space. The transition between the two regimes is known as the error catastrophe.
The main difference between conservative and semiconservative replication is that for conservative replication, it is possible to push the error catastrophe to arbitrarily high replication error rates by increasing the growth rate constant of the master genome. In semiconservative replication, on the other hand, the probability of correct replication must always be greater than , in order to avoid the error catastrophe.
Semiconservative replication is therefore considerably less robust to the effect of mutagens than conservative replication. Furthermore, the existence of a lower bound to semiconservative replication fidelity explains why above the error catastrophe, mutagenic agents kill more rapidly replicating cells faster than more slowly replicating cells. Thus, our model provides a mathematical basis for explaining the efficacy of chemotherapeutic agents in treating cancers.
Acknowledgements.
This research was supported by an NIH postdoctoral research fellowship, and by a Howard-Hughes Medical Institute pre-doctoral research fellowship.Appendix A Solution of the Static Single Fitness Peak Model for Semiconservative Replication
A.1 Finite Genome Size Equations
To begin, let us define the internal Hamming distance . Also, let denote the subsequence of bases where and are identical, and and denote the subsequences of bases in and , respectively, where they differ. Then given some gene sequence , we can break it up into two subsequences and . denotes the subsequence of bases in corresponding to the subsequence of bases where , are identical. denotes the subsequence of remaining bases. This is illustrated in Figure 3.
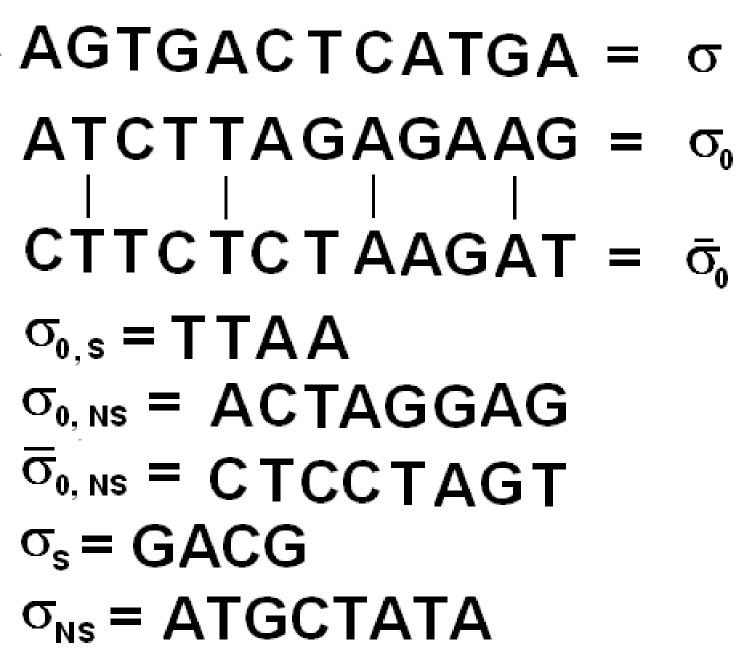
Given some gene sequence , we can then characterize it by the following numbers: (1) . (2) . (3) . (4) , so is simply the number of positions where differs from both and .
Now, any may be generated from any by making the appropriate base changes. We can make changes to as follows:
-
1.
Let denote the number of changes to where and are identical. There are possibilities for this set of changes.
-
2.
Let denote the number of changes to back to the corresponding base in , where and are distinct. The degeneracy in this case is .
-
3.
Let denote the number of changes to to bases distinct from the corresponding bases in , where and are distinct. The degeneracy is .
-
4.
Let denote the number of changes to where , are identical, to bases other than the corresponding ones in . The degeneracy is .
-
5.
Let denote the number of changes to where , are identical, to the corresponding bases in . The degeneracy is .
-
6.
Let denote the number of changes to where , are identical, to bases other than the corresponding ones in . The degeneracy is .
-
7.
Let denote the number of changes to where , are identical, to the corresponding bases in . The degeneracy is .
-
8.
Let denote the number of changes to , where is distinct from and , and the bases are changed to the corresponding bases in . The degeneracy is .
-
9.
Let denote the number of changes to , where is distinct from and , and the bases are changed to the corresponding bases in . The degeneracy is .
-
10.
Let denote the number of changes to , where is distinct from and , and the bases are changed to bases other than the corresponding ones in and . The degeneracy is .
The series of changes to defined above yield a which is at a Hamming distance of from . Furthermore, the values of , , , and for are given by,
| (21) |
Now, we will assume that depends only on , , and . At time , we start the evolution by setting for all , and if , and if . Therefore, unless and or . So certainly depends only on , , and at the start of the evolution. Also, by similar reasoning, we see that the fitness landscape also depends only on , , . If we can show that this implies that depends only on , , , then depends only on , , throughout the evolution.
So, consider some time for which the depend only on , , , for all given characterized by , , . Then we may write . We also write . Summing over the contributions from the , obtained by the base changes described above, we obtain,
| (22) | |||||
Note from the sum that for any two , characterized by the same , , and . Therefore, the assumption that is determined by , , is justified.
We may sum over and to obtain,
| (23) | |||||
Now, the total number of sequences characterized by the Hamming distances , , and is given by . Then define . We may convert our differential equations from the to the representations. After some tedious algrebra, the final result is,
| (24) | |||||
A.2 The Infinite Sequence Length Equations
We are now in a position to derive the infinite sequence length form of the quasispecies equations. We allow while keeping fixed. Furthermore, let us define , so is the fraction of bases in and which differ. If we let denote the probability density for , then in the limit of infinite sequence length we obtain that , where is the Dirac -function. Therefore, we take in the limit.
A slight complication arises in the infinite sequence limit, namely, that as . This means that it is impossible for and to simultaneously be finite. For if is finite, then and vice versa. The appropriate way to solve these equations is therefore to solve for finite values of , , and . Then we can redenote by , and solve in the infinite sequence limit. The symmetry of the landscape allows us to obtain the finite population fractions as well, since the population fraction for finite , , and is then simply given by .
In the following subsection, we show that as , the only terms which survive the limiting process are the terms. We also have,
| (25) |
| (26) |
| (27) |
Using the fact that as , we obtain, after some manipulation (and after redenoting by ), the infinite sequence length equations,
| (28) | |||||
where we have redenoted by , and by .
It should be clear that . Therefore, is the total fraction of the population with genome . This gives, .
Now, as , the sequences and become infinitely separated. Therefore, we expect that the values of for finite , , to be dictated by the single fitness peak at . Thus, for large , we expect to obtain a locally single fitness peak model in which we can then assume that depends only on the Hamming distance to . In the following subsection, we prove this rigorously. We may then group the population into Hamming classes, as with the single fitness peak for conservative replication. Specifically, we define , and finally obtain the infinite sequence length equations given by Eq. (17).
A.3 Additional Calculational Details
A.3.1 Derivation of the Infinite Sequence Length Equations from the Finite Sequence Length Equatiions
In this appendix, we derive the infinite sequence length form for from the corresponding finite sequence length equations. Before proceeding, however, we derive some basic inequalities which we will need to use. First of all, note that each must be . Furthermore, note that . We also have, , and for .
We wish to show that in the limit of , the only terms which contribute to the dynamical equations are the terms. We prove this by showing that for each of the above indices, the total contribution from all the nonzero terms becomes arbitrarily small as with held fixed.
So, we start with the index. From the inequalities given above, we may note that the summand of Eq. (A4), denoted by , has the upper bound,
Now, at fixed , choose to be sufficiently large so that . Then certainly . We then have,
| (30) |
Now, let . Also, note that , for . Therefore, note that an upper bound for the product given above is simply, . Therefore, as , so that in such a way that is fixed, we see that the contribution of the terms to the evolution dynamics approaches . Therefore, we need only consider the terms in the limit of infinite sequence length. Using a similar argument to the one given above, we can systematically eliminate the contributions from the as well. This establishes the infinite sequence length form of our differential equations. We should note that convergence to the infinite sequence length form is not uniform, as can be seen by the dependence of our upper bound.
A.3.2 Simplification of the Infinite Sequence Length Equations
We wish to show that, as , we may assume that becomes dependent only on , which will thereby allow us to considerably simplify the infinite sequence length equations (Eq. (A4)).
To proceed with this simplification, let us first determine the effect that depending only on has on . We have, . But, . Putting everything together, we obtain,
| (31) |
A similar procedure yields,
| (32) | |||||
As , we get,
| (33) |
giving, . Therefore,
| (34) |
We wish to show that it is this relation which is preserved by the evolution equations. Note that at time , we have , so that this relation holds at . If we can show that if this relation holds for all at some time , then it holds for , it follows that it holds throughout the evolution.
We note also that only depends on in the limit of infinite sequence length. Therefore, we may define , with , and otherwise. So, suppose at some time we have that Eq. (A14) holds for all . Then, after switching notation from to , we have,
| (35) | |||||
The last two lines are derived by noting that the product of the factorials, , is equal to, , and then by noting that . This relation can be derived by expanding in two different ways: First by direct expansion using the binomial theorem, and second by expanding , , separately, and then taking the product. Matching powers of yields the relation given above.
Note that that we have shown that for all throughout the evolution. Then given some , let us collect all the population at Hamming distance from by defining . We then have, . Therefore, using the expression for , we immediately obtain the infinite sequence length equations given by Eq. (17).
Appendix B Notes on the Implementation of the Stochastic Simulations
To allow for independent verification of the semiconservative error catastrophe, we develop a stochastic framework that directly simulates the population dynamics of evolving organisms. These simulations are stochastic in that replication and error events occur with some probability at each time step in the simulation.
Although the stochastic system we develop mirrors the system described in the semiconservative quasispecies equations, we do not include any a priori information from these equations in our simulations.
The stochastic system consists of a population of organisms. Each organism contains a genome with two strands: and its complement . Each genome sequence is associated with a probability of replication that describes the probability that an individual with that genome will replicate at each time step. If a genome is chosen to replicate, the strands separate into two daughter organisms which proceed to replicate the opposing strand. Each base on that strand is correctly replicated with a probability of . After complimentary strand synthesis, lesions in the genome of the daughter organisms are repaired, and in the absence of parent-strand-specific repair mechanisms the “correct” base-pairing is retained in the daugher with probability .
In order to maintain a relatively constant population size in our system, we impose the constraint that is less than or equal to some . To meet this constraint, after a round of replication proceeds through the population, if , individuals are removed from the population until . Each individual in the population has equal probability () of being removed at this step.
Although we employ a single-gene, single-fitness-peak model for the purposes of this work, the stochastic framework described here is very general and may be employed to explore the dynamics of populations in much more complicated systems.
References
- Eigen (1971) M. Eigen, Naturewissenschaften 58, 465 (1971).
- Eigen et al. (1989) M. Eigen, J. McCaskill, and P. Schuster, Adv. Chem. Phys. 75, 149 (1989).
- Swetina and Schuster (1982) J. Swetina and P. Schuster, Biophys. Chem. 16, 329 (1982).
- Tarazona (1992) P. Tarazona, Phys. Rev. A 45, 6038 (1992).
- Galluccio (1997) S. Galluccio, Phys. Rev. E 56, 4526 (1997).
- Pastor-Satorras and Sole (2001) R. Pastor-Satorras and R. Sole, Phys. Rev. E 64, 051909 (2001).
- Altmeyer and McCaskill (2001) S. Altmeyer and J. McCaskill, Phys. Rev. Lett. 86, 5819 (2001).
- Franz and Peliti (1997) S. Franz and L. Peliti, J. Phys. A: Math. Gen. 30, 4481 (1997).
- Campos and Fontanari (1998) P.R.A. Campos and J.F. Fontanari, Phys. Rev. E 58, 2664 (1998).
- Alves and Fontanari (1998) D. Alves and J.F. Fontanari, Phys. Rev. E. 57, 7008 (1998).
- Nilsson and Snoad (2002) M. Nilsson and N. Snoad, Phys. Rev. E 65, 031901 (2002).
- Nilsson and Snoad (2000) M. Nilsson and N. Snoad, Phys. Rev. Lett. 84, 191 (2000).
- Tannenbaum et al. (2003) E. Tannenbaum, E.J. Deeds, and E.I. Shakhnovich, Phys. Rev. Lett. 91, 138105 (2003).
- Tannenbaum and Shakhnovich (2003) E. Tannenbaum, and E.I. Shakhnovich, cond-mat/0306224, (2003) (submitted to Phys. Rev. E).
- Kimura and Maruyama (2003) M. Kimura, and T. Maruyama, Genetics, 54, 1337 (1966).
- Voet and Voet (1995) D. Voet and J. Voet, Biochemistry (John Wiley and Sons, Inc., New York, NY, 1995), 2nd ed.