Vibrational Properties of Nanoscale Materials: From Nanoparticles to Nanocrystalline Materials
Abstract
The vibrational density of states (VDOS) of nanoclusters and nanocrystalline materials are derived from molecular-dynamics simulations using empirical tight-binding potentials. The results show that the VDOS inside nanoclusters can be understood as that of the corresponding bulk system compressed by the capillary pressure. At the surface of the nanoparticles the VDOS exhibits a strong enhancement at low energies and shows structures similar to that found near flat crystalline surfaces. For the nanocrystalline materials an increased VDOS is found at high and low phonon energies, in agreement with experimental findings. The individual VDOS contributions from the grain centers, grain boundaries, and internal surfaces show that, in the nanocrystalline materials, the VDOS enhancements are mainly caused by the grain-boundary contributions and that surface atoms play only a minor role. Although capillary pressures are also present inside the grains of nanocrystalline materials, their effect on the VDOS is different than in the cluster case which is probably due to the inter-grain coupling of the modes via the grain-boundaries.
pacs:
63.22.+m,61.46.+w,81.07.Bc,02.70.NsI Introduction
The current interest in nanotechnology makes nanoclusters as well as nanocrystalline materials the subject of many research activities. Nanoclusters, i.e., particles with diameters in the nanometer range containing between a few hundreds and hundreds of thousands of atoms, are the building blocks of so-called cluster-assembled materials. An understanding of the clusters is therefore necessary in order to control manufacturing and properties of the resulting materials. Nanocrystalline materials are polycrystalline materials with grain sizes below 100 nm. The interest in these materials is motivated by the fact that the small grain sizes give nanocrystalline materials unique physical properties which are different from those of their coarser-grained counterparts. A general introduction to both, nanoclusters and nanocrystalline materials can be found in Ref. Edelstein and Cammarata, 1996.
One possible method for the synthesis of nanocrystalline materials is the inert gas condensation technique. In this process, nanoparticles produced from the gas phase are deposited on a substrate and subsequently in-situ compacted and sintered.Edelstein and Cammarata (1996); Siegel et al. (1988) This technique as well as the similarity of the dimensions of nanoclusters and the grains in nanocrystalline materials provide a kind of link between both systems and several authors have compared vibrational properties calculated theoretically for clusters with experimental results of nanocrystalline materials.Kara and Rahman (1998); Hu et al. (2001) In this work, we present results for the vibrational density of states (VDOS) in nanoclusters and nanocrystalline materials obtained from molecular-dynamics simulations using the empirical tight-binding potentials of Cleri and Rosato.Cleri and Rosato (1993) The fact, that we have derived the VDOS for both types of systems with the same model potential, enables us to demonstrate that it is impossible to describe the VDOS of nanocrystalline materials in terms of the VDOS of the clusters since the dominating effect are different in the two kinds of systems. While the VDOS of nanoparticles is governed by the large number of surface atoms and the presence of a rather homogeneous compressive capillary pressure, the VDOS of nanocrystalline materials is dominated by large volume proportion of grain-boundary atoms and the coupling of the individual grains via the grain boundaries.
A crucial point for the simulation of nanocrystalline materials is the elaboration of an appropriate model with a realistic grain-boundary structure. The most widely used approaches to generate models of nanocrystalline materials are the controlled solidification of a liquid used by Phillpot, Wolf and GleiterPhillpot et al. (1995a, b) and the Voronoi construction employed by Chen,Chen (1995) Schiøtz, Di Tolla and Jacobsen,Schiøtz et al. (1998, 1999) as well as Van Swygenhoven and Caro.Van Swygenhoven and Caro (1997, 1998) However, both of these methods give fully dense systems with negligible amounts of free volume, whereas the experimentally observed densities vary between 75 and 97 % of the density of their coarser grained counterparts.Nieman et al. (1991); Siegel (1996) For this reason we have employed another approach in the preparation of our nanocrystalline model systems. The models used for this work were obtained from simulations of the consolidation of nanoparticles into nanocrystalline materials. This approach mimics the experimental preparation of nanocrystalline materials by inert gas condensation and leads to porous systems with realistic densities. The reason why this method is not widely used in the literature is that the simulation of the consolidation is computationally very demanding. Early applications of this techniqueLiu et al. (1994); Zhu and Averback (1995) were therefore strongly limited in the size of the simulated systems. However, the rapidly growing capabilities of modern parallel computers made it possible for us to simulate the consolidation of model systems with more than one million atoms.
Experimentally, it has been found that nanocrystalline metals exhibit an anomalous increase of the VDOS at low energies.Trampenau et al. (1995); Fultz et al. (1996); Frase et al. (1998); Bonetti et al. (2000); Stuhr et al. (1998) Similar enhancements have been observed in computer simulations.Wolf et al. (1995); Derlet et al. (2001) In Ref. Derlet et al., 2001, a nickel model based on the Voronoi construction has been compared with an early version of our model for nanocrystalline copper. From this comparison of a fully dense model with a porous model, the dominating effect of the grain-boundary atoms on the VDOS of nanocrystalline metals was deduced. We obtain the same results from a comparison of the VDOS of one model system derived at different stages of the densification.
For a discussion of the vibrational properties of nanoparticles it is useful to distinguish between the surface and the core of the particles. In their work on the vibrational properties of clusters, Kara and Rahman reported that the VDOS of the inner atoms of a cluster is very similar to the VDOS of the corresponding bulk material but shifted to higher energies.Kara and Rahman (1998) Later, it has been shown that this shift is caused by the capillary pressure acting inside nanoparticles.Meyer et al. (2002) Naturally, the distinction of surface and core contributions requires a suitable definition of these regions. In Ref. Kara and Rahman, 1998, the core (or inner part) of the cluster was defined to consist of all atoms with the bulk coordination number . The problem with this definition is that a lot of the atoms with near the surface show a very different behavior than those deep inside the cluster. For this reason it seems more reasonable to use a definition that gives smaller and more homogeneous particle cores. This was done in Ref. Meyer et al., 2002 by considering the second invariant of the local stress tensor, which turns out to be fairly constant inside the particles. The disadvantage of this method, however, is that it contains some arbitrariness since the onset of the deviation of has to be determined by manual inspection. Here, we propose another criterion based on the common neighbor analysis (CNA)Honeycutt and Andersen (1987) which yields very similar results than the method used in Ref. Meyer et al., 2002 without arbitrariness.
For a macroscopic spherical particle of radius it is known that inside the sphere acts a capillary pressure of magnitude
| (1) |
where is the (average) surface stress of the material. Previously, it has been shown for two different types of embedded-atom method potentials that this equation remains valid for particles in the nanometer regime.Swaminarayan et al. (1994); Meyer et al. (2002) In the present work we find that, for the empirical tight-binding potentials of Cleri and Rosato,Cleri and Rosato (1993) Eq. (1) holds for particles with diameters above a critical size of approximately 2.5 nm. Moreover, we report the values of the surface stress for Ag, Au, Cu, Ni, and Pt obtained from our simulations with the help of Eq. (1).
II Details of the Calculations
II.1 General
In this article we report on results of molecular-dynamics simulations employing the empirical tight-binding second moment potentials of Cleri and RosatoCleri and Rosato (1993) for the calculation of the interatomic forces. These potentials, which are fitted to the experimental values of cohesive energy, lattice parameters and elastic constants, have been successfully applied in many works concerning clustersLópez et al. (1995); Celino et al. (1996); Palacios et al. (1999); Sun et al. (2001); Darby et al. (2002); Michaelian et al. (2002); Rexer et al. (2002); Aguilera-Granja et al. (2002) and nanocrystalline materials.Celino et al. (1995a, b); Van Swygenhoven and Caro (1997); Derlet et al. (2001); Derlet and Van Swygenhoven (2002); Samaras et al. (2002) The equations of motion in our simulations were integrated with the help of the velocity form of the Verlet algorithmAllen and Tildesley (1991) using a time-step . All simulations were carried out at a room temperature (). For systems containing more than a few thousands of atoms it becomes unfeasible to calculate the frequencies of the vibrational modes by diagonalization of the dynamical matrix. For this reason we derived phonon density of states from the Fourier transform of the velocity autocorrelation function obtained from the simulations using the methods described in the book of Allen and Tildesley.Allen and Tildesley (1991) The knowledge of the VDOS makes it possible to calculate a number of thermodynamic properties within the harmonic approximations. Here, we use the VDOS to derive the specific heat per atom of the simulated systems with the help of
| (2) |
II.2 Nanoparticles
For the investigation of nanoparticles we have simulated Ag, Au, Cu, Ni, and Pt nanoparticles with diameters in the range of 2 to 10 nm. As in our previous work,Meyer et al. (2002) the simulations were started with spherical configurations of 531, 791, 1205, 1865, 3043, 8247, 17957, and 36417 atoms on an fcc lattice. During the initialization, care was taken to achieve vanishing total momenta and angular momenta of the systems. These configurations were then equilibrated at K over a period of 50 000 simulation steps before the main simulation runs of another 50 000 steps.
After the simulations we used the CNA to group the atoms in the final configurations into four classes: perfect fcc (PFCC) atoms with an fcc environment up to the fourth neighbor shell, good fcc (GFCC) atoms with an fcc environment in the first neighbor shell, surface atoms (SURF) with coordination number , and other atoms (OTHR). It turns out that for the 531 and 791 atom clusters the PFCC group is identical to the core found with the previously-used method.Meyer et al. (2002) Motivated by this finding we identify in what follows the particle cores with the PFCC atoms. The advantages of this definition are that, on the one hand, it leads to much more homogeneous cores than the simple coordination number criterion of Ref. Kara and Rahman, 1998 while, on the other hand, it avoids the arbitrariness of the method employed in Ref. Meyer et al., 2002.
The core definition explained in the preceding paragraph enables us to calculate the capillary pressure acting inside the particles as a sum over the local pressures at the core atoms:
| (3) |
Here, is the mass of particle while , , and are the Cartesian components () of the velocity of particle , the force acting between particles and and their distance, respectively. Furthermore, angular brackets denote thermal averaging and the primed sums run over all core particles, i.e., all PFCC particles. Finally, is the number of particles in the core and the average atomic volume of the core particles which we have derived from the mean nearest neighbor distance inside the core as .
In order to compare the capillary pressures obtained from Eq. (3) with the prediction of Eq. (1) the radius of the particle has to be known. Since, to our knowledge, there is no exact and unique definition of the radius of a cluster, we adopted here the previously used simple scheme for this purpose.Meyer et al. (2002) Thus, the cluster radius is defined to be equal to the largest distance of a particle with coordination number from the particles center of mass.
Finally, we have derived the partial contributions of the four groups of atoms (PFCC, GFCC, OTHR, and SURF) to the total VDOS of the particle. This was done by averaging the individual VDOS contributions obtained from the velocity autocorrelation function of 1000 simulation runs over a period of 25 000 steps, each. Such a long simulation time was necessary to compensate for the poor statistics caused by the small number of particles in the system.
II.3 Nanocrystalline Materials
As stated in the introduction the nanocrystalline model configurations used in this work were obtained from simulations of pressure-assisted nanoparticle sintering. With this method we have constructed models for nanocrystalline Cu, Ni, and Ag.
The starting point of the sintering simulations were configurations composed of the equilibrated configurations of clusters described in the preceding section. Randomly oriented copies of these clusters were placed in a cubic box with twice the volume of a bulk system with the same number of atoms. In order to avoid overlapping of the clusters in the initial configurations, the positions of the clusters were determined with the help of a Monte-Carlo procedure. In this procedure, the clusters were regarded as point particles interacting by a purely repulsive pair potential.Weeks et al. (1971) For each pair of particles the range of the potential was chosen to be larger than the sum of the particle radii plus the interaction range of the Cleri and Rosato potential used in the molecular-dynamics simulations. Due to this construction the interaction energy in the Monte-Carlo simulation is exactly zero if all clusters are well separated and positive otherwise. Starting from arbitrary positions the clusters were then moved in trial steps which were only accepted if they resulted in a lower total interaction energy. This procedure was continued until the total energy remained zero for 100 continuous trial moves of all clusters. Details of the numbers and sizes of the clusters used for the generation of the initial configuration are given in Table 1.
| 20 | 3043 | 4.0 | 3.9 | 4.5 |
|---|---|---|---|---|
| 60 | 8247 | 5.6 | 5.5 | 6.3 |
| 15 | 17957 | 7.3 | 7.2 | 8.3 |
| 5 | 36417 | 9.3 | 9.1 | 10.5 |
After their generation the starting configurations were simulated at constant temperature and pressure using the Parinello-Rahman schemeParrinello and Rahman (1980) restricted to orthogonal simulation boxes and the Nosé-Hoover thermostat method.Hoover (1985) The application of the latter method was necessary to remove the excess energy released during the densification from the system. The simulations were started with a simulation run at zero pressure over 50 000 simulation steps (100 ps). Another 50 000 simulation steps were then performed at a hydrostatic pressure of 100 MPa. This predensification phase was followed by three consecutive simulation runs at pressures of 0.7, 1.4, and 2.1 GPa with a length of 100 000 steps (200 ps), each. In the last step, the intermediate configurations resulting from the simulations at 0.7, 1.4, and 2.1 GPa were slowly relaxed to zero pressure, again. This was done in a simulation where the pressure was reduced by 175 MPa after each 2500 simulation steps. Eventually, the simulations of the relaxed systems were continued for 10 000 steps at zero pressure in order to diminish possible perturbations caused by the stepwise reduction of the pressure. The nominal grain sizes of the final configurations, calculated under the optimistic assumption that each of the initial particles forms one grain in the resulting material, are 7 nm in the case of Ag and 6 nm for Cu and Ni. The actual values, however, will be somewhat higher since during the compaction surely some of the particles joined to form single grains.
The models resulting from the relaxation of the the systems after the sintering under different pressures enabled us to analyze the VDOS of the nanocrystalline metals at different densities. We did this analysis for the models of nanocrystalline copper obtained from maximum pressures of 0.7 and 2.1 GPa. For these configurations we derived the VDOS from the velocity autocorrelation function averaged over 10 consecutive simulation runs with a length of 10 000 steps, each. In addition to the total VDOS, we calculated the partial contributions of the following groups of atoms, identified by a CNA analysis of the averaged atomic positions: atoms with a perfect fcc or hcp environment up to at least the fourth neighbor shell (PFCC, PHCP), good fcc or hcp atoms with an fcc or hcp like environment in the first and more neighbor shells (GFCC, GHCP), surface atoms with coordination number (SURF) and grain boundary atoms (GB) not belonging to any of the other groups.
Nanocrystalline materials inherently contain a certain amount of excess volume in the form of open or closed pores. In order to analyze the free volume in our model configurations we followed a procedure similar to that described by Campbell et al.:Campbell et al. (1999) we subdivided the simulation boxes into a regular grid of voxels (the 3-d equivalent of a pixel) and performed an analysis of the clusters of empty voxels. However, in contrast to Campbell et al., we did not use simple cubic voxels for this analysis but the Wigner-Seitz cell of the fcc lattice since this choice gives considerably less anisotropic voxels. The edge length of the voxels were chosen to be 5.75, 5.60, and 6.50 a. u. for Cu, Ni, and Ag, respectively. Incomplete voxels, resulting from the incommensurability of the simulation boxes with respect to the voxel lattice, were excluded from this analysis.
III Results
III.1 Nanoparticles
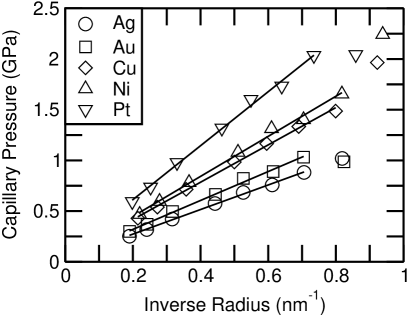
In Fig. 1 we present the capillary pressures inside the nanoparticle configurations calculated from our simulations with the help of Eq. (3) and fitted to the simple model of Eq. (1). From this figure it is clear that Eq. (1) accounts for the capillary pressure in all configurations except the smallest ones. Thus, within the Cleri and Rosato potentials the scaling regime where the capillary pressure scales monotonously with the system size extends down to particle sizes of 2 to 3 nm. For the smallest clusters below this size, Fig. 1 shows strong deviations from the linear behavior of Eq. (1) whose signs and magnitudes vary strongly between the elements.
| Ag | Au | Cu | Ni | Pt | |
|---|---|---|---|---|---|
| 1.2 | 1.4 | 1.8 | 2.0 | 2.7 | |
| 1.4111Ref. Wasserman and Vermaak, 1970 | 1.2222Ref. Mays et al., 1968–3.2333Ref. Solliard and Flueli, 1985 | 0.0444Ref. Wasserman and Vermaak, 1972 | 2.6444Ref. Wasserman and Vermaak, 1972 - 4.4333Ref. Solliard and Flueli, 1985 |
The fact that the capillary pressure inside the simulated nanoparticles follows the linear relationship of Eq. (1) makes it possible to derive the average surface stress for the different elements. The results are presented in Table 2 together with some experimental data. Two points have to be noted here. First, in the case of Cu, there is a remarkable difference between our result and the experimental value. However, compared to the other metals, it is the experimental value which seems to be exceptionally low. In fact, in Ref. Wasserman and Vermaak, 1972, two different surface stresses of 0.0 and 5.3 N/m have been reported. These values follow from lattice constant measurements using two different electron diffraction spots. The authors of Ref. Wasserman and Vermaak, 1972 reject the higher value since the corresponding observations of the (111) peak were less reliable than those of the (220) peak which gave the lower value. The second point to be noted is the strong scatter in the experimental data of Au and Pt. One possible reason for this are the relatively large error bounds of up to 1 N/m. In addition to this, Solliard and Flueli report that their values for the surface stress of Au have been increased by the occurrence of structural changes of the clusters.Solliard and Flueli (1985) However, consistent calculation of the surface stress from Eq. (1) is only possible if all data points correspond to the same structure. Taking all these experimental uncertainties into account, the surface stresses resulting from our simulations are in good agreement with the experimental data. In order to shed more light on the case of Cu, independent measurements or ab-initio calculations would be highly desirable.
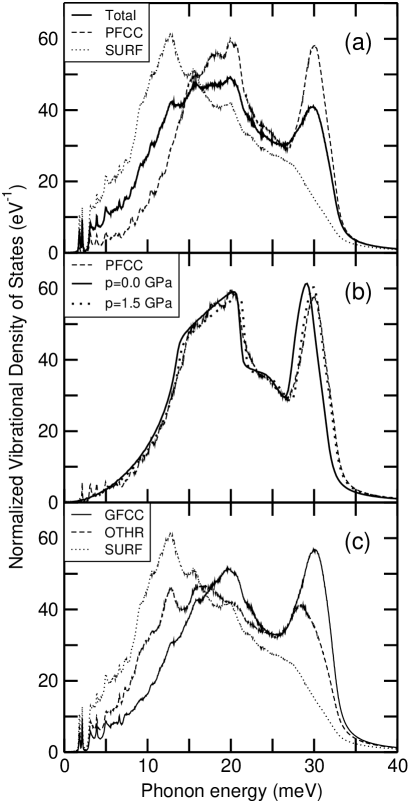
The VDOS of the particle and its partial contributions are shown in Fig. 2. In the upper panel, Fig. 2(a), the contributions from surface and core atoms are compared to the total VDOS, demonstrating the huge differences between both contributions. While the core contribution has two clearly separated peaks corresponding to the longitudinal and transversal modes of the fcc VDOS, the surface contribution has only one peak at energies below the transversal peak of the core and a shoulder at the position of the longitudinal peak. The form of the surface VDOS resembles closely the VDOS found near flat surfaces.Black (1990) From these results, it is clear that the surface atoms lead to a significant increase of the VDOS of nanoparticles at low energies whereas they reduce the VDOS at the upper end of the spectrum.
In Fig. 2(b) the particle’s core VDOS is given together with the VDOS of crystalline fcc Cu under pressures of 0. and 1.5 GPa, where 1.5 GPa corresponds to the capillary pressure acting on the cluster’s core. This comparison reveals, in accordance with previous findings,Meyer et al. (2002) that the VDOS inside the core of a nanoparticle is well accounted for by the bulk system under pressure. In particular, the capillary pressure gives rise to a small shift of the longitudinal peak to higher energies, thereby slightly increasing the high-energy VDOS.
Finally, Fig. 2(c) shows the three non-core contributions to the VDOS of the particle. From this figure, it can be seen that there is a gradual transition from the GFCC to the SURF contribution which reflects the geometry of the three groups of atoms: The perfectly fcc ordered core is directly surrounded by a shell of GFCC atoms. The GFCC atoms in turn are surrounded by subsurface atoms with coordination numbers followed by the outermost layer of surface atoms with .
III.2 Nanocrystalline Materials
During the simulations of nanoparticle sintering, the systems evolved from a gas of individual particles via a loose agglomerate of particles to a dense solid material. An important parameter of this compaction process is the relative density defined as the actual density of the system divided by the density of the corresponding crystalline bulk material. From the relative density it can be seen how much excess volume remains in the compacted system. In Table 3 we report the relative densities of our simulated nanocrystalline materials after the sintering pressure had been removed. Not surprisingly, the relative density increases for all three elements as the sintering pressure (and time) increases. However, there are some subtle differences between the metals which are worth noting. After compaction without application of an external pressure Cu and Ni both show the same relative density of 77 % whereas the Ag system has a considerable lower density of 70 %. In contrast to this, the picture has changed at the end of our simulations, where the Ag system has the highest density, followed by Cu and Ni.
| Cu | Ni | Ag | |
|---|---|---|---|
| 0.0 | 0.77 | 0.77 | 0.70 |
| 0.7 | 0.89 | 0.85 | 0.90 |
| 1.4 | 0.94 | 0.89 | 0.96 |
| 2.1 | 0.96 | 0.92 | 0.98 |
The different behavior of the three metals during the compaction described in the previous paragraph can be understood from the differences of the stacking-fault and surface energies of the three metals. At the beginning of the compaction, when the system is not a solid system but a loose powder, the compaction rate is mainly determined by the surface energy of the metals which is the driving force behind the whole sintering process. Since the surface energy is highest for nickel (see e. g. Ref. Meyer et al., 2002) and lowest for Ag, the densification starts fastest for Ni and slowest for silver. However, as the compaction proceeds, further densification requires the plastic deformation of the particles which is controlled by the stacking-fault energy. The densities at the end of the simulations therefore reflect the fact that (experimentally as well as in the model) the stacking-fault energy in Ag is lower than in Cu which in turn is much lower than that in Ni.Meyer and Lewis (2002) The influence of the stacking-fault energy on the compaction rate can also be seen from the number of atoms with an hcp environment, which indicate the presence of stacking faults due to plastic deformation. Among the configurations belonging to the first line of Table 3 the Ag system has the lowest number of hcp atoms. This means that the system has undergone less plastic deformation than the other configurations and explains the rather low relative density of the silver system at this point. At the end of the simulations, however, the situation has reversed. Due to its high stacking-fault energy, it is now the Ni configuration which has the lowest number of hcp atoms as well as the lowest relative density.
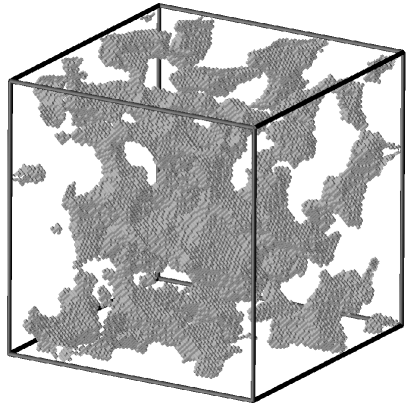
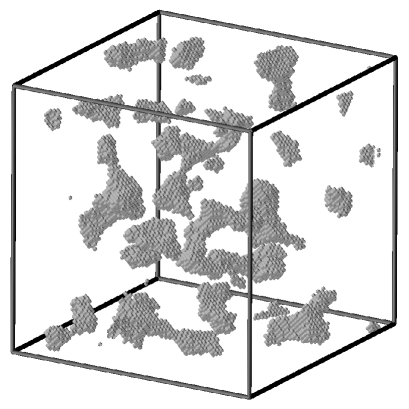
While the relative density gives information about the amount of excess volume remaining in the systems, it tells nothing about its structure or distribution. Such information can be gained from the free volume analysis described at the end of section II.3. Figure 3 shows the free volume found by this method in our models of nanocrystalline copper after sintering under pressures of 0.7 and 2.1 GPa with relative densities of 89 and 96 %, respectively. It can be seen that there is a significant difference between the pore structures of both systems. In the less dense system, most of the free volume is stored in one big percolating cluster, whereas in the denser system the free volume is distributed over several isolated clusters. This means that during the sintering the structure of the free volume changed from an extended network of open pores to a closed pore state. Analysis of all configurations shows the occurrence of extended open pores in all configurations with relative densities up to 90 % and closed pores at higher densities.
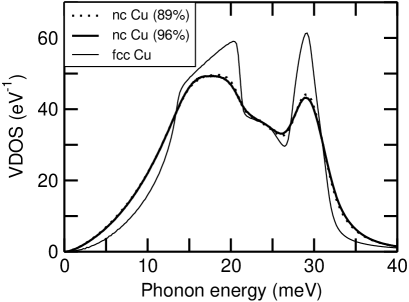
In Fig. 4, the total VDOS of the two Cu systems discussed in the previous paragraph are compared with that of crystalline fcc copper. The VDOS of both nanocrystalline systems show strong enhancements at high and low energies, as seen before theoreticallyDerlet et al. (2001) as well as experimentally.Bonetti et al. (2000) The important point here is that the curves of both nanocrystalline systems are nearly identical, although Fig. 3 shows clearly a big difference in the amount of internal surface area in both systems. This establishes that the enhancements are not caused by any kind of surface effects.
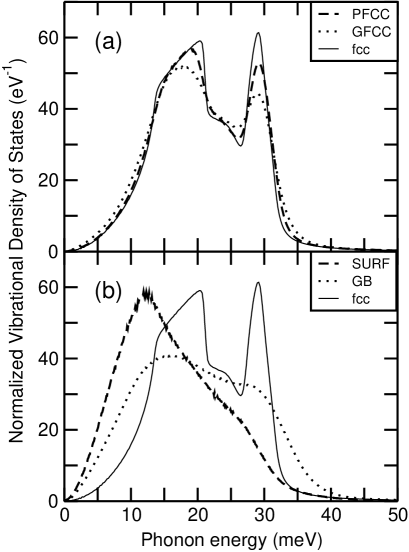
In addition to the total density of states we also calculated the partial contributions to the VDOS for our densest copper system. The results of these calculations are shown in Fig. 5. In panel (a), we compare the VDOS from atoms with perfect (PFCC) or good (GFCC) fcc environment, i.e., atoms inside the grains, with the crystalline VDOS. It can be seen that the VDOS inside the grains of the nc material is very similar to that of the crystalline bulk system. The difference consists of a slight broadening and a loss of the sharp structure of the peaks due the a lack of long range order and the presence of a strong stress field. Interestingly, the peak of the longitudinal modes is not at all shifted with respect to the crystalline VDOS. This is striking, since we find that a net pressure of 460 MPa acts on the PFCC atoms forming the core of the grains. Although lower than the capillary pressure acting inside the cluster one would expect that this pressure gives rise to a visible shift of the longitudinal modes. A possible reason for the observed different behavior is that the modes inside the grains are extended, i.e., they are coupled among the grains via the grain boundaries. In that case the looser coupling between the grains might counteract the stronger coupling inside the grains due to the capillary pressure.
Although the broadening of the intra-grain VDOS leads to a small increase of the VDOS at high and low energies, the effect is not strong enough to account for the strong increase of the total VDOS visible in Fig. 4. The biggest contribution to this increase stems from the high amount of grain-boundary atoms which show a very broad and nearly structureless VDOS with strong enhancements at high and low energies (see Fig. 5(b)). In contrast to this the VDOS of atoms at internal surfaces, also given in this figure, shows an even stronger increase of the VDOS at low energies but no increase in the high energy regime. This gives further support to the observation that the contribution of the surface atoms to the observed enhancements of the total VDOS is insignificant.
III.3 Nanoparticles vs. Nanocrystalline Materials
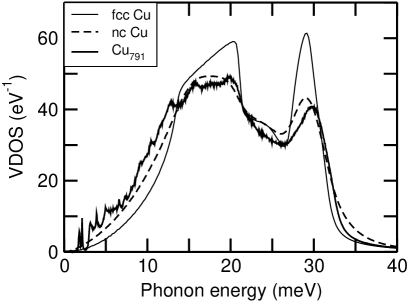
Having discussed our results concerning nanoparticles and nanocrystalline materials, we now compare directly the vibrational properties of the two kinds of systems. For this purpose we present in Fig. 6 the total VDOS of the cluster and nanocrystalline copper sintered at 2.1 GPa together with the VDOS of crystalline fcc copper. From this figure it can be seen that both nanoscale systems show a broadening of the VDOS which gives rise to an increase at high and low phonon energies. However, while for the nanocrystalline material the increase is similar on both sides of the spectrum, it is much stronger at low than at high energies in the case of the cluster. The reason for this difference lies in the nature of the atoms contributing most to the increase of the VDOS. As discussed above, the low and high energy enhancements of the VDOS in the nanocrystalline material are mainly due to the high number of grain boundary atoms which show a rather symmetric broadening of the VDOS (see Fig. 5(b)). In contrast to this it is clear from Fig. 2(a) that the VDOS enhancements in the cluster are driven by two different types of atoms: The strong low energy increase reflects the VDOS contribution of the surface atoms whereas the high energy increase is caused by the shift of the core VDOS due to the capillary pressure. Finally, it can be seen from Fig. 6 that the shift observed for the longitudinal modes in the cluster core only leads also to a visible difference between the VDOS of the cluster and the nanocrystalline material.
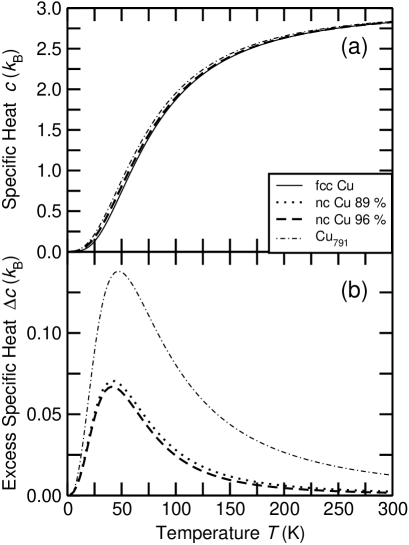
In order to study the effect of the VDOS changes in the nanoscale materials on other physical properties, we have calculated the specific heat of our model systems with the help of Eq. (2). The results presented in Fig. 7 reveal an increase of the specific heat in the nanoscale systems at low temperatures. All three nanoscale systems show the maximum of the excess specific heat with respect to the crystalline state at a temperature around 50 K. The height of this maximum, on the other hand, is much stronger in the case of the nanoparticle due to the stronger increase of the VDOS at low energies in this system. Our results here are in good qualitative and quantitative agreement with other theoretical results for Si nanoparticlesHu et al. (2001) and a nanocrystalline Lennard-Jones system.Wolf et al. (1995) Experimentally, excess specific heats have been observed for several nanocrystalline metals.Rupp and Birringer (1987); Tschöpe and Birringer (1993); Löffler (1994); Chen et al. (1995); Bai et al. (1996) At least in some of these works,Rupp and Birringer (1987); Tschöpe and Birringer (1993) the measured increase of the specific heat is considerably higher than the theoretical results. However, it has been pointed out by Tschöpe and BirringerTschöpe and Birringer (1993) that large part of the measured excess specific heat might be due to contaminations of the samples with lighter elements. Löffler,Löffler (1994) on the other hand, reports increases of the specific heat by approximately 7 % in nanocrystalline Pd, which compares well to our results although he finds the maximum of the increase at a temperature slightly above 150 K.
IV Summary and Discussion
In this work we have studied nanoparticles and nanocrystalline materials made of fcc metals with the help of molecular-dynamics simulations based on the empirical potentials of Cleri and Rosato.Cleri and Rosato (1993)
In order to distinguish between core and surface parts of the nanoparticles, we made use of the common neighbor analysisHoneycutt and Andersen (1987) and defined the core of the particles as the set of atoms with a perfect fcc environment. With the help of this criterion we studied the capillary pressure acting inside spherical nanoparticles of Ag, Au, Cu, Ni, and Pt with diameters between 2 and 10 nm. We find that the capillary pressure follows the same behavior as macroscopic spherical particles down to sizes of approximately 2.5 nm. These findings allowed us to derive the average surface stress values for Ag, Au, Cu, Ni, and Pt predicted by the potentials of Cleri and Rosato. Except for Cu our results agree with the available experimental data.
Our investigations of the VDOS of a nanoparticle show, in agreement with our previous findings,Meyer et al. (2002) that the VDOS inside the core of the cluster is identical to the VDOS of fcc copper under the capillary pressure. One particular effect of the capillary pressure is a shift of the longitudinal modes peak to higher energies. Outside the core the VDOS changes gradually to the typical surface behavior of the outermost atoms. Compared to the VDOS of the bulk material, the cluster VDOS appears to be slightly broadened with an increased VDOS at high and low energies due to the core and surface atoms, respectively.
The model configurations for nanocrystalline Ag, Cu, and Ni used in this work have been obtained from extensive simulations of the sintering of nanoparticles. These calculations resulted in nanocrystalline configurations of the three metals with different relative densities in the range 70 to 98 %. The development of the relative density of the three metals during the compaction process suggests that the compaction rate of the material is initially governed by the surface energy of the material. As plastic deformation becomes more and more important during the compaction, the stacking-fault energy starts to dominate the process. It should be noted, however, that the role of other mechanisms like surface or grain-boundary diffusion might be underestimated by our simulations since such processes are beyond the time-scale of molecular-dynamics simulations. Further analysis of the excess volume remaining in the nanocrystalline configurations revealed a transition from an extended open pore network to closed pores at relative densities above 90% for all three metals.
In Ref. Derlet et al., 2001 a model of nanocrystalline Ni based on the Voronoi construction has been compared with an early version of our model of nanocrystalline copper. This comparison showed that the experimentally observed enhancement of the VDOS of nanocrystalline materials at high and low energies is due to grain-boundary atoms, whereas the influence of atoms at internal surfaces is negligible. In the present work we obtain the same result, using one and the same model of nanocrystalline copper for all the calculations. Although we find a small pressure to be present inside the grains of our model systems, we do not observe a shift of the longitudinal modes in the nanocrystalline material. A possible explanation for this difference between the dense nanocrystalline material and the nanoparticle is the loose coupling of the modes inside the grains via the grain boundaries.
Our calculations of the specific heat of nanocrystalline Cu and a Cu nanoparticle show that the low energy VDOS enhancements in the nanoscale systems give rise to a pronounced peak in the excess specific heat. This result is in qualitative and quantitative agreement with other theoretical calculationsWolf et al. (1995); Hu et al. (2001) and at least in qualitative agreement with experimental findings.Rupp and Birringer (1987); Tschöpe and Birringer (1993); Löffler (1994); Chen et al. (1995); Bai et al. (1996)
This work provides a deeper understanding of the vibrational properties of nanoclusters and especially the differences between these two nanoscale systems. For future work it would be important to investigate how the strong stress field present inside the nanocrystalline model systems affects the vibrational properties as well as some general study of the properties of crystalline systems coupled by a disordered medium. Finally, it would be interesting to use some multi-scale method to relax our model systems beyond the time scale of molecular-dynamics simulations.
Acknowledgements.
We would like to thank Prof. R. Birringer for the provision of unpublished data of the specific heat in nanocrystalline Pd. This work has been supported by grants from the Canadian Natural Sciences and Engineering Research Council (NSERC), Québec’s Fonds québécois de la recherche sur la nature et les technologies (FQRNT, formerly FCAR) and Germany’s Deutsche Forschungsgmeinschaft (DFG). Most of the calculations have been performed on the facilities of the Réseau québécois de calcul de haute performance (RQCHP).References
- Edelstein and Cammarata (1996) A. S. Edelstein and R. C. Cammarata, eds., Nanomaterials: Synthesis, Properties and Applications (Institute of Physics Publishing, Bristol, 1996).
- Siegel et al. (1988) R. W. Siegel, S. Ramasamy, H. Hahn, L. Zongquan, L. Ting, and R. Gronsky, J. Mater. Res. 3, 1367 (1988).
- Kara and Rahman (1998) A. Kara and T. S. Rahman, Phys. Rev. Lett. 81, 1453 (1998).
- Hu et al. (2001) X. Hu, G. Wang, W. Wu, P. Jiang, and J. Zi, J. Phys.: Condens. Matter 13, L835 (2001).
- Cleri and Rosato (1993) F. Cleri and V. Rosato, Phys. Rev. B 48, 22 (1993).
- Phillpot et al. (1995a) S. R. Phillpot, J. Wang, D. Wolf, and H. Gleiter, Mat. Sci. Eng. A 204, 76 (1995a).
- Phillpot et al. (1995b) S. R. Phillpot, D. Wolf, and H. Gleiter, J. Appl. Phys. 78, 847 (1995b).
- Chen (1995) D. Chen, Comp. Mat. Sci. 3, 327 (1995).
- Schiøtz et al. (1998) J. Schiøtz, F. D. Di Tolla, and K. W. Jacobsen, Nature 391, 561 (1998).
- Schiøtz et al. (1999) J. Schiøtz, T. Vegge, F. D. Di Tolla, and K. W. Jacobsen, Phys. Rev. B 60, 11971 (1999).
- Van Swygenhoven and Caro (1997) H. Van Swygenhoven and A. Caro, Appl. Phys. Lett. 71, 1652 (1997).
- Van Swygenhoven and Caro (1998) H. Van Swygenhoven and A. Caro, Phys. Rev. B 58, 11246 (1998).
- Nieman et al. (1991) G. W. Nieman, J. R. Weertman, and R. W. Siegel, J. Mater. Res. 6, 1012 (1991).
- Siegel (1996) R. W. Siegel, in Nanomaterials, Synthesis, Properties and Applications, edited by A. S. Edelstein and R. C. Camarata (Institute of Physics Publishing, Bristol, 1996), chap. 9.
- Liu et al. (1994) C.-L. Liu, J. B. Adams, and R. W. Siegel, Nanostruct. Mater. 4, 265 (1994).
- Zhu and Averback (1995) H. Zhu and R. S. Averback, Mater. Sci. Eng. A 204, 96 (1995).
- Trampenau et al. (1995) J. Trampenau, K. Bauszus, W. Petry, and U. Herr, Nanostruct. Mater. 6, 551 (1995).
- Fultz et al. (1996) B. Fultz, J. L. Robertson, T. A. Stephens, L. J. Nagel, and S. Spooner, J. Appl. Phys. 79, 8318 (1996).
- Frase et al. (1998) H. Frase, B. Fultz, and J. L. Robertson, Phys. Rev. B 57, 898 (1998).
- Bonetti et al. (2000) E. Bonetti, L. Pasquini, E. Sampaolesi, A. Deriu, and G. Cicognani, J. Appl. Phys. 88, 4571 (2000).
- Stuhr et al. (1998) U. Stuhr, H. Wipf, K. H. Andersen, and H. Hahn, Phys. Rev. Lett. 81, 1449 (1998).
- Wolf et al. (1995) D. Wolf, J. Wang, S. R. Phillpot, and H. Gleiter, Phys. Rev. Lett. 74, 4686 (1995).
- Derlet et al. (2001) P. M. Derlet, R. Meyer, L. J. Lewis, U. Stuhr, and H. Van Swygenhoven, Phys. Rev. Lett. 87, 205501 (2001).
- Meyer et al. (2002) R. Meyer, S. Prakash, and P. Entel, Phase Trans. 75, 51 (2002).
- Honeycutt and Andersen (1987) J. D. Honeycutt and H. C. Andersen, J. Phys. Chem. 91, 4950 (1987).
- Swaminarayan et al. (1994) S. Swaminarayan, R. Najafabadi, and D. J. Srolovitz, Surf. Sci. 306, 367 (1994).
- López et al. (1995) M. J. López, P. A. Marcos, and J. A. Alonso, J. Chem. Phys. 104, 1056 (1995).
- Celino et al. (1996) M. Celino, F. Cleri, G. D’Agostino, and V. Rosato, Phys. Rev. Lett. 77, 2495 (1996).
- Palacios et al. (1999) F. J. Palacios, M. P. Iñiguez, M. J. López, and J. A. Alonso, Phys. Rev. B 60, 2908 (1999).
- Sun et al. (2001) H. Q. Sun, Y. Ren, Y. H. Luo, and G. H. Wang, Physica B 293, 260 (2001).
- Darby et al. (2002) S. Darby, T. V. Mortimer-Jones, R. L. Johnston, and C. Roberts, J. Chem. Phys. 116, 1536 (2002).
- Michaelian et al. (2002) K. Michaelian, M. R. Beltran, and I. L. Garzon, Phys. Rev. B 65, 041403 (2002).
- Rexer et al. (2002) E. F. Rexer, J. Jellinek, E. B. Krissinel, E. K. Parks, and S. J. Riley, J. Chem. Phys. 117, 82 (2002).
- Aguilera-Granja et al. (2002) F. Aguilera-Granja, J. L. Rodríguez-López, K. Michaelian, E. O. Berlanga-Ramírez, and A. Vega, Phys. Rev. B 66, 224410 (2002).
- Celino et al. (1995a) M. Celino, G. D’Agostino, and V. Rosato, Mater. Sci. Eng. A 201, 101 (1995a).
- Celino et al. (1995b) M. Celino, G. D’Agostino, and V. Rosato, Nanostruct. Mater. 6, 751 (1995b).
- Derlet and Van Swygenhoven (2002) P. M. Derlet and H. Van Swygenhoven, Phil. Mag. A 82, 1 (2002).
- Samaras et al. (2002) M. Samaras, P. M. Derlet, H. Van Swygenhoven, and M. Victoria, Phys. Rev. Lett. 88, 125505 (2002).
- Allen and Tildesley (1991) M. P. Allen and D. J. Tildesley, Computer Simulations of Liquids (Clarendon, Oxford, 1991).
- Weeks et al. (1971) J. Weeks, D. Chandler, and H. Andersen, J. Chem. Phys. 54, 5237 (1971).
- Parrinello and Rahman (1980) M. Parrinello and A. Rahman, Phys. Rev. Lett. 45, 1196 (1980).
- Hoover (1985) W. G. Hoover, Phys. Rev. A 31, 1695 (1985).
- Campbell et al. (1999) T. Campbell, R. K. Kalia, A. Nakano, F. Shimojo, K. Tsuruta, P. Vashishta, and S. Ogata, Phys. Rev. Lett. 82, 4018 (1999).
- Wasserman and Vermaak (1970) H. J. Wasserman and J. S. Vermaak, Surf. Sci 22, 164 (1970).
- Mays et al. (1968) C. W. Mays, J. S. Vermaak, and D. Kuhlmann-Wilsdorf, Surf. Sci 12, 134 (1968).
- Solliard and Flueli (1985) C. Solliard and M. Flueli, Surf. Sci. 156, 487 (1985).
- Wasserman and Vermaak (1972) H. J. Wasserman and J. S. Vermaak, Surf. Sci 32, 168 (1972).
- Black (1990) J. E. Black, in Dynamical Properties of Solids, edited by G. K. Horton and A. A. Maradudin (North Holland, Amsterdam, 1990), vol. 6.
- Meyer and Lewis (2002) R. Meyer and L. J. Lewis, Phys. Rev. B 66, 052106 (2002).
- Rupp and Birringer (1987) J. Rupp and R. Birringer, Phys. Rev. B 36, 7888 (1987).
- Tschöpe and Birringer (1993) A. Tschöpe and R. Birringer, Phil. Mag. B 68, 223 (1993).
- Löffler (1994) J. Löffler, Diplomathesis (Universität des Saarlandes, Germany, 1994).
- Chen et al. (1995) Y. Y. Chen, Y. D. Yao, S. S. Hsiao, S. U. Jen, B. T. Lin, H. M. Lin, and C. Y. Tung, Phys. Rev. B 52, 9364 (1995).
- Bai et al. (1996) H. Y. Bai, J. L. Luo, and D. Jin, J. Appl. Phys. 79, 361 (1996).