Influence of external information in the minority game
Abstract
The influence of a fixed number of agents with the same fixed behavior on the dynamics of the minority game is studied. Alternatively, the system studied can be considered the minority game with a change in the comfort threshold away from half filling. Agents in the frustrated, non ergodic phase tend to overreact to the information provided by the fixed agents, leading not only to large fluctuations, but to deviations of the average occupancies from their optimal values. Agents which discount their impact on the market, or which use individual strategies reach equilibrium states, which, unlike in the absence of the external information provided by the fixed agents, do not give the highest payoff to the collective.
pacs:
89.65.-s , 89.65.Gh , 89.20.-aI Introduction
The minority game has become an extensively used model of some aspects of financial markets CZ97 . It shows that complex behavior can arise from relatively simple mathematical rules, used to define a system of interacting agents. In addition, it is amenable to analytical treatment CMZ00 , and shows the usefulness of the methods of statistical physics for the study of problems of interest in economics, sociology, or biology MG . The model has been extensively analyzed, and it shows a phase transition between an ergodic phase, where the agents reach a well defined stationary state, and a non ergodic phase, where the evolution is strongly dependent on the initial conditions SMR99 . The ergodic phase can be well characterized by means of the replica formalism, well known in studies of systems with quenched disorder. The disorder in the minority game arises from random differences between the agents, associated to the strategies at their disposal (see below). There is no similar degree of understanding of the behavior of the agents in the non ergodic phase, where frustration and herding effects play a major role in determining the long time evolution. Relatively simple modifications of the rules of the game change significantly the results, for the parameter range where the ergodic phase occurs. These changes can modify, or even suppress, herding behavior. We can mention, among other variations, evolution based schemes, which allow for the use of the opposite outcome predicted by the “best” strategy Jetal99 , agents which discount the effect of their own choices on the market MC01 , or agents which use individual, instead of global, information CPG00 . The case where agents discount their impact on the market can be studied analytically, and it can be shown that the dynamics lead to a stationary state with small volatitlity, and which optimizes the benefits to the collective MC01 ; CMZ00b ; MM01 . It is known that, for the non ergodic phase in the standard version of the minority game, the available information is arbitraged away, making the difference between the actual histories and random data irrelevant C99 . On the other hand, the outcome of the game shows a significant dependence on the initial bias in the scores of the strategies, when this bias is allowed to have a finite valueHC01 .
In the present work, we will analyze further how the external information is processed in the non ergodic phase. For that purpose, we will assume that a given number of agents make always the same choice, inducing a bias in the outcome. The predictable behavior of these fixed agents can be considered as an external information source which can be processed by the remaining active agents. If the active agents were playing at random, the minority group would tend to be the one not preferred by the fixed agents. This situation corresponds to having a given number of correlated producers, in the generalization of the minority game described in CMZ00b ; MM01 . Alternatively, we can consider that the “comfort threshold” for the active agents has been shifted away from half filling by the presence of the agents with fixed choices. This situation was already considered in the initial version of the minority game A94 , and it has been further studied in Jetal99b . An extension of the analytical results for the standard minority game to a situation where the “comfort threshold” has been shifted can be found in CMO03 . A situation where all strategies used by the agents are biased towards a given outcome is discussed in Yetal03 . A related situation is that in which some agents prefer to be in the majority, considered in MGM03 . The existence of these “trend followers”, however, is not a source of information for the other agents.
The models studied will be more precisely defined in the following section. We present the main results in section III. Finally, section IV summarizes the conclusions, and compares the results with related work.
II The models
We study the minority game defined in the usual way. There are agents which use strategies each, assigned initially at random. These strategies associate a given binary outcome to a series of binary numbers, which represent the history of the game in the previous time steps. The number of possible strategies is . The goal of the agents is to choose the minority group, that is, the one chosen by less than half of the agents, . There is a given number of agents which always make the same choice, 1. Hence, the number of “active” agents is . The maximum number of active agents which can win at a given time is, obviously, , when active agents make the choice 1, and the remaining choose 0. The game becomes trivial if , as all the active agents will profit from making the choice 0. Note that in the standard version of the minority game there will be, on the average, a fraction of agents unable to make this choice, as the strategies available to them lead only to choice 1. The results to be discussed are averages over the possible distributions of strategies among agents.
We study three versions of the model, which differ in the way the score of the strategies available to the agents are updated, or in the information processed by the agents:
i) The standard minority game, as defined in CZ97 . Each agent updates the score of the strategies available to it according to whether the predicted outcome was successful (one point is added to the score) or unsuccessful (zero points are added).
ii) The individual minority game, as defined in CPG00 . The input used by each agent in order to decide the outcome predicted by a given strategy is the succession of events that it has experienced. A given (individual) history thus corresponds to the series of choices made by the agent.
iii) The minority game where agents discount the impact of the strategy which they have used on the global result CMZ00b ; MC01 ; CMZ00 . In order to take the impact into account, the score of the strategies is updated considering what would have happened if the agent had taken the opposite decision, and rewards the strategy used. For that purpose, we follow the linear payoff introduced in ref. CMZ00 , which considers an increase in the score of each strategy of agent in time of ; is the prediction of strategy (in terms of ), , and is the reward to the strategy played. In the following we use .
In all three cases, the total number of agents is , which is taken to be an odd number. Then, the number of winners cannot exceed . The fixed agents can also be on the winning side, and the same bound also applies to the winners among the active agents. In all three cases, the distribution of strategies among the active agents is completely random, with no particular correlation among the strategies at the disposal of each agent. The initial score of the strategies is set to zero, and thus the strategies assigned to each agent are equally good.
As mentioned in the introduction, the existence of players which always make the same choice is equivalent to a minority game with no fixed players, but where the “comfort” threshold has been shifted. We can assume that there are only agents, but that the winning outcome is 0 when the number of agents which make that choice is less than , which, in this case, is greater than one half of the number of agents.
III Results
III.1 The phase transition.
The analytical study of the minority game CMZ00 allows us to determine the existence and location, of the transition between the ergodic and non ergodic phase as function of the number of fixed agents, . Following ref. CMZ00b , the fixed agents considered here play the role of “producers”. These producers have only one strategy, which, in our case, is the same for all of them, and it gives the same decision for each possible history, so that, in the notation in CMZ00b , they are maximally correlated. The analytical results obtained there, valid in the “thermodynamic” limit when the number of agents and available strategies is large, describe how the phase transition between the symmetric and asymmetric phase depends on the the fraction of effective producers, which can be written as . This number is large, , which allows us to expand the implicit expression for the critical value of , in the Appendix in CMZ00b . We find that, at the transition:
| (1) |
when the number of strategies per agent is . When the number of fixed agents, , the game is in the ergodic phase. The expression in eq. (1) ceases to be valid when the assumption fails, that is, for .
When and , there is a phase transition for .
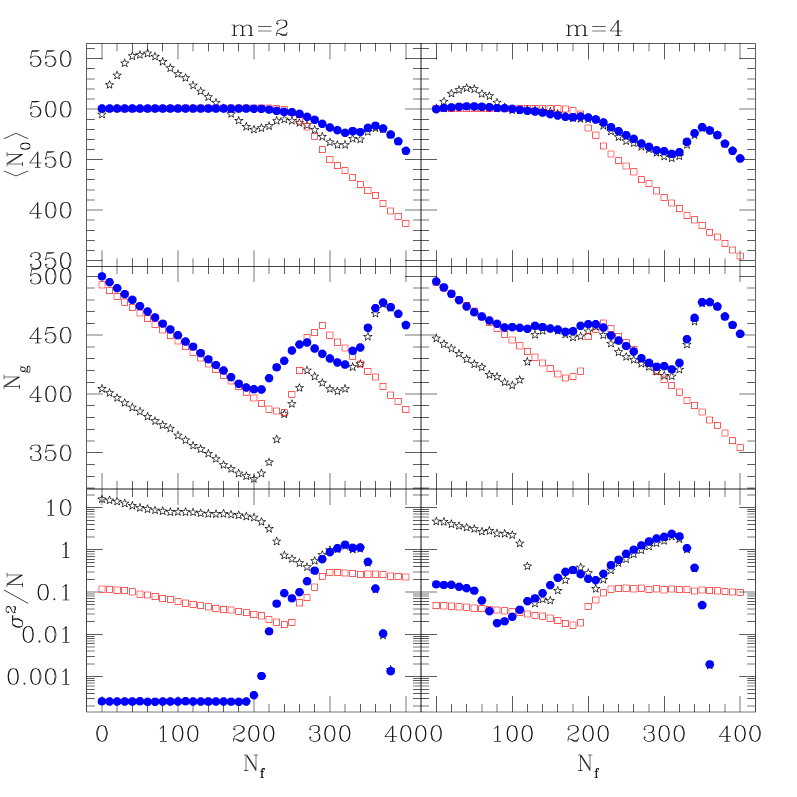
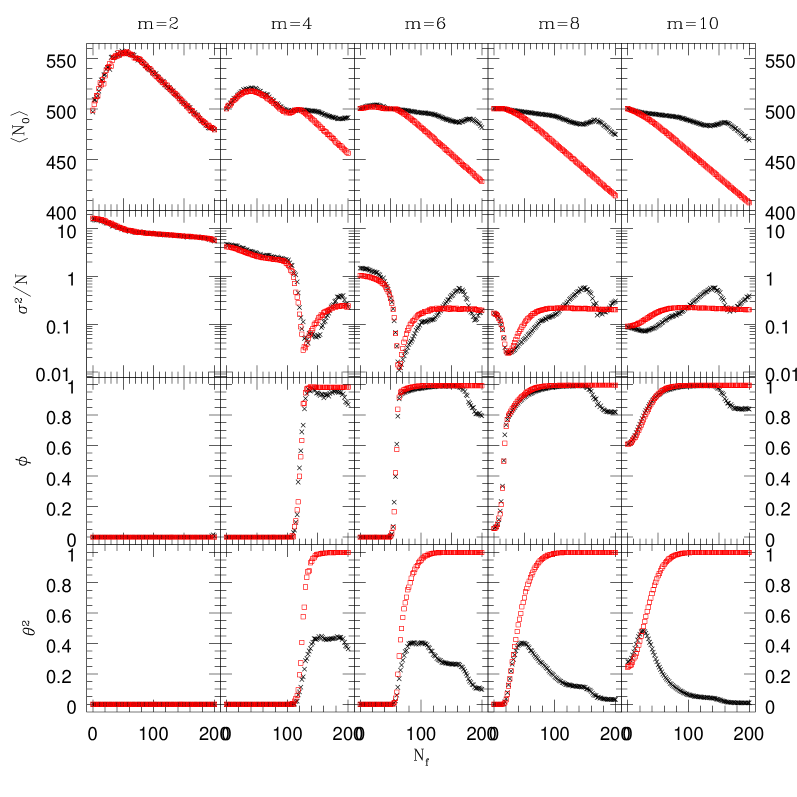
Results for different quantities and for the three versions of the minority game described in the previous section are shown in Fig. [1]. The number of agents is 1001. All quantities displayed have been calculated by averaging over 100 series of time steps, after the system has achieved a stationary state, each series corresponding to a different initial distribution of strategies among the active agents.
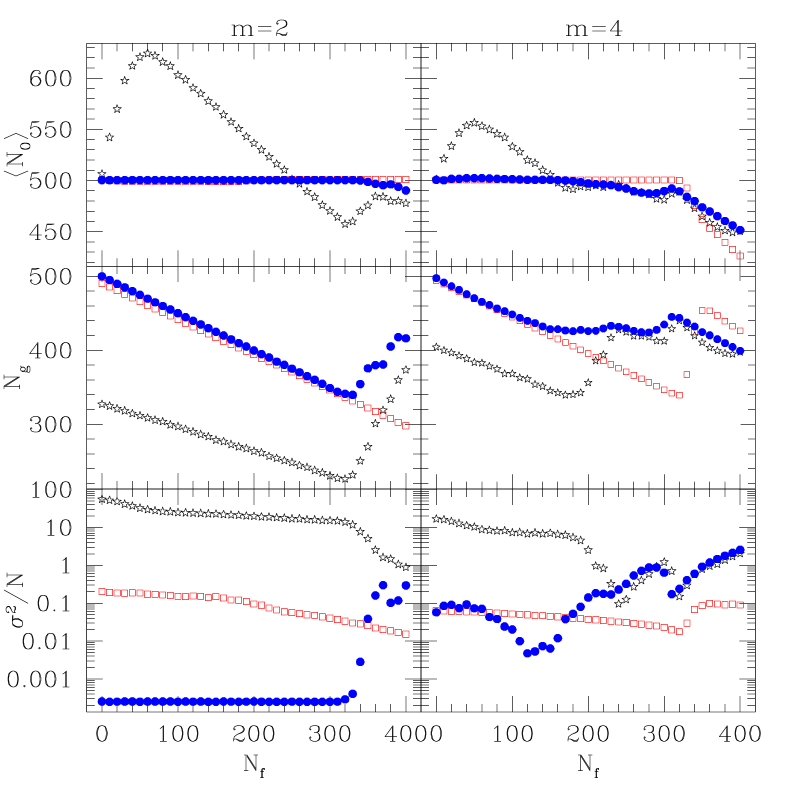
In the ergodic phase the discount of the market impact ceases to be relevant, and the volatility displayed in Fig. [1] is the same for cases i) and iii) defined in the previous section. The value at which this transition takes place is well described by eq. (1). Similar results are obtained for other values of the number of strategies assigned to each agent, as shown in Fig. [2]. The transition is shifted towards higher values of as we increase the number of strategies available to each agent, and the tendency for the agents to overreact to the information provided by the fixed agents in the standard version of the game and in the non ergodic phase is more pronounced (see in figs. [1] and [2]).
The fluctuations in the size of the minority group are reduced by the presence of fixed agents, in qualitative agreement with Yetal03 . The fraction of winners among the active agents is constant, within our numerical accuracy, in the non ergodic phase, and then it increases significantly as one enters the ergodic phase. The increase is also in agreement with the results in Yetal03 , where the efficiency of the game was increased with a biased pool of strategies. The initial plateau of the fraction of winners among the active players also agrees qualitatively with the slow rise found in Yetal03 .
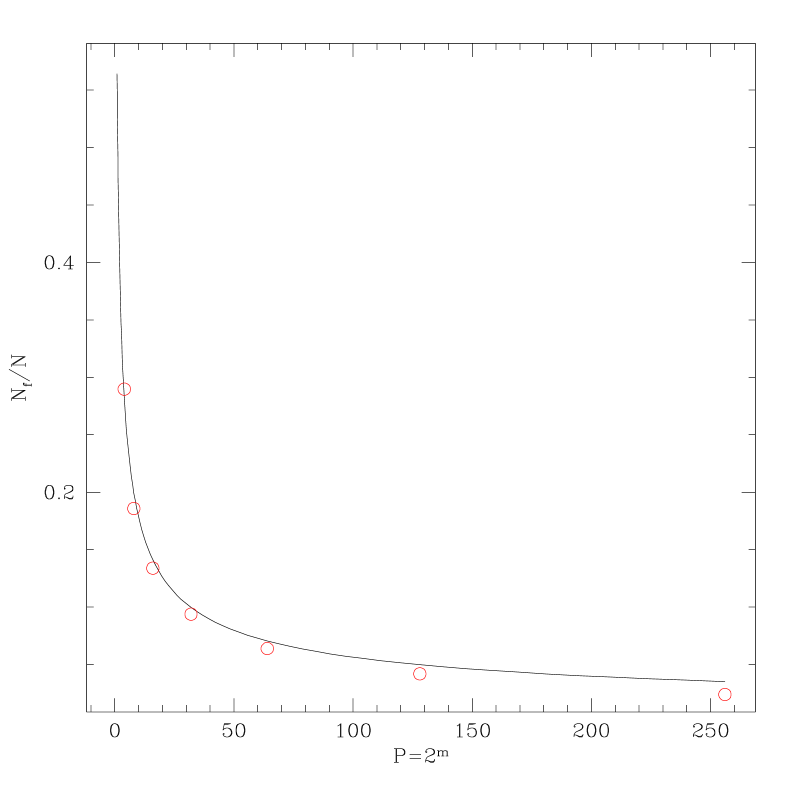
The transition from the non ergodic (symmetric) phase to the ergodic (asymmetric) phase, as function of the memory of the agents, , is shown in Fig. [3]. For comparison, we also show the transition line obtained using the analytical calculation in CMZ00b .
When the number of fixed agents is sufficiently large, the number of winners is equal to the number of agents which make choice 0, that is, which avoid the group chosen by the fixed agents. In addition, the dynamics converges to a stationary state where all agents which have the appropriate strategies available make choice 0. There is only one history describing the winning choice in this regime, . On average, there is a fraction of active agents which cannot make use of the winning strategies, . Thus, the average number of active agents which make the correct choice, 0, is . This situation is stable if the agents are indeed in the minority group, that is, if , which implies:
| (2) |
This inequality gives the threshold for the trivial dynamics when the number of fixed agents is sufficiently large, deep into the ergodic phase.
III.2 The non ergodic phase. “Overscreening” effects.
Inside the non ergodic phase, , where the value of is given in eq. (1), the number of agents making the opposite choice of that of the fixed agents, , is such that in the non ergodic phase, when the number of fixed agents is not zero (see fig. [6]). This choice makes the outcome highly unfavorable for the collective of active agents as the number of agents which can win cannot exceed .
The benefits of the collective in the non ergodic phase increase greatly when the agents are able to discount the impact of the strategies on the outcome, or use their own individual histories. Note that when agents discount the impact of the strategies, the score of a given strategy is not the same for all agents, making the situation somewhat similar to that in the individual minority game. In both variations of the standard minority game the number of winning agents, , is about half the number of active agents, . This is below the maximum number of possible winners, which is , provided that .
The most striking result is that, in the standard version of the minority game, the number of active agents which make choice 0 is larger than its optimal value in the non ergodic phase. This choice is the opposite to the choice made by the fixed agents. Thus, the active agents perceive the existence of the fixed agents, but there is a herding effect which induces them to make the opposite choice in numbers above the appropriate comfort level. In the language of a random spin model MPV87 , the active agents “overscreen” the external field induced by the fixed agents.
III.3 The non ergodic phase. Dynamics.
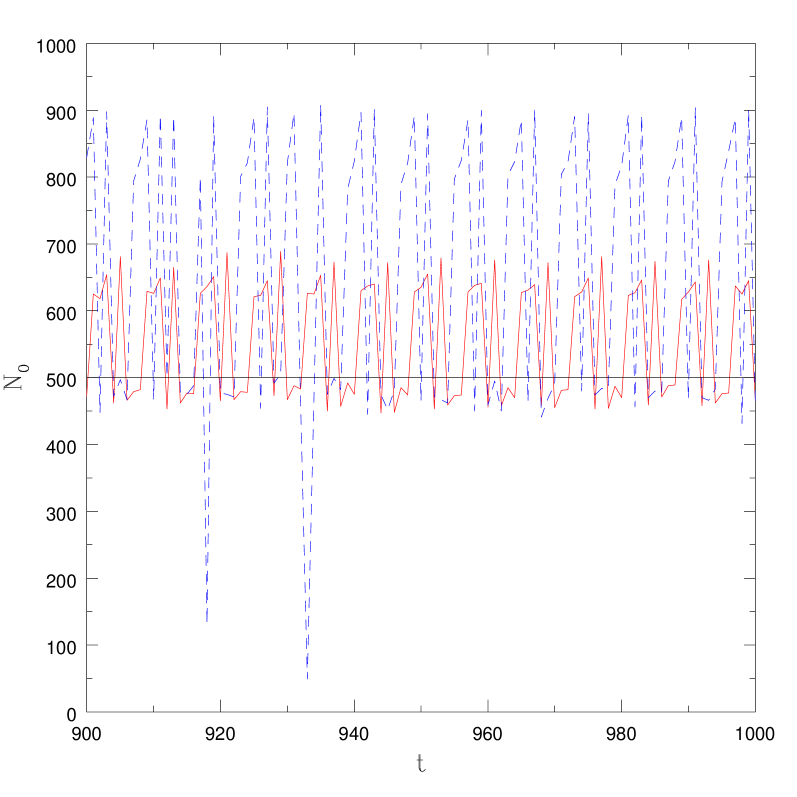
We have analyzed the “overscreening” of the information provided by the fixed agents in the standard minority game by studying individual time series in the non ergodic phase. Results are shown in Fig. [4], for a memory of two time steps, , and and strategies per active agent. The time series show well defined cycles with periodicity greater than the time horizon available to the agents, who are unable to make use of this information, as in the standard minority game without fixed agents SMR97 . These cycles are sometimes interrupted by strong deviations when . The origin of these spikes is unclear, although it is consistent with the enhancement of herding effects as the value of increases.
For the case the typical cycle spans eight time steps, where the winning choice follows the series . We can understand this cycle by assuming that there are two strategies with the highest score being used by the agents. These strategies are mutually opposite. They can be considered as representative of broad classes of strategies with similar outcomes CZ98 . We further assume that the score of these strategies can either differ by one unit (the minimum amount) or be equal, in which case the strategy used is decided by a coin toss. Then, i) At the beginning of the cycle the history processed by the agents is . We assume that the strategy with the highest score predicts . The majority of active agents follows this strategy so that the winning choice is 1. The score of this strategy and that of its opposite, becomes equal. ii) The history processed by the agents remains . The active agents take a random decision, and the majority group is determined by the fixed agents. The winning choice is 0, and the strategy becomes again the one with the highest score. iii) We now assume that the strategies predicting the two opposite outcomes after the history have equal score. The active agents make a random decision, and the outcome is determined by the choice of the fixed agents. The winning choice is 0, and the scores are updated accordingly. iv) We assume again that the strategies and have the same score. The winning choice is 0, and the scores are updated. v) The active agents use the history and take choice 0. The winning choice becomes 1, and the two strategies and have again the same score. vi) The history is . If the strategies predicting the two possible outcomes have the same score, the winning choice will be 0. vii) The history now is . The strategy with the highest score is , as fixed in step iii). The winning choice is 1. viii) The history is . The strategy with the highest score is , as fixed in step vi). The winning choice is 1, and the cycle repeats itself. This succession of events is schematically shown in Table[1].
| History | Strategy with the | Winning choice |
| highest score | ||
| 11 | 1 | |
| 11 | tie | 0 |
| 10 | tie | 0 |
| 00 | tie | 0 |
| 00 | 1 | |
| 01 | tie | 0 |
| 10 | 1 | |
| 01 | 1 |
The influence of the fixed agents is to determine the outcome in cases where two strategies which lead to opposite choices have the same score. The existence of these situations in the standard minority game leads to a rich structure in the size of the groups CPG99 , and to Gaussian fluctuations around the average values, due to the randomness in the outcomes. This randomness disappears in the presence of fixed agents. When two opposite strategies have the same score, around half of the active agents make one choice and the other half makes the opposite. The existence of fixed agents determines the majority group, which is that chosen by the fixed agents. Then, the active agents have a strong bias towards the opposite group the next time that the same history presents itself. This tendency leads to the overscreening of the information provided by the fixed agents. If the number of time steps in the history processed by the agents is , the cycle is usually of steps. These cycles appear in the non ergodic phase, where a majority of active agents are able to distinguish the “best” strategies. The tendency towards overscreening increases with the number of strategies available to the agents.
The information available to the agents in the series in Fig. [4], vanishes, because the outcome after a given history is totally unpredictable. Then, as we are using a binary payoff, the difference between the scores of the strategies of each agent averages to zero. This can be seen in Fig. [6], where we show how (, is the minority group in each time step), which indicates the amount of information on the time series is zero in the non ergodic phase.
III.4 Influence of the payoff function.
It is interesting to study the changes in the non ergodic phase when the payoff function used in updating the score of the strategies is proportional to the deviation from the optimal occupancy, instead of a step function, as commonly used when analytical methods are applied to the minority game CMZ00 . In this case, the condition that there is no information available to the agents implies that the average payoff for each strategy is zero. In order for this to happen, should be satisfied. Hence, the tendency towards overscreening in the ergodic phase described above does not lead to deviations of from its “natural” value. There is, however, a significant asymmetry in the distribution , as shown in Fig. [5]. There is a range of values of near for which is biased towards , as in the minority game with a binary payoff. This effect is compensated by the inverse asymmetry of when or . Note that, for the standard situation with no fixed agents, the distribution is significantly different from that in the minority game with a binary payoff CPG99 .

III.5 Random vs. actual histories.
We have studied the changes induced by replacing the actual histories by random variables in the standard version of the minority game, as initially discussed in C99 . The results are shown in Fig. [6]. We plot there a number of statistical averages which serve to characterize the minority game, like the fraction of “frozen agents”, which although in principle active, settle to use only one strategy at long times, , and the information stored in the history of the game CMZ00 , , which is the bias towards one of the two outcomes of the game when a given history appears on the time seriesoutcome . In the non ergodic phase, the agents are not able to distinguish between the actual histories and a succession of random events, as in the minority game without bias C99 . In the ergodic phase, however, the information provided by the fixed agents becomes relevant, and there is a difference between the actual game and that generated by a succession of random events.
The cycles shown in Fig. [4] are due to the sequential substitution of the strategy with the highest score by its opposite. Hence, a random succession of histories can give rise to the same overscreening. Thus, the results in the non ergodic phase do not change when the histories are random variables, as shown in Fig. [6]. The situation changes in the ergodic phase. When the histories processed by the agents are random but the winning choice is constant in time, 0, the score of each strategy will depend only on how often it contains 0 as an output. If the number of strategies at play is small, in the ergodic phase, the strategies with the highest score will contain a significant number of 1’s as outputs. Then, the agents will become frozen, and make, with similar probability, the two possible choices. This explains the results in the first row and right columns (high values of ) in Fig. [6], where about half of the active agents make the right choice, 0, and the other half choose 1, when the histories are random. As shown in the third row, most agents in this regime are frozen and the information in the dynamically generated histories is maximal CMZ00 (fourth row in Fig. [6]). This situation, where a significant number of active agents become frozen, is more difficult to achieve when the histories are dynamically generated by the agents themselves.
Finally, while the dynamics of the standard minority game in the non ergodic phase imply frequent situations where agents make choices using a coin toss, see table[1], the actual outcome of the game is fixed. Hence, we do not expect that this non deterministic aspect of the dynamics will play a significant role JHJ02 .
IV Conclusions
We have studied the minority game when a given number of agents make always the same choice. Hence, from the point of view of the remaining, active, agents, the predictable behavior of the fixed agents can be considered a source of external information. We have analyzed the standard version, the variant where agents use individual information, and that in which agents are able to discount the effect of their actions on the outcome.
The system shows a variety of interesting results in the non ergodic phase, where the ability of the agents to process the information available to them is highest:
i) In the standard minority game, the active agents tend to overscreen the information provided by the fixed agents, leading to disastrous effects for the collective (we are using the analogy with spin models, where the external information can be viewed as an applied field, to be screened by the dynamical spins which represent the agents). The number of agents in the minority group not only shows a large dispersion, as in the symmetric minority game, but its average is far from the optimal value. Assuming that there are agents, of which make always the same choice, 1, we find that the average of the number of active agents which make choice 0 is , while the optimal value is .
ii) The overscreening of the external information can be understood through the existence of cycles longer than the amount of time steps which the agents are able to process. The presence of the fixed agents determine the outcome of the situations when opposite strategies have the same score. This, in turn, leads to a strong bias of the active agents towards the group not chosen by the fixed agents. This bias proves catastrophic for the global benefit of the active agents.
iii) The gain made by the collective of active agents in the non ergodic phase is significantly improved when the agents use individual information, or are able to discount the effect of their own choices on the global outcome. The dispersion in the number of agents in the minority group is greatly reduced. The average number of winners, , however, fluctuates around the half the number of active agents, , while the maximum number of possible winners is , for .
iv) The results for the non ergodic phase are qualitatively the same when agents use individual information, and for the case where agents discount the effect of their strategies on the outcome. This is probably due to the fact that, in both cases, the score assigned to a given strategy is different for different agents.
These features imply that the existence of an external bias in the non ergodic phase of different versions of the minority game significantly reduces the global benefit of the agents with respect to the maximum possible value, which increases as external information is fed into the system.
The situation where the agents achieve the highest collective payoff, with respect to the maximum payoff which can be achieved takes place when the number of fixed agents vanishes. This fact is not contradictory with an increase in the efficiency of the game in absolute terms Yetal03 , as the opportunities for a given active agent are significantly increased by the presence of fixed agents.
On the other hand, the predictability of the outcome, in the non ergodic phase, is zero, as any outcome is possible after a given history CMO03 , despite the fact that the agents fail to guess the correct “comfort” threshold.
We have not considered here the influence of varying the initial scores of the strategies, which is expected to change the volatility in the non ergodic phase HC01 ; MC01 . The fact that the active agents are unable to remove the external information in the ergodic phase is in agreement with the results in CMO03 .
V Acknowledgements
We appreciate helpful comments, and a careful reading of the manuscript, to M. Marsili and D. Challet. We are thankful to Caja de Ahorros de Granada “La General” and MCyT (Spain) for financial support, through grant MAT2002-04095-C02-01.
References
- (1) D. Challet, and Y.-C. Zhang, Physica A 246, 407 (1997).
- (2) D. Challet, M. Marsili, and R. Zecchina, Phys. Rev. Lett. 84, 1824 (2000).
- (3) for more information, see http://www.unifr.ch/econophysics/minority
- (4) R. Savit, R. Manuca, and R. Riolo, Phys. Rev. Lett. 82, 2203 (1999).
- (5) N. F. Johnson, P. M. Hui, R. Jonson, and T. S. Lo, Phys. Rev. Lett. 82, 3360 (1999).
- (6) M. Marsili, and D. Challet, Phys. Rev. E 64, 056138 (2001).
- (7) M. A. R. de Cara, O. Pla, and F. Guinea, Eur. Phys. J. B 13, 413 (2000).
- (8) D. Challet, M. Marsili, and Y.-C. Zhang, Physica A 276, 284 (2000).
- (9) A. De Martino, and M. Marsili, J. Phys. A 34, 2525 (2001).
- (10) A. Cavagna, Phys. Rev. E 59, R3783 (1999).
- (11) J. A. F. Heimel, and A. C. C. Coolen, Phys. Rev. E 63, 056121 (2001).
- (12) W. B. Arthur, Am. Econ. Assoc. Papers Proc. 84, 406 (1994).
- (13) N. F. Johnson, P.M. Hui, D. Zheng, and C.W. Tai, Physica A 269 493 (1999).
- (14) D. Challet, M. Marsili, and G. Ottino, cond-mat/0306445. In order to compare the calculations there to our results, one needs to take into account that the bias of the strategies, in our case, is zero. In the notation used in this reference, our calculations correspond to and , where is the number of active agents, i.e., the total number of agents they used.
- (15) K. F. Yip. P. M. Hui, T. S. Lo, and N. F. Johnson, Physica A321, 318 (2003).
- (16) A. De Martino, I. Giardina, and G. Mosetti, preprint, cond-mat/0305625.
- (17) For completeness, the numbers of active agents making choices 0 and 1, and can be written using the notation in CMO03 as , and , where is the number of active agents (denoted as inCMO03 ).
- (18) M. Mézard, G. Parisi, and M. Virasoro, Spin Glass Theory and Beyond (World Scientific, Singapore, 1987).
- (19) R. Savit, R. Manuca, and R. Riolo, preprint, adap-org/9712006; R. Manuca, Y. Li, R. Riolo, and R. Savit, preprint, adap-org/9811005.
- (20) Note that in the non ergodic phase the information is arbitraged away, and the outcome of the game after a given history is unpredictable.
- (21) D. Challet, and Y.-C. Zhang, Physica A 256, 514 (1998).
- (22) M. A. R. de Cara, O. Pla, and F. Guinea, Eur. Phys. J. B 10, 187-191 (1999).
- (23) P. Jefferies, M. L. Hart, and N. F. Johnson, Phys. Rev. E 65, 016105 (2002).