Observation of vortex lattice melting in large untwinned YBa2Cu3O7-x single crystals
Abstract
We present a study of the vortex lattice in untwinned YBa2Cu3O7-x crystals, using a combination of muon spin rotation and neutron small angle scattering measurements. Both methods show a very sharp melting temperature consistent with a first order transition. The dependence of the melting temperature on the angle of the field with respect to the crystallographic -axis is studied. The results are compared to thermal measurements.
pacs:
DRAFT VERSION: NOT FOR DISTRIBUTIONI Introduction
Due to their short coherence length, long penetration depth and high anisotropy, the high-Tc superconductors (HTS), show very unusual behaviour. Apart from a proposed vortex-glass phase [3], which has probably been observed in the highly anisotropic Bi2Sr2CaCu2O8 (BSCCO) at high fields [4], there is also the exciting phenomenon of vortex-lattice melting in these compounds. Unlike in BSCCO, the vortex lattice melting transition in YBa2Cu3O7-x (YBCO) takes place at sufficiently high fields to be studied using thermal measurements such as differential thermal analysis (DTA) [5] and specific heat [6]. This is mainly due to the much lower anisotropy of YBCO ( 5). Apart from this phenomenological difference, there are however also more fundamental differences between YBCO and BSCCO in the crystallographic symmetry, which is orthorhombic in the former, while it is tetragonal in the latter. This leads to a fundamental difference in the growth of the samples, in that untreated YBCO samples are usually heavily twinned (having domains of interchanged and axes). The boundaries between these domains (twin-planes) act as very strong pinning sites to the vortices [7], which may change some of the properties of the vortex lattice in the sample. It has for instance been argued that such strong pinning may change the (intrinsically) first order transition to a second order transition [3]. This was also supported by the fact that the transitions observed (for instance by muon-spin rotation (SR) [4] and neutron small-angle scattering (SANS) [8]) in BSCCO were generally very sharp, not inconsistent with a first order transition, whereas twinned YBCO samples gave a more gradual transition. With the advent of sufficiently sized untwinned and high purity twinned samples, it became possible to study these effects in more detail using DTA[5] and specific heat[9] to determine the true thermodynamic properties of the phase transition. In untwinned samples, DTA measurements have clearly shown the existence of a first order transition[5], even though the sample wasn’t pure but had some Au impurities due to the growth process. In extremely pure samples, specific heat measurements have also shown a first order transition even though the sample was heavily twinned[9]. However, the twinned case is in general much more complicated than the untwinned one in that the order of the transition may also depend on the applied field[9]. The order of the transition is thus probably influenced by both kinds of defects (impurities and twin planes), where an excess of pinning sites of any kind drives the transition to second order.
Of further interest is the dependence of the melting transition on the angle of the field with respect to the -axis [10]. There are detailed predictions on the field dependence of the melting temperature (melting line) on the angle from anisotropic London theory [11]. The nature of the transition, especially the change in entropy at melting has however only recently been investigated [10, 12].
We have now performed SR and SANS measurements of the vortex lattice in a large untwinned crystal of YBCO with the field at different angles to the crystallographic -axis. As is the case in the DTA and specific heat measurements, we probe the equilibrium state of the vortex lattice. From SANS, we obtain a microscopic measurement of the global (long range) arrangement of the flux lines. Appropriately scaled, the SANS intensity presents a phenomenological order parameter of the flux lattice (see below). This allows investigations similar to those of specific heat or DTA, clarifying the order of the transitions. It should however be noted that the samples used in SANS are very much bigger than those used for thermal measurements. Thus a possibly present first order transition may already be smeared by slight inhomogeneities over the big sample volume. In contrast, with SR we observe the local magnetic field structure averaged over the sample. Therefore smearing effects may still be present, however a sharp change of the local equilibrium structure in itself may not be regarded as a sign of a first order transition. Due to the different time scales available to neutrons and muons one would expect to observe a difference in the melting line determined by the two methods if the transition is of a more glassy nature. For a (first order) phase transition, one would expect both methods of measurement to agree.
As will be shown below, our results differ quite strongly from those on a heavily twinned sample [13, 14]. There the melting transition observed with SANS is of second order, with the intensity decreasing to zero continuously at a temperature T Tc. In contrast our results show a sharp decrease of the SANS intensity with an infinite slope at Tm. This is consistent with a first order transition considering the large size of the sample (see below).
II Experimental Details
The sample consisted of a large (1.125 g) YBCO single crystal. It was grown untwinned by application af uniaxial stress during the cooling from the melt [15]. For the oxygenation process, the sample was treated in flowing O2 at 490∘C. Magnetisation measurements using a vibrating sample magnetometer (VSM) indicate a Tc of 93 K. The superconducting transition is estimated from these measurements to be 0.5 K. This also gives a limit for the sharpness of the melting transition (see below).
The SR experiments were carried out on beamline M3 at the Paul Scherrer Institute (PSI), Villigen Switzerland, with a maximum field of 0.6 T and a cryostat capable of cooling to 2 K. In the experiments, a magnetic field was applied perpendicular to the incoming muon spin polarisation, while at a specified angle to the crystallographic -direction of the sample. In this case, the spin of a stopped muon precesses with the frequency Bloc, where 135 MHz/T is the gyromagnetic ratio of the muon in the transverse local field Bloc. The angular anisotropy of the muon decay, leading to a preferred emission of the decay-positron in the direction of the muon spin due to parity violation, allows the time evolution of the muon polarisation to be measured. In the mixed state of a type-II superconductor, the magnetic field distribution is given by the structural properties of the vortex lattice (i.e. the penetration depth , the coherence length and the lattice morphology). The vortex lattice spacing is much bigger than the atomic spacing of the underlying crystal structure and is incommensurate to it. Therefore the muons sample the field distribution randomly, even though they are stopped at specific crystallographic sites. This allows the field probability distribution p(B) to be measured via the Fourier transform of the oscillating time signal. As the different local fields cause the muon spin to precess at different frequencies the time signal consists of a sum of oscillations at different frequencies weighted by their relative occurrence. In order to obtain the Fourier transform from the observed time data, we use a Maximum Entropy algorithm [16]. In this procedure aberrations of the spectra due to finite time windows or large statistical errors at long times are avoided, as the data are not subjected to a Fourier transform themselves. Starting from an initially flat field distribution p(B), the most uniform distribution compatible with the given time spectrum is obtained by maximising its constrained entropy
| (1) |
Here is the entropy of the distribution according to Shannon and is the usual measure giving the difference of the Fourier transform of p(B) () to the data in the time domain (), where is the error in the data.
The field distribution corresponding to a vortex lattice has very characteristic features arising from its two-dimensional periodicity. At extremal points in the spatial distribution the field probability distribution exhibits van Hove singularities. These singularities ideally are finite jumps at the minimum and maximum fields, and furthermore a logarithmic divergence at saddle points. Due to the very high fields in the vortex cores, the field distribution is highly asymmetric with a long ‘tail’ at fields higher than the average. In the entangled vortex liquid state however, the core fields are smeared out over a large distance. Therefore the high field tail is truncated leading to a symmetric lineshape. We quantify the asymmetry of the lineshape by the dimensionless parameter
| (2) |
A symmetric distribution corresponds to a value of , whereas a distribution with a high field tail has a positive .
The SANS experiments were carried out on instruments D11, D22 and D17 at the Institut Laue-Langevin (ILL), Grenoble France. The neutrons typically had a wavelength of = 1 - 1.5 nm and the beam was collimated over a distance of 2.75 m in the experiments carried out at D17, whereas the collimation length was 10 m in those at D11 and D22. The distance between the sample and the detector was then varied for optimal resolution. The incoming neutron beam was aligned with the applied field to an accuracy of 0.1∘ by observing the diffraction pattern from a Nb single crystal. The sample was mounted in a cryomagnet capable of a field of 5 T and a temperature of 1.5 K.
The neutrons are scattered from the spatial variations of the magnetic field in the sample, due to the magnetic moment of the neutron (), with the interaction energy . In the case of a type-II superconductor in the mixed state, the field variation is periodic giving rise to Bragg diffraction off the scattering planes of the vortex lattice [17, 18], where the angle of refraction is given by
| (3) |
Here is the lattice spacing, which depends on the applied field as for a hexagonal lattice ( = h/2e is the magnetic flux quantum). Thus the scattering is at very small angle, as typical vortex separations of 50 nm (corresponding to a field of 1 T) result in a Bragg angle (from Eq. 3) of 2 2∘. The intensity of neutrons scattered into a Bragg-peak, integrated over angle as the sample is rocked through the Bragg condition, is then mainly given by the square of the form factor of a flux line, which in the London approximation is given by
| (4) |
where is the penetration depth. The London approximation is valid in the case of an extreme type-II superconductor with , a condition well satisfied by the HTS. Therefore, for fields much greater than B, corresponding to 1, the scattered intensity depends on the penetration depth as . For a classical type-II superconductor, the temperature dependence of the scattered intensity therefore is a direct measure of that of the penetration depth. In the HTS however, where thermal fluctuations may have a dominant contribution this is not necessarily the case. In order to discern effects arising from the temperature dependence of and those of the thermal fluctuations finally leading to the melting of the lattice we divide the observed intensities by the temperature dependence of . This was obtained from the SANS intensity at a low field (0.2 T), where the effects of thermal fluctuations are negligible (see below). This quantity then takes the role of an effective flux line lattice (FLL) order parameter, which we use to observe the melting transition and its order.
Because the scattered intensity depends on the penetration depth as the intensity in the HTS is rather low, due to their long penetration depths ( = 150 - 200 nm). Furthermore, substantial background scattering from the cryostat and extended defects in the sample make it necessary to subtract a diffraction pattern taken above Tc to obtain a clear signal. Due to thermal contractions of the sample stick and cryostat, this background is shifted by fractions of a detector pixel in order to obtain a good subtraction. Thanks to the high neutron intensity at the instruments D22 and D11, a counting time of 30 minutes for each foreground and background was enough to obtain a reasonable signal.
III Results and Discussion
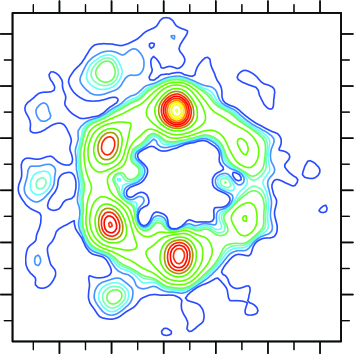
A typical diffraction pattern can be seen in Fig. 1 for an applied field of 0.2 T. There the field is applied at an angle of 33∘ to the -axis. This is why the observed pattern is isotropic. The distortion due to the -anisotropy ( = 1.16 [19, 20]) is compensated by the distortion due to the -anisotropy at an angle of 33∘. Furthermore, we note that second order diffraction spots are visible in the figure, indicating the high quality of the flux lattice. The intensities measured from such a pattern are obtained from fitting a gaussian to each individual Bragg-spot and taking the sum of all spots in order to reduce the statistical error. All of these measurements of scattered intensity rely on the fact that the width of the rocking curve does not change as a function of temperature. This is because the calculation relating the scattered intensity to the penetration depth is done for the total integrated intensity[21], which is given by the width of the rocking curve multiplied by the intensity when fulfilling the Bragg condition. The rocking curve width was checked to be constant for selected temperatures over a wide range. We therefore only consider the scattered intensities at the Bragg-angle.
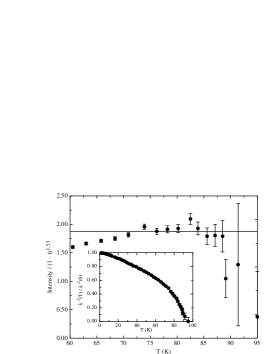
In order to determine an effective FLL order parameter we have to divide the intensity by its temperature dependence intrinsically given by the penetration depth. Therefore we have measured the scattered intensity at a low field (0.2 T) where the influence of thermal fluctuations should be small. The result can be seen in Fig. 2, where the intensity at 0.2 T is given divided by the expectation of the 3D XY model. As the figure shows, the approximation of the 3D XY model, with (1 - T/Tc)-0.33 is valid for temperatures well below Tc in all of the region of interest. In the determination of the order parameter, the intensity was thus divided by (1 - T/Tc)1.33 for simplicity. Furthermore the insert of Fig. 2 shows the temperature dependence over the full range. There we have plotted the square root of the scattered intensity to present the familiar dependence [22]. It can be seen that at lower temperatures the dependence is linear down to temperatures of 4 K, below which it saturates. For a d-wave superconductor, as the HTS are supposed to be, a linear temperature dependence would be expected down to the lowest temperatures from simple London theory. However when non-local interactions are taken into account [23], a saturation at very low temperatures is predicted, not inconsistent with our data. We will come back to the temperature dependence of below in the discussion of the melting line. However, we note that such a big range of applicability (down to 20 K below Tc) for the 3D XY model is surprising, as this is thought only to be valid in the region of critical fluctuations in close vicinity of Tc.
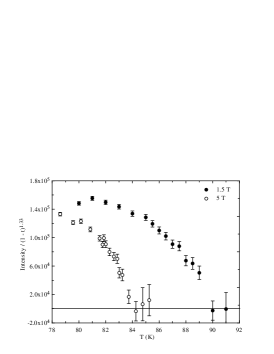
In Fig. 3, we present the temperature dependence of the FLL order parameter in the vicinity of Tc for two different fields. At both fields, the order parameter is constant at low temperature and decreases gradually towards the melting temperature. When the order parameter finally drops to zero, the change is very sharp occurring over a temperature range of less than 1 K. The gradual decrease of the order parameter can be modeled by including a Debye-Waller factor into the theoretical description of the scattered intensity. The final ‘jump’ however, is a sign of the transition being of first order. The width of the transition of 1 K is not much bigger than that observed at Tc, which may be due to sample inhomogeneities. Such inhomogeneities leading to a distribution of Tc may also lead to a distribution of Tm which would probably be of the same order of magnitude. Furthermore, the distribution of fields inside the sample is inhomogenious [24], as we will also see in the discussion of the SR results below, which will also lead to a further smearing of the melting temperatures. However, as this macroscopic field distribution is very narrow compared to the applied fields, this shouldn’t be a big factor. It is therefore not unreasonable to expect the melting transition in such a big sample to be distributed over an interval of 1 K. Note also that the order parameter (the scattered intensity) decreases to zero above the melting transition, in agreement with the expectation for an entangled vortex liquid [25, 26] made up of two-dimensional ‘pancake’ vortices.
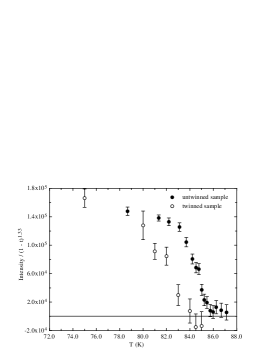
The situation for the untwinned sample has to be compared to that in a heavily twinned sample [13]. This is done in Fig. 4, where we show the FLL order parameter for both a twinned and our untwinned sample in a field of 4 T. As can be seen in the figure, the transition is much sharper in the untwinned one. The order parameter decreases more or less linearly over a range of 5 K in the twinned sample, as would be expected from mean field theory. In the untwinned sample in contrast, the transition is at most 1 K wide. Takeing also into account the temperature dependence at lower temperature, where the untwinned sample varies much slower than the twinned one, the behaviour of the untwinned sample is consistent with a first order transition. The width of the observed transition is furthermore not very much bigger than those determined from magnetisation[27] and thermal measurements[10], which are done on much smaller samples where inhomogeneities and possible residual twin-planes must play a much smaller role.
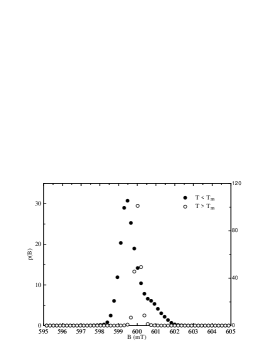
We now turn to the discussion of the SR results. Typical field probability distributions for temperatures above and below the melting transition can be seen in Fig. 5 for a field of 0.6 T. The situation is similar to that of BSCCO [4, 28], with a lineshape highly asymmetric towards high fields below the melting temperature. As was discussed above, the lineshape for an ideal lattice made up of straight vortex lines is expected to show such a high field tail. Above the melting temperature however, the field distribution is skewed the opposite way. This has been argued to arise from a macroscopic distribution of the local fields due to the sharp edges of the sample, with fields decreasing at the edges [29, 24]. This kind of macroscopic distribution is also present below the melting temperature, however the large width of the field distribution due to the well formed lattice overcomes this effect, such that an almost ideal distribution is observed. Above the melting temperature in contrast, the field distribution is smeared by the fast thermal fluctuations of the pancake vortices. This leads to a strongly decreases the width of the microscopic field distribution (‘motional narrowing’) and hence the observed distribution follows the macroscopic one.
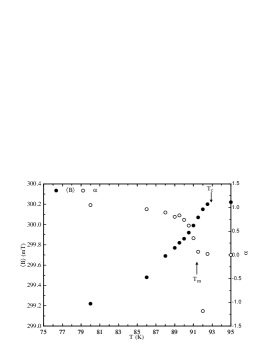
In Fig. 6, we present the temperature dependence of the SR lineshape asymmetry parameter , together with that of the mean internal field. The mean field allows a direct measurement of Tc via the onset of diamagnetic behaviour. As can be seen in the figure even at the very low field of 0.3 T, we observe a sharp melting transition in the temperature dependence of somewhat below Tc. The change in lineshape displayed in Fig. 5 manifests itself by a change in sign of . The transition is still very sharp, although thermal measurements are not sensitive enough to resolve a first order transition at such low fields. There have however recently been magnetisation measurements by means of torque magnetometry, resolving a step in magnetisation and hence a first order transition at similarly low fields [30].
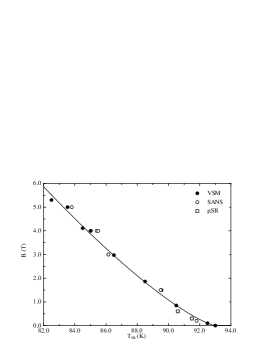
The field dependence of the melting temperatures thus determined (the melting line) can be seen in Fig. 7. In that figure we have also included the line of onset of irreversible magnetisation (irreversibility line, IL) as determined with a VSM. The microscopic melting line and the IL are in good agreement with each other. They follow a power law dependence of the form
| (5) |
A least squares fit to both sets of data simultaneously yields the values of = 100(10) T and n = 1.30(5). This is in excellent agreement with many other studies [5, 14, 13] on both twinned and untwinned samples. It is thus only the order of the transition, which is affected by the presence of disorder (e.g. in the form of twin-planes) and not the meltingline itself. The shape of the melting line has been the ground of some debate, as a dependence (1 - T/Tc)1.33 is expected for the vortex-glass transition proposed by Fisher et al. [3]. This would indicate that the observed melting line is more likely to be a glass transition, which would however be in contradiction with the observation of a first order transition. The temperature dependence of a melting line is usually calculated using the Lindemann criterion that melting occurs when the mean square displacements of flux lines make up a certain fraction of the intervortex separation . The Lindemann number is supposed to be a universal constant in all kinds of melting processes and theoretical estimates indicate it to be 0.1 - 0.2. Using this criterion and modeling the thermal fluctuations in the vortex lattice one can then derive an expression for the melting line [31]
| (6) |
Due to the mean field assumption of the temperature dependence of the penetration depth (T) (1 - T/Tc)1/2 this expression is usually taken to result in a value of n = 2. As we have seen however in Fig. 2, follows a powerlaw, such that the value of n = 1.33 is recovered over the range of temperatures where the meltingline can be determined. Furthermore, this expression allows a determination of , where is the only adjustable parameter. From the Intensity in the Bragg peaks, we have an independent determination of = 138 nm [19] and the anisotropy of our sample has been determined from the angular dependence of the SR linewidth as well as from the distortion of the SANS pattern at high angles to the -direction. Therefore our value of = 100(10) T corresponds to a Lindemann number of = 0.173(7). This is in excellent agreement with that found from the melting line in BSCCO using SR [28]. We would like to note at this point that the Lindemann number determined in BSCCO relied on a different expression for the thermal fluctuations taking into account the electromagnetic coupling between pancake vortices. This indicates that the Lindemann criterion may indeed be universally applicable.
Finally, we discuss the dependence of the melting transition on the angle of the applied field to the -direction. From the anisotropic scaling theory of Blatter et al. [11], a dependence of the melting line on angle is
| (7) |
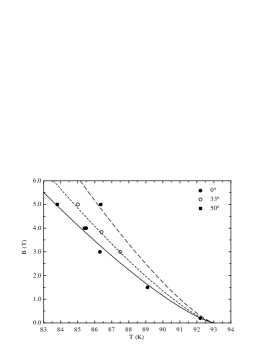
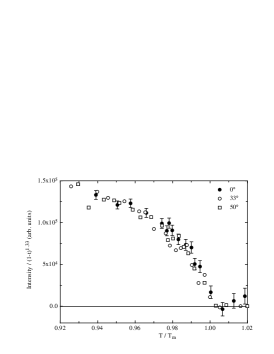
In the region of angles we investigated ( 50∘), the influence of on is very small such that it cannot be accurately determined this way. However using the value obtained from SR and the distortion of the pattern [20], we may calculate the expected melting lines at an angle from that determined parallel to . This has been done in Fig. 8, where we show the melting temperatures determined by SANS at the three different angles of 0∘, 33∘ and 55∘. The lines correspond to the fit to the melting line discussed above, where the dependence on the angle has been taken into account as well. As can be seen in the figure, the data are in good agreement with the expectations of the anisotropic scaling theory. This is similar to the results of DTA measurements of the melting transition as a function of angle [10]. In addition, that work also provided a determination of the entropy change at the transition as a function of angle. Due to a cancellation of the angular dependencies in the melting line and the magnetisation jump, the entropy-change turns out to be independent of the angle. This is not inconsistent with the SANS result displayed in Fig. 9, where the temperature dependence of the FLL order parameter is shown at the melting transition for different angles. The temperatures are normalised to Tm for direct comparison and the applied field was 5 T. The decrease of the order parameter can be seen to be independent of the angle as it should be for a constant entropy change at the transition.
IV Conclusions
In conclusion, we have presented SANS and SR measurements of the melting of the vortex lattice in a sample of untwinned YBCO. The observed behaviour is consistent with DTA measurements of the latent heat showing the existence of a first order transition [5, 10]. This is inferred from a phenomenological FLL order parameter in SANS, which decreases to zero sharply at the melting transition. These findings are compared to a previous SANS study of melting in twinned samples [13]. The same FLL order parameter vanishes continuously in that case, consistent with a second order phase transition.
We have furthermore studied the effects of anisotropy by applying the field at an angle to the -direction. The melting temperatures at constant field are consistent with the expectations of the scaling theory of Blatter et al. [11]. A determination of the anisotropy however is not possible, as the deviations of a cos () dependence are negligible in the range of angles studied. The nature of the transition is unchanged by having the field at an angle, consistent with the findings of Schilling et al. [10], who studied the dependence of the entropy change on angle.
The temperature dependence of the melting line is consistent with that expected from a Lindemann criterion [31], where the temperature dependence of the penetration depth follows that of the 3D XY model. The observed melting line extends down to very low fields (0.2 T), where SR still indicates a very sharp transition. The range of applicability of this temperature dependence is limited, as we have shown from the temperature dependence of the scattered intensity at low fields, where thermal fluctuations do not play an important role. For temperatures below 75 K the approximation becomes invalid. We would like to note that this is a rather unexpectedly big range of applicability of the critical exponent of the 3D XY model. Using the independently measured penetration depth [19] and anisotropy [20] for our sample, we have also determined the Lindemann number from the melting line, which turns out to be cL = 0.173(7). This is in very good agreement with the Lindemann number previously obtained from a detailed SR study of the melting line in BSCCO [28].
V Acknowledgements
We would like to thank Michel Bonnaud, Andreas Polsak, Pierre George (ILL) and Alex Amato (PSI) for technical support. Financial support from the EPSRC of the UK and the Swiss National Science Foundation is gratefully acknowledged. This work was funded in part by Oak Ridge National Laboratory, which is managed by Lockheed Martin Energy Research Corporation under contract No. DE-AC05-96OR22464 for the US DOE.
REFERENCES
- [1] Present address: Division of Physics and Astronomy, Faculty of Sciences, Vrije Universiteit, De Boelelaan 1081, 1081HV Amsterdam, The Netherlands.
- [2] Present address: Laboratoire de Physique des Solides, Bâtiment 510, Université Paris-Sud, 91405 Orsay, France.
- [3] D. S. Fisher, M. P. A. Fisher, and D. A. Huse Phys. Rev. B 43, 130 (1991).
- [4] S. L. Lee, P. Zimmermann, H. Keller, M. Warden, I. M. Savić, R. Schauwecker, D. Zech, R. Cubitt, E. M. Forgan, P. H. Kes, T. W. Li, A. A. Menovsky, Z. Tarnawski, Phys. Rev. Lett. 71, 3862 (1993).
- [5] A. Schilling, R. A. Fisher, N. E. Phillips, U. Welp, D. Dasgupta, W. K. Kwok, G. W. Crabtree, Nature 382, 791 (1996) and Phys. Rev. Lett. 78, 4833 (1997).
- [6] M. Roulin, A. Junod, E. Walker, Science 273, 1210 (1996).
- [7] G. Blatter, M. V. Feigelman, V. B. Geshkenbein, A. I. Larkin, V. M. Vinokur, Rev. Mod. Phys. 66, 1125 (1995).
- [8] R. Cubitt, E. M. Forgan, G. Yang, S. L. Lee, D. McK. Paul, H. A. Mook, M. Yethiraj, P. H. Kes, T. W. Li, A. A. Menovsky, Z. Tarnawski, K. Mortensen, Nature 365, 407 (1993).
- [9] A. Junod, M. Roulin, J.-Y. Genoud, B. Revaz, A. Erb, E. Walker, Physica C 275, 245 (1997).
- [10] A. Schilling, R. A. Fisher, N. E. Phillips, U. Welp, W. K. Kwok, and G. W. Crabtree, Phys. Rev. Lett. 78, 4833 (1997).
- [11] G. Blatter, V. B. Geshkenbein, and A. I. Larkin, Phys. Rev. Lett. 68, 875 (1992).
- [12] M. J. W. Dodgson, V. B. Geshkenbein, H. Nordborg, and G. Blatter, Phys. Rev. Lett. 80, 837 (1998); Phys. Rev. B 57, 14498 (1998).
- [13] C. M. Aegerter, S. T. Johnson, W. J. Nuttall, S. H. Lloyd, M. T. Wylie, M. P. Nutley, R. Cubitt, S. L. Lee, D. McK. Paul, M. Yethiraj, and H. Mook, Phys. Rev. B 57, 14511 (1998).
- [14] M. Roulin, A. Junod, E. Walker, Physica C 296, 137 (1998).
- [15] A. I. Rykov et al. in Advances in Superconductivity VIII (Proc. ISS’95), eds. H. Hayakawa and Y Enomoto (Springer, Tokyo, 1996) p. 341.
- [16] B. D. Rainford, G. J. Daniell, Hyperfine Interactions 87, 1129 (1994).
- [17] E. M. Forgan, D. McK. Paul, H. A. Mook, P. A. Timmins, H. Keller, S. Sutton, J. S. Abell, Nature 343, 735 (1990).
- [18] D. Cribier, B. Jacrot, L. Madhov Rao, B. Farnoux, Phys. Lett. 9, 106 (1964).
- [19] S. T. Johnson, E. M. Forgan, S. H. Lloyd, S. L. Lee, R. Cubitt, P. G. Kealey, C. Ager, S. Tajima, A. Rykov, and D. McK. Paul, Phys. Rev. Lett. 82, 2792 (1999).
- [20] C. Ager, F. Y. Ogrin, S. L. Lee, C. M. Aegerter, S. Romer, H. Keller, I .M. Savić, S. H. Lloyd, S. T. Johnson, E. M. Forgan, T. M. Riseman, P. G. Kealey, S. Tajima, A. Rykov, Phys. Rev. B 62, 3528 (2000).
- [21] D. K. Christen, F. Tasset, S. Spooner, H. A. Mook, Phys. Rev. B 15, 4506 (1977).
- [22] S. Kamal, D. A. Bonn, N. Goldenfeld, P. J. Hirschfeld, R. Liang, W. N. Hardy, Phys. Rev. Lett. 73, 1845 (1994).
- [23] I. Kosztin and A. J. Leggett, Phys. Rev. Lett. 79, 135 (1997).
- [24] M. V. Indenbom, H. Kronmüller, T. W. Li, P. H. Kes, A. A. Menovsky, Physica C 222, 203 (1994); M. V. Indenbom, G. D’Anna, M.-O. André, V. V. Kabanov, W. Benoit Physica C 235-240, 201 (1994).
- [25] H Safar, E. Rodriuez, F. de la Cruz, P. L. Gammel, L. F. Schneemeyer, D. J. Bishop, Phys. Rev. B 46, 14238 (1992).
- [26] H. Nordborg and G. Blatter, Phys. Rev. Lett. 79, 1925 (1997).
- [27] U. Welp, W. K. Kwok, G. W. Crabtree, Phys. Rev. Lett. 76, 4809 (1996).
- [28] S. L. Lee, C. M. Aegerter, H. Keller, M. Willemin, B. Stäuble-Pümpin, E. M. Forgan, S. H. Lloyd, G. Blatter, R. Cubitt, T. W. Li, P. Kes, Phys. Rev. B 55, 5666 (1997).
- [29] E. M. Forgan, M. T. Wylie, S. Lloyd, M. P. Nutley, S. L. Lee, R. Cubitt, C. Aegerter, H. Keller, and T. W. Li, Hyperfine Interact. 105, 61-69 (1997).
- [30] M. Willemin, A. Schilling, H. Keller, C. Rossel, J. Hofer, U. Welp, W. K. Kwok, R. J. Olsson, and G. W. Crabtree Phys. Rev. Lett. 81 4236 (1998).
- [31] A. Houghton, R. A. Pelcovits, A. Sudbø, Phys. Rev. B 40, 6763 (1989).