Avalanche dynamics, surface roughening and self-organized criticality - experiments on a 3 dimensional pile of rice.
Abstract
We present a two-dimensional system which exhibits features of self-organized criticality. The avalanches which occur on the surface of a pile of rice are found to exhibit finite size scaling in their probability distribution. The critical exponents are = 1.21(2) for the avalanche size distribution and = 1.99(2) for the cut-off size. Furthermore the geometry of the avalanches is studied leading to a fractal dimension of the active sites of = 1.58(2). Using a set of scaling relations, we can calculate the roughness exponent = 0.41(3) and the dynamic exponent = 1.56(8). This result is compared with that obtained from a power spectrum analysis of the surface roughness, which yields = 0.42(3) and = 1.5(1) in excellent agreement with those obtained from the scaling relations.
pacs:
DRAFT VERSION: NOT FOR DISTRIBUTIONI Introduction
The concept of self-organized criticality (SOC) [1] presents a simple way of modelling slowly-driven out of equilibrium systems. The interesting natural systems thought to exhibit SOC, such as rain-fall [2], earthquakes [3], economic markets [4], biological evolution [5], or the brain [6], are difficult to study in a controlled experiment, and more simple systems have to be found with which the predictions of SOC can be tested quantitatively. Among the first toy systems studied, were sand-piles, however it has been shown that due to the appearance of e.g. kinetic effects, real sand does not behave as an SOC system [7]. Another system, that has shown indications of SOC in a controlled environment is the dynamics of vortices in type-II superconductors. Here, power-law scaling has been observed in the past [8], however not all authors have found avalanche scaling [9]. This is probably due to the fact that internal avalanches are not measured in the usual setup [10]. Recently Behnia et al. [11] have measured internal avalanches using arrays of Hall-probes, where they do indeed find power-law behavior of the avalanches. The ultimate hall-mark of SOC, however, is the observation of finite size-scaling, indicating a true critical dynamics. So far, there are only two experimental systems, a one dimensional (1d) pile of rice [12] or a 1d pile of steel balls with a random arrangement at its bottom layer [13], which have been shown to exhibit finite size scaling in their avalanche distributions.
The critical exponents obtained from a finite size scaling analysis, would yield more information on a SOC system, as was discussed by Paczuski et al. [14] for models in a stationary critical state. A system evolving through avalanches, which are distributed according to a power-law, will also show roughening dynamics of its surface. This can be seen as an indication to the origin of the abundance of fractal or self-affine structures in nature. Roughening dynamics has been studied extensively in the past, including the study of interfaces in porous media [15], the growth of bacterial colonies [16], the slow combustion [17] or the rupture [18] of paper . These systems are well characterized experimentally and in many cases, the interface dynamics can be modelled analytically by the Kardar-Parisi-Zhang (KPZ) equation [19]. In one spatial dimension, the KPZ equation is solved exactly for the case of white noise, such that good comparison between experiment and theory is possible. However, e.g. in the burning of paper, there are avalanches observed in the propagation of the front, which are reminiscent of SOC dynamics [20]. This has recently been addressed by Alava et al. [21], who proposed a mapping between SOC models and the KPZ equation similar to that of Paczuski and Boettcher [22]. With this mapping, they have been able to obtain SOC from the KPZ equation, with the proper kind of noise [21].
Moreover, roughening processes have also been found in the experimental SOC systems discussed above. The profile of a 1d rice pile is a rough interface [23], as is the front of magnetic flux penetrating a thin film superconducting sample [24]. However, the universal scaling relations derived by Paczuski et al. [14] have not yet been tested experimentally. But the fact that both roughening phenomena and avalanche dynamics can be observed in the same experimental system, such as a 3d rice-pile, means that the universal connections between SOC and surface roughening can be tested experimentally.
Here we present a two-dimensional (2d) system, the surface of a 3d pile of rice, showing both roughening behavior and avalanche dynamics. The avalanche dynamics is studied in terms of the avalanche size distribution for different sizes of the field of view, . This allows the observation of finite size scaling and the determination of the critical exponents , describing the dependence of the cutoff scale on , and , the exponent of the avalanche size distribution. The roughening behavior is studied via the power spectrum of the surface [25], in both space and time, resulting in a determination of the roughness and growth exponents respectively [26]. The connection between these two phenomena is shown from the derivation of scaling relations between the different exponents, where we obtain excellent agreement using the experimentally determined values.
The experimental setup for the growth of the rice-pile, as well as the reconstruction method used to determine the structure of the pile and the size of the avalanches is discussed in section II. The avalanche size distributions, and their finite size scaling is presented in section IIIA, together with the determination of the critical exponents. In section IIIB, the surface roughness is analyzed and the necessary techniques are briefly introduced. Still in section IIIB, the scaling relations between the roughness exponents and the critical exponents are introduced. These results are also put into a wider context and compared with results from KPZ roughening systems [27].
II Experimental Details
The experiments were carried out on long grained rice with dimensions of typically 2x2x7 mm3, similar to rice A of ref. [12]. The pile was grown from a uniform line source 1 m wide. This uniform distribution was achieved via a custom built mechanical distributor based on a nail-board producing a binary distribution [28]. The actual setup consists of a board with an arrangement of triangles as shown in Fig. 1. This means that the possible pathways of the rice are continuously split at each level, such that at the bottom we end up with a row of 64 uniformly distributed compartments. The uniformity of the distribution was measured to be of the order of 5.
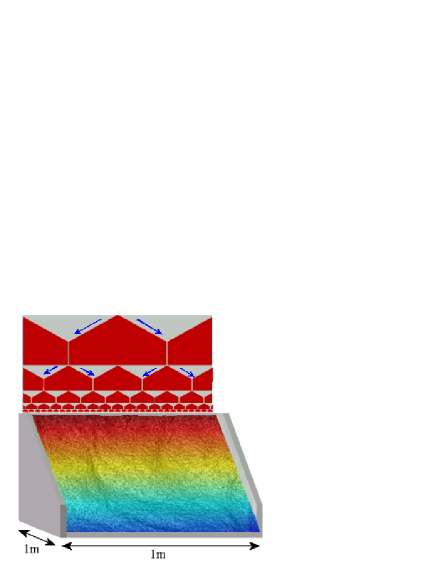
At the bottom of the distributor, the grains are slowed down by a sheet of plastic before they hit the top of the pile. The rice is fed to the top of the distribution board, from a point source, which drops rice at an average rate of 5g/s. This corresponds to 1500 grains per image, which means that over the length of the line there are 1 to 2 grains dropped per place. This rate is uniform over the time scale between two images.
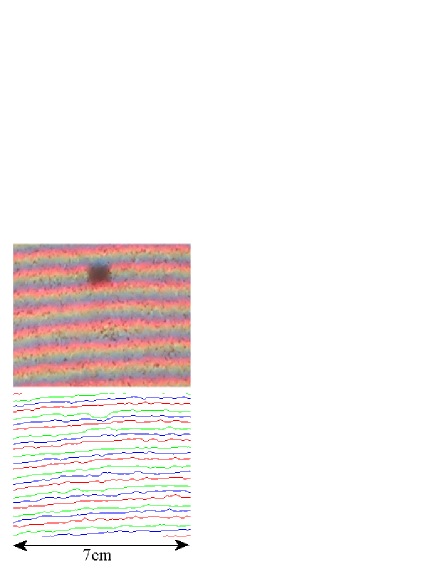
Once a rice pile is grown, we measure the further evolution of the surface coordinates using a specially developed real-time technique based on the projection of a set of lines. In order to increase the spatial resolution in the direction of growth, we use a set of lines in the base colors (red, green and blue), which can be easily separated digitally for the analysis. The lines are projected at a right angle to the average surface of the pile and observed at 45∘ to both the direction of projection as well as the surface. This is illustrated in Fig. 2, where a raw image is shown together with the lines extracted from it. From the distortions of the lines observed in this way, the coordinates in 3d space of the pile surface can be calculated by simple geometry [28]. With this reconstruction technique, the 3d coordinates of the whole field of view can be determined with an accuracy of 2-3 mm, as we have checked on a number of test surfaces. Using both structured and smooth surfaces, the resolution and accuracy were determined independently. Since the resolution is roughly matched with the size of the grains, the method is well suited for the present purpose.
In a single experimental run, the growth is studied for a period of 4 hours, with a picture taken every 30 s. Thus an experiment consists of 480 images. The pictures are taken with a high resolution digital camera, having a resolution of 2048x1536 pixels. For every time step, the surface structure is reconstructed, which gives information about the roughening process, as well as the avalanche dynamics.
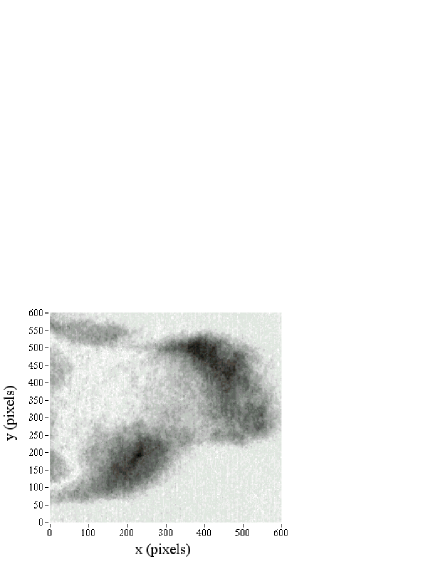
The size and shape of the avalanches can be determined from the height difference of the surface between two consecutive images. The overall growth of the pile is subtracted from this difference, however this correction is negligible and does not influence the results. This is shown in Fig.3, where the height difference is shown for a medium size avalanche. This allows the study of internal avalanches instead of just the off-edge ones, which has proven to be important in previous studies (for instance on superconducting vortex avalanches [11] and 1d piles of rice [12]). In order to obtain the size of such an avalanche, is integrated over the area, which yields the displaced volume, , corresponding to the size of the avalanche in mm3. In order to use natural units, we will in the following measure the size of the avalanche in terms of the number of toppled grains, which is , where 35 mm3 is the volume of a single grain of rice.
The data discussed in this article was obtained in three separate experiments, with a total of 1330 images.
III Results
In this section the experimental results are presented. We first show that there is finite size scaling in the avalanche statistics, which indicates the appearance of a critical state in the system. Second, we characterize the surface roughness of the rice pile in 2d, both in space and time. The two characteristic exponents, for the spatial behavior, and for the dynamics [26] can also be obtained from scaling relations of the critical exponents of the avalanche statistics and are in excellent agreement with those determined from a standard power-spectrum analysis.
A Avalanche Dynamics
The time dependence of the displaced volume, , in each time step is shown in Fig. 4, for all three experiments discussed here. In the figure, the data are shown for avalanche sizes integrated over the total field of view of 600x600 mm2.

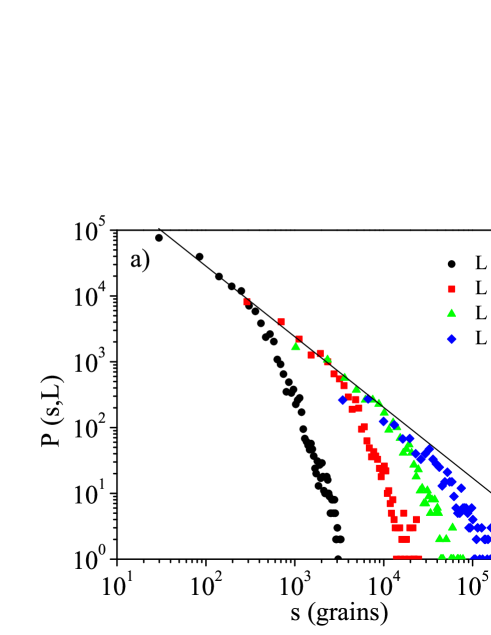
A histogram of these data, giving the avalanche size distribution is shown by the diamonds in Fig. 5a). In that figure, size distributions of subsets of the data corresponding to smaller fields of view (L = 50, 150 and 300 mm) are also shown. Due to experimental resolution, the smallest avalanches measured for each subset depend on the size of that subset. The range of sizes from 50x50 mm2 to 600x600 mm2 spans more than a decade and all of the data taken together show a power-law scaling of the size distribution over three decades, with an exponent of = 1.20(5).
These data can however be scaled to fall onto a single curve, as shown in Fig 5b). Here the avalanche sizes are scaled with and the probabilities are scaled with . The good curve collapse visible in Fig 5b) indicates the presence of finite size scaling in the data, one of the hall-marks of critical behavior in a system and thus evidence of the appearance of SOC in the 3d rice pile.
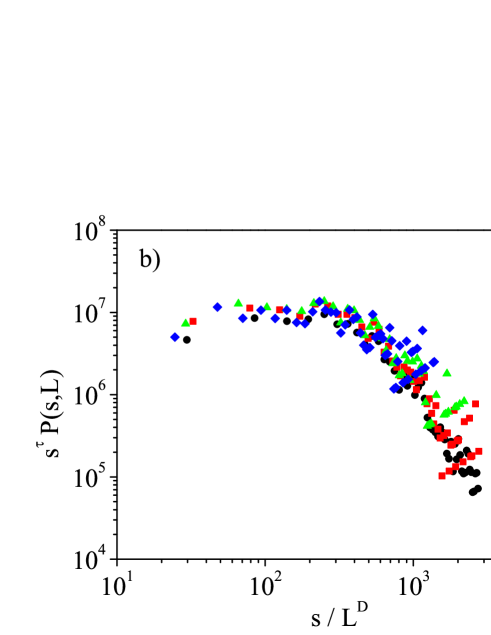
Due to the finite size scaling found from the curve collapse, the avalanche size distribution as a function of system size can be written as a function of one parameter only:
| (1) |
where is constant up to a cutoff scale
| (2) |
The exponents and used to obtain the curve collapse in Fig. 5b) were = 1.21(2) and = 1.99(2). We note here that in usual finite size scaling, separate experiments are used instead of subsets. However, as we have tested on simulations of a 2d version of the Oslo-model [29], finite size scaling using subsets yields the same exponents, but is much more easily implemented experimentally. As an additional test, the avalanche dimension can be determined directly using a box-counting method in 3d. This yields = 2.05(10) consistent with the result from finite size scaling.
B Surface Roughening
The roughness of a surface can be characterized in different ways. Most commonly, this is done via the width of the interface as given by its standard deviation [26]. For a 2d surface, this is given by
| (3) |
where is the average profile of the surface height. When the roughness of the surface has reached saturation, its value , will scale with the system size as a power-law, , where is the roughness exponent.
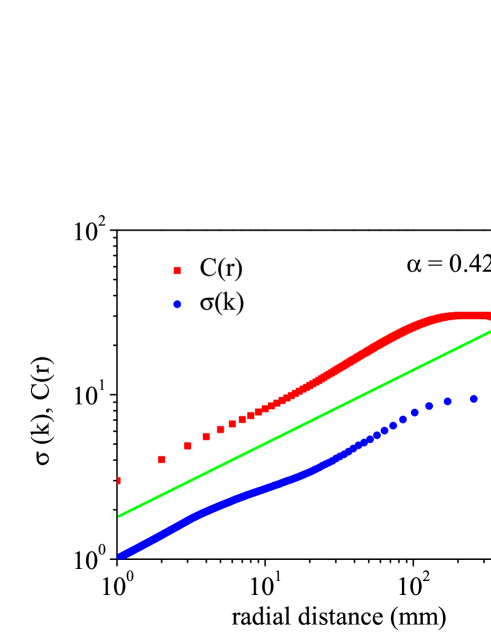
A similar type of analysis can be achieved via the power spectrum of the surface. Here, one has the advantage that better statistics can be obtained, since the whole surface can be used at once [25]. We determined the power spectrum from a radial average of the 2d Fourier transform of the surface
| (4) |
where . The Fourier transforms where performed via an FFT algorithm, which is why a data subset corresponding to a power of two (512x512) was used. From the power spectrum we then determine the distribution function
| (5) |
from which it can be shown [25] that , where is the length scale over which the width is calculated. The roughness exponent can therefore be reliably obtained from a determination of . An alternative way of obtaining the roughness exponent is via the two point correlation function[26].
| (6) |
the radial average of which obeys the same scaling behavior as the distribution function [26].
In Fig. 6, the correlation and distribution functions for the rice-pile surface is shown, averaged over all time steps of all experiments (1330 images). The part of the surface studied consists of 512x512 mm in the center of the surface laterally (along the horizontal direction) and starting from a height of 200 mm. As can be seen from the double logarithmic plot, there is power-law scaling with an exponent, = 0.42(3).
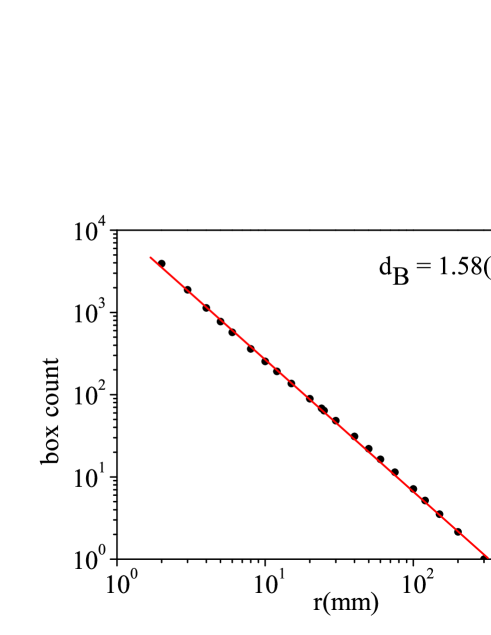
The scaling behavior of the interface width can, however, also be determined from the cut-off size of the avalanches in a system with size . The size of such an avalanche will be proportional to the maximal height difference, given by the saturation width , times the maximal area of the avalanche. As can be seen from Fig. 3, the avalanche-shape is a fractal, which means that , where is the fractal dimension of the cluster of displaced grains. Equating this expression with Eq. 2, one obtains , which implies the scaling relation
| (7) |
Such a scaling relation between the roughness exponent and the exponents characterizing the avalanches was also derived by Paczuski et al. [14] from different arguments.
In order to determine in an accurate manner, we studied avalanches more than two standard deviations bigger than the average size. This corresponds to a subset of 100 images from all experiments. After thresholding the height difference fields at their mean value, we applied a simple box counting method [30] to the resulting clusters. This is shown in Fig. 7, where the number active pixels in a box of given size is shown as a function of the box size. The result is a power law with an exponent of -1.58(2), indicating a fractal dimension of = 1.58(2). Inserting this value into scaling relation (7), the roughness exponent is found to be = 0.41(3), in excellent agreement with that determined from the roughness analysis.
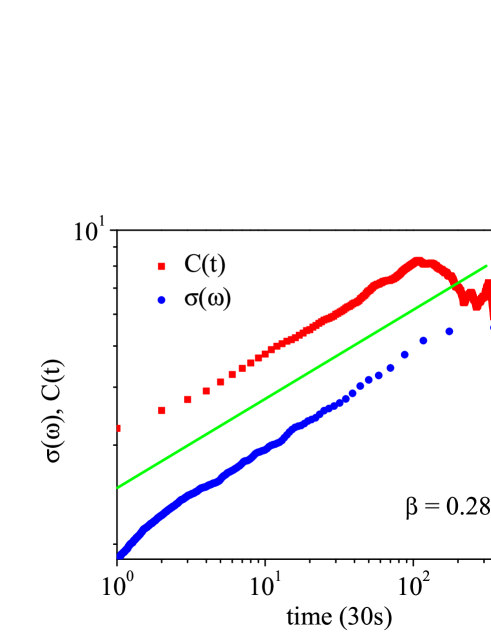
The dynamics of the roughening process is likewise analyzed via the distribution function. In contrast to the roughness analysis above, we now determine the distribution function for the time dependence for each pixel, where denotes the average over the duration of the experiment. Again, the distribution function, given by
| (8) |
is equal to the momentary width, . Thus the growth exponent , describing the scaling of the width with time, can be determined from the distribution function. Again, the correlation function shows the same scaling behavior in time, allowing a separate determination of . Both results are shown in Fig. 8, where it can be seen that there is good power-law scaling of the distribution function, as well as the correlation function, over two decades with an exponent of = 0.28(3). Another way of describing the dynamics of an interface is via the dynamic exponent , which describes the scaling of the saturation time with the system size
| (9) |
It can be easily obtained [26] from the roughness and growth exponents via
| (10) |
From the values determined above we thus obtain = 1.5(1).
The dynamic exponent, , can also be derived from a scaling relation using the critical exponents of the avalanche dynamics. The saturation time, , will be roughly given by the time it takes for an avalanche of the cut-off size, , to appear. Since material is added to the system at a constant rate, the number of grains added until a cut-off avalanche occurs is proportional to the cross-over time . On the other hand, the material added not only result in an avalanche of size , but will also be lost by smaller avalanches, such that the total material necessary to obtain an avalanche of size can be estimated from:
| (11) |
From Eq. 2, we obtain for the cross-over time . With Eq. 9, this immediately leads to the scaling relation
| (12) |
which was also derived by Paczuski et al. [14] from more general arguments. Using the values for and determined above from the curve collapse of the avalanche size distributions, we obtain = 1.56(8), which is again in very good agreement with the result of the power spectrum analysis, = 1.5(1). Note also that the exponents and fulfill the KPZ scaling relation[19] = 2, which is valid independent of the dimension of the system and depends only on the fact that the growth is driven by height gradients. Furthermore, the roughness exponent = 0.42(3) is in good agreement with a numerical determination of the behavior of the 2d KPZ equation [27]. The connection between roughening and SOC will be discussed in more detail below.
IV Conclusions
In conclusion, we have presented results on both the avalanche and the roughening behavior of an experimental SOC system. In addition, we presented simple arguments for universal scaling relations, derived by Paczuski et al. [14] on general grounds, connecting the avalanche and roughening behavior. We obtain quantitative agreement of the experimental exponents characterizing the roughness and those describing the avalanche statistics. This means that the roughening of the surface of the pile is governed by its underlying avalanche dynamics, which was already conjectured from models of interface depinning. Earlier experimental studies [12, 23] have considered the avalanche dynamics and the roughening behavior of the 1d version of the present system, where finite size scaling was also found [12]. The above scaling relations, showing quantitatively the connection between the two phenomena were not previously tested.
The fact that KPZ dynamics is observed in a SOC system, as indicated by the fact that the roughness and dynamic exponents obtained here fulfill the KPZ scaling relation, is surprising. This is mostly because in SOC systems, the critical state is self organized, whereas in KPZ systems, the roughening is put into the dynamics by obeying the proper symmetries. However, it has been argued by Alava et al. [21], that there is a mapping of SOC models, which naturally lead to the necessary symmetries. In this context, it should also be noted that experiments on KPZ systems such as burning paper have also observed ’avalanches’ in the advance of fronts [20].
V Acknowledgements
This work was supported by FOM (Stichting voor Fundamenteel Onderzoek der Materie), which is financially supported by NWO (Nederlandse Organisatie voor Wetenschappelijk Onderzoek).
REFERENCES
- [1] P. Bak, C. Tang, and K. Wiesenfeld, Phys. Rev. Lett. 59, 381 (1987) and Phys. Rev. A 38, 364 (1988).
- [2] O. Peters, C. Hertlein, and K. Christensen, Phys. Rev. Lett. 88, 018701 (2002); O. Peters, and K. Christensen, preprint.
- [3] see e.g. P. Bak, K. Christensen, L. Danon, and T. Scanlon, Phys. Rev. Lett. 88, 178501 (2002); A. Sornette, and D. Sornette, Europhys. Lett. 9, 197 (1989); J. M. Carlson, J. S. Langer, and B. E. Shaw, Rev. Mod. Phys. 66, 657 (1994).
- [4] see e.g. J. A. Scheinmann, and M. Woodford, Am. J. Econ. 84, 417 (1994); P. Bak, K. Chen, J. A. Scheinmann, and M. Woodford, Ricerche Economiche 47, 3 (1993).
- [5] see e.g. J. Bascompte, and R. V. Solé, Trends Ecol. Evol. 10, 361 (1995); H. Flyvbjerg, P. Bak, and K. Sneppen, Phys. Rev. Lett. 71, 4087 (1993); S. A. Kaufmann, and S. J. Johnsen, J. Theor. Biol. 149, 467 (1991).
- [6] D. Stassinopoulos, and P. Bak, Phys. Rev. E 51, 5033 (1995).
- [7] H. M. Jaeger, S. R. Nagel, and R. P. Behringer, Rev. Mod. Phys. 68, 1259 (1996); S. R. Nagel, ibid. 64, 321 (1992) and references therein.
- [8] S. Field, J. Witt, and F. Nori, Phys. Rev. Lett. 74, 1206 (1995); C. M. Aegerter, Phys. Rev. E 58, 1438 (1998).
- [9] see e.g. R. J. Zieve, T. F. Rosenbaum, H. M. Jaeger, G. T. Seidler, G. W. Crabtree, and U. Welp, Phys. Rev. B 53, 11849 (1996); E. R. Nowak, O. W. Taylor, L. Liu, H. M. Jaeger, and T. I. Selinder, Phys. Rev. B 55, 11702 (1997).
- [10] J. Feder, Fractals (Plenum, New York, 1989).
- [11] K. Behnia, C. Capan, D. Mailly, and B. Etienne, Phys. Rev. B 61, R3815 (2000); K. Behnia, C. Capan, D. Mailly, and B. Etienne, J. Mag. Mag. Mat. 226, 370 (2001).
- [12] V. Frette, K. Christensen, A. Malthe-Srenssen, J. Feder, T. Jssang, and P. Meakin, Nature (London) 379, 49 (1996).
- [13] E. Altshuler, O. Ramos, C. Martinez, L. E. Flores, and C. Noda, Phys. Rev. Lett. 86, 5490 (2001).
- [14] M. Paczuski, S. Maslov, and P. Bak, Phys. Rev. E 53, 414 (1996).
- [15] M. A. Rubio, C. A. Edwards, A. Dougherty, and J. P. Gollub, Phys. Rev. Lett. 63, 1685 (1989); V. K. Horváth, F. Family, and T. Vicsek, J. Phys. A 24, L25 (1991); S. He, G. L. M. K. S. Kahanda, and P.-Z. Wong, Phys. Rev. Lett. 69, 3731 (1992).
- [16] E. Ben-Jacob, O. Shochet, A. Tenenbaum, I. Cohen, A. Czirók, and T.Vicsek, Nature(London) 368, 46 (1994); S. Matsuura, and S. Miyazima, Fractals 1, 336 (1993); T. Vicsek, M. Cserzö, and V. K. Horváth, Physica A 167, 315 (1990).
- [17] J. Maunuksela, M. Myllys, O. P. Kähkönen, J. Timonen, N. Provatas, M. J. Alava, and T. Ala-Nissila, Phys. Rev. Lett. 79, 1515 (1997).
- [18] J. Kertész, V. K. Horváth, and F. Weber, Fractals 1, 67 (1993).
- [19] M. Kardar, G. Parisi, and Y.-C. Zhang, Phys. Rev. Lett. 56, 889 (1986).
- [20] A. Myllys, J. Maunuksela, A. Alava, T. Ala-Nissila, J. Merikoski, and J. Timonen, Phys. Rev. E 64, 036101 (2001); and J. Timonen, private communication.
- [21] M. Alava, and K. B. Lauritsen, Europhys. Lett. 53, 569 (2001); G. Szabo, M. Alava, and J. Kertesz, Europhys. Lett. 57, 665 (2002); M. Alava, J. Phys. C 14(9), 2353 (2002).
- [22] M. Paczuski, and S. Boettcher, Phys. Rev. Lett. 77, 111 (1996).
- [23] A. Malthe-Srenssen, J. Feder, K. Christensen, V. Frette, and T. Jssang, Phys. Rev. Lett. 83, 764 (1999).
- [24] R. Surdeanu, R. J. Wijngaarden, E. Visser, J. M. Huijbregtse, J. H. Rector, B. Dam, and R. Griessen, Phys. Rev. Lett. 83, 2054 (1999).
- [25] J. Schmittbuhl, J.-P. Vilotte, and S. Roux, Phys. Rev. E 51, 131 (1995); M. Siegert ibid. 53, 3209 (1996); J. M. Lopez, M. A. Rodriguez, and R. Cuerno, ibid. 56, 3993 (1997).
- [26] A. L. Barabasi and H. E. Stanley Fractal Concepts in Surface Growth (Cambridge University Press, 1995).
- [27] J. G. Amar, and F. Family, Phys. Rev. A 41, 3399 (1990).
- [28] R. Günther, Masters Thesis, Vrije Universiteit (2002).
- [29] C. M. Aegerter, Physica A 319, 1 (2003).
- [30] B. B. Mandelbrot, The fractal geometry of nature (Freeman, New York, 1983).