Present address: ]Solid State Physics, Uppsala University, Box 534, SE-751 21 Uppsala, Sweden
Optical properties of MgH2 measured in situ in a novel gas cell for ellipsometry/spectrophotometry
Abstract
The dielectric properties of -MgH2 are investigated in the photon energy range between 1 and 6.5 eV. For this purpose, a novel sample configuration and experimental setup are developed that allow both optical transmission and ellipsometric measurements of a transparent thin film in equilibrium with hydrogen. We show that -MgH2 is a transparent, colour neutral insulator with a band gap of eV. It has an intrinsic transparency of about 80% over the whole visible spectrum. The dielectric function found in this work confirms very recent band structure calculations using the GW approximation by Alford and Chou.Alford and Chou As Pd is used as a cap layer we report also the optical properties of PdHx thin films.
pacs:
77.22.Ch,77.55.+f,78.20.Bh,78.66.NkI Introduction
Among metal-hydridesKohlmann (2002) the magnesium hydrogen system has always occupied a special place. Magnesium reacts reversibly with hydrogen to form MgH2. It is thus considered to be one of the most important candidates for the reversible storage of hydrogenSchlapbach and Züttel (2001) due to its lightweight, low cost and high hydrogen storage capacity (7.6 wt.% of hydrogen). In spite of the large number of publications on Mg-MgH2 only little is known about the intrinsic physical properties of this system. The scarcity of data for MgHx is mainly due to the experimental difficulties encountered when trying to hydride Mg.Selvam et al. (1986) Nowadays, a great effort is made to improve the hydrogen ab/desorption kinetics by making nanocrystalline MgZaluska et al. (1999) and/or adding e.g. transition metalsLiang et al. (1999); Dehouche et al. (2000); Pelletier et al. (2001) by ball milling.
Recent theoretical calculationsVajeeston et al. (2002) reproduce that MgH2 undergoes various phase transitions Bastide et al. (1980); Bortz et al. (1999) as a function of pressure. All theoretical calculations published so farVajeeston et al. (2002); Yu and Lam (1988); Pfrommer et al. (1994); Häussermann et al. (2002) (using either the local density approximation (LDA) or the generalized gradient approximation (GGA)) predict band gaps between 3.1 and 4.2 eV for -MgH2. This is smaller than the few sporadic experimental values reported until now. KraskoKrasko (1982) mentions a value of 5.16 eV for the band gap from unpublished work by Genossar. He and PongHe and Pong (1990) determined in an indirect way using Penn’s formulaPenn (1962) an average band gap of 5.8 eV. Yamamoto et al.Yamamoto et al. (2002) report an optical transmission spectrum for a thin film in which the transmission vanishes at 6.05 eV (205 nm). Apart from that Ellinger et al.Ellinger et al. (1955) found an index of refraction of 1.95 and 1.96 for the ordinary and extraordinary rays at 589.3 nm. The dielectric properties have not been studied at all. This triggered our interest to study the optical properties of MgH2 in detail.
Another strong reason for our interest in MgH2 stems from metal-hydride switchable mirrors. In 1996 Hui-berts et al.Huiberts et al. (1996) discovered that Y and La thin films change reversibly from shiny, metallic films to transparent, insulating films upon hydrogenation either by changing the surrounding hydrogen gas pressure or the electrolytic cell potential.Notten et al. (1996); Kooij et al. (1999) In 1997 Van der Sluis et al.van der Sluis et al. (1997) discovered that all rare-earth (RE) metals exhibit such a switchable behaviour. However, all these materials have a characteristic colour in the fully hydrogenated state because their band gap is in the visible ( eV). They showed that alloying with Mg results in colour neutral switchable mirrors. This is very important for applications in e.g. ‘smart’ windows. In 2001 Richardson et al.Richardson et al. (2001) reported that MgzNi () also features reversible switching behaviour upon hydrogenation. In all these cases (RE-Mg and MgzNi), the band gap is shifted to higher energies with increasing magnesium concentration.van der Sluis et al. (1997); Richardson et al. (2001); Isidorsson et al. (2001a); van der Molen et al. (2001); Isidorsson et al. (2001b) All these alloys disproportionate upon hydrogenation.Isidorsson et al. (2001a); Nagengast et al. (1999); Di Vece et al. (2002, 2003) This disproportionation is also known for bulk RE-Mg.Darriet et al. (1980); Sun et al. (2002) The available data suggest that the shift of the band gap to higher energies is due to the formation of MgH2 which is expected to have a large band gap. At the same time the reflectance in the low hydrogen phase (when the sample is unloaded) increases due to Mg which has a high reflection.van der Sluis et al. (1997); Giebels et al. (2002) At intermediate concentrations the coexistence of Mg and MgH2 seems to play an important role in the realization of a highly absorbing, black state that is observed during loading and unloading of RE-Mg alloys.Griessen (1997); Giebels et al. It may also play a role in the black state observed in MgzNiHx.Isidorsson et al. (2002) Thus, to understand the role of MgH2 in Mg-containing switchable mirrors it is essential to determine the optical properties of MgH2 thin films.
In this paper we study thin films of magnesium hydride with spectrophotometry and ellipsometry and determine the dielectric function and the optical band gap. For this purpose we use a special substrate geometry and a novel type of optical gas loading cell.
II Experimental
MgH2 thin films are made in two steps. First Pd capped metallic Mg films are deposited under UHV conditions on an appropriate substrate. The Pd cap layer is necessary to protect Mg against oxidation and to promote hydrogen dissociation and absorption. The films are subsequently loaded with hydrogen under high pressure up to the composition MgH2.
The hydrogenation of Mg to MgH2 is, however, not straightforward as was shown by Krozer, Kasemo and others.Krozer and Kasemo (1987, 1989); Rydén et al. (1989); Krozer and Kasemo (1990); Spatz et al. (1993) Palladium capped Mg films exhibit unusual kinetics due to the formation of a blocking MgH2 layer at the interface between Pd and Mg. The MgH2 layer prevents H to diffuseLuz et al. (1980) to the metallic Mg that is still present underneath. The formation of this blocking layer can be circumvented by starting hydrogenation at relatively low (1 mbar) H2 pressure at a temperature of 100∘C. Magnesium films with thicknesses up to 150 nm can be fully transformed to MgH2 in this way.Rydén et al. (1989); Westerwaal et al.
II.1 Film deposition
Thin, polycrystalline films of Mg and Pd are deposited at room temperature in an UHV MBE system with a background pressure of 10-9 mbar, using material of typically 99.9 % purity. The magnesium films are evaporated from a Knudsen cell and covered with a 10 nm thick Pd cap layer. These palladium films are deposited from an e-beam evaporation unit. Typically, we deposit films simultaneously on a 10x10 mm2 glassy carbon substrate for Rutherford backscattering spectrometry (RBS), 10x10 mm2 quartz substrates for X-ray diffraction (XRD), resistivity and/or AFM measurements, and on a quartz substrate (Ø 42 mm, Heraeus Suprasil 1) for optical measurements.
II.2 Film characterization
RBS is used to determine eventual contamination of the films. For this glassy carbon substrates are used in order to separate the Mg signal from the background signal of the substrate. An oxygen contamination between has been found.
The thickness of the film is measured with a DekTac3 or a Tencor Alpha step 200 mechanical stylus profilometer. The surface structure, both before and after hydrogen loading, is investigated with a NanoScope III atomic force microscope (AFM), operating in tapping mode using silicon cantilevers. The scanned areas are typically 1x1 and 5x5 m2 from which the root-mean-square (RMS) roughness is determined. The thickness and roughness values from these techniques are used as input parameters in the modeling of the transmission, reflection and ellipsometric data (see Sec. III).
Some samples are contacted ultrasonically with four 30 m aluminium wires to monitor the resistivity with the Van der Pauw methodvan der Pauw (1958) during loading with hydrogen.
X-ray experiments are carried out with Cu K radiation in a Rigaku ‘Rotaflex’ RU 200 or Bruker D8 Discover X-ray diffractometer to monitor the transformation of hcp Mg to rutile MgH2 in a -2 mode.
II.3 Optical techniques
Optical reflection and transmission measurements at room temperature (RT) are carried out in a Perkin Elmer Lambda 900 spectrophotometer in the range eV ( nm). The specular and total transmission is recorded while the spectrophotometer is purged with argon or nitrogen in order to reduce absorption by O2 in the ultraviolet (UV), and H2O in the infrared (IR). The quartz substrates (without film) and Pd samples are measured in reflection geometry from the top side (i.e. the metallic side) at near normal incidence (8∘) in an absolute reflection unit (using a so-called VN geometry).
Ellipsometry measurements (at RT) in the energy range 1.0 to 6.5 eV ( nm) are carried out in a rotating analyzer variable-angle spectroscopic ellipsometer (VASE, J.A. Woollam Co. Inc.), using the WVASE32 software program for data acquisition and analysis. This instrument measures the ratio of the complex Fresnel reflection coefficients of parallel () and perpendicular () polarized light.Azzam and Bashara (1977) This ratio defines the ellipsometric angles and according to
| (1) |
Three angles of incidence (60, 65 and 70∘) are used to obtain adequate sensitivity over the whole spectral range. Standard deviation and ellipsometric data () are recorded at each data point as an average of at least 100 revolutions, and up to 4000 revolutions of the analyzer for the most critical data.
II.4 Semi-cylindrical substrate
As the Pd cap layer on top of the very transparent MgH2 layer is strongly absorbing, ellipsometry cannot be carried out from the Pd-side. Thus, ellipsometry measurements need to be performed from the ‘backside’, through the substrate. Flat substrates would need to be so thick that reflections from the front and backside of the substrate can be well separated. With a 2 mm diameter of the light beam the substrate must be thicker than 3 mm. However, at large angles of incidence the intensity loss in the light beam is substantial due to reflections at the air/substrate interface. Furthermore, at energies close to the limit of the ellipsometer (6-6.5 eV), the intensity of the light beam is diminishing quickly. These limitations can be avoided with a semi-cylindrical substrate.
This substrate is designed for normal incidence of light at the ambient/substrate interface and oblique incidence at the internal substrate/MgH2 interface (see Fig. 1).
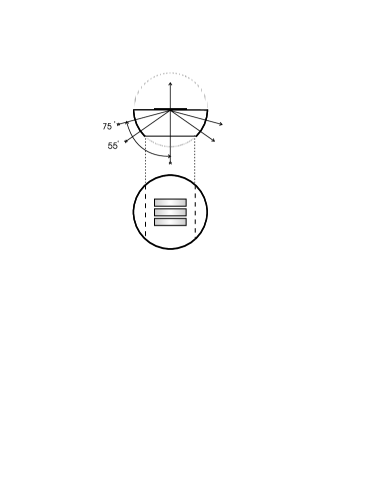
For the normal incident approximation to be valid, the diameter of the semi-cylindrical substrate must be large compared to the size of the light beam (2 mm). For practical reasons we choose a semi-cylindrical substrate with a diameter of 42 mm. The top part of the semi-cylindrical substrate is cut away parallel to the base surface to enable transmission measurements. This design allows the angle of the incident light onto the sample to vary between 55∘ and 75∘ from the normal. Both the flat and the semi-cylindrical substrates are made of quartz glass (Heraeus Suprasil 1). This material is transparent deep into the UV beyond the limit of our ellipsometer and spectrophotometer.
On the top of the large flat face we deposit, under exactly the same condition, three films with different Mg thicknesses (see Fig. 1). This allows us to analyze compositionally identical films. This method makes the determination of the dielectric function from ellipsometric data more reliable.McGahan et al. (1993); Järrendahl and Arwin (1998)
II.5 Optical gas loading cell and high pressure loading chamber
In order to measure the optical properties of MgH2 and PdHx in situ in equilibrium with hydrogen at various pressures, we designed an experimental setup consisting of three parts: i) a substrate/window (see Fig. 1), ii) an optical gas loading cell, and iii) a high pressure loading chamber. Components ii) and iii) are described below in more detail. The setup also includes a special substrate holder with a sliding mask for the deposition of the films, and a holder to attach the optical gas loading cell to the ellipsometer.
A semi-cylindrical or a flat substrate with the Pd-capped MgH2 films deposited on top functions as window in the optical gas loading cell (see Fig. 2).
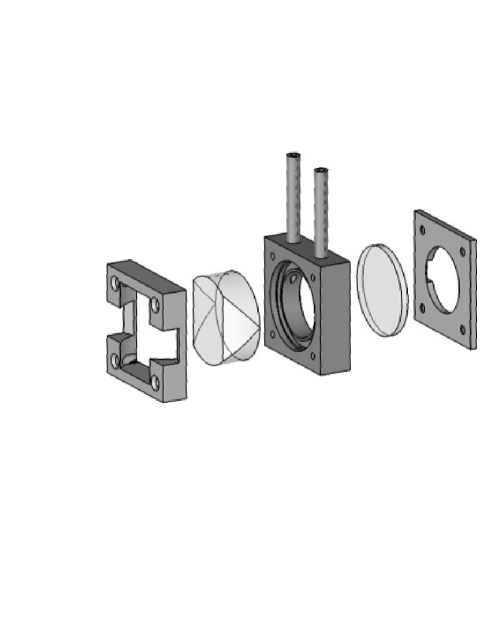
For ellipsometry the sample/window is illuminated through the substrate to measure the ‘backside’ of the film. For in situ transmission measurements a window is mounted on the opposite side of the cell as well. The sample can be exposed to a controlled hydrogen gas atmosphere during the measurements via two tubes connected to a vacuum pump and hydrogen gas cylinder. The cell is designed for vacuum, but works also reliably up to a few bar hydrogen pressure.
As already mentioned in the introduction of Sec. II, hydrogenation of Mg to MgH2 can be successfully achieved at moderate temperatures (C) by starting at low hydrogen pressure.Rydén et al. (1989); Westerwaal et al. Therefore, to be sure that our thin films of Mg are completely transformed to MgH2 we start loading with a H2 pressure of 1 mbar and increase it in steps (within a few hours) up to 100 bar H2. To do this the optical gas loading cell is mounted inside a high pressure loading chamber (see Fig. 3).
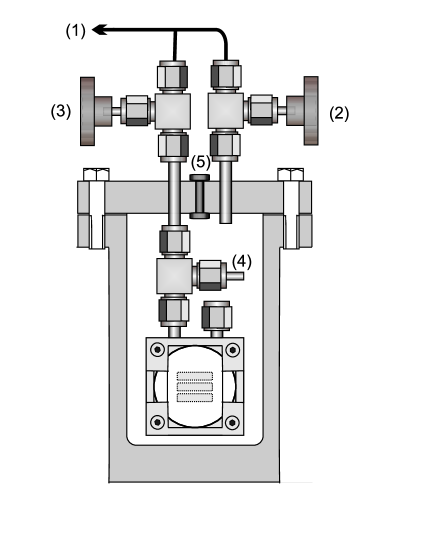
This chamber is made of stainless steel and proof-pressurized to 200 bar. The design is such that the pressure in the high pressure chamber is everywhere the same, and it is not necessary to expose the sample to the ambient after loading at 100 bar H2. It is possible to release hydrogen and close the optical gas loading cell with valve (3) when a pressure of 1 bar hydrogen or less is reached. With valve (2) closed as well, the system is disconnected from the gas tubes (1) (while still filled with H2). Afterwards, valve (2) is opened to equalize the pressure outside and inside the high pressure chamber. Then, the chamber is opened, and the valve on top of the optical gas cell (number (4)) is closed. The cell can then be disconnected from the lid of the high pressure loading chamber while still filled with hydrogen. The high pressure loading chamber is also equipped with an electrical feed-through (5) with several wires to permit measurements of the resistivity of a sample during hydrogenation and of the temperature inside the chamber with a RhFe100 sensor. During hydrogen loading of a Mg film the total chamber can be resistively heated up to 100∘C.
III Results
III.1 Sample characterization
Since Mg is a metal and MgH2 an insulator, the time evolution of hydrogenation can be followed in situ in real time by monitoring the change of the resisitivity.Hjort et al. (1996) This allows us to optimize the hydrogen pressure (starting at low pressures and increasing it stepwise to 100 bar H2) in such a way that no impenetrable MgH2 layer is formed at the interface between Pd and Mg. For practical reasons we have mounted an extra sample in the high pressure loading chamber for resistivity measurements.
The resistivity of this as-deposited 150 nm Mg film covered with 15 nm of Pd at RT is 6.5 cm (the literature value for bulk Mg at 20∘C is 4.4 cmLide (2001)). The reflection of this as-deposited film is high in the visible and near-infrared regions (80%). Both the low resistivity and the high reflection indicate the good quality of the film. After loading the resistivity reaches 680 cm under 100 bar H2 at 100∘C. Since MgH2 is an insulator one would at first sight expect a much higher value. The moderate resistivity found experimentally is, however, due to the metallic Pd cap layer that shortcuts the MgH2 layer. Moreover, at a temperature of 100∘C Mg and Pd may interdiffuse to form a Mg-Pd alloy.Krozer and Kasemo (1990); Fischer et al. (1991) This intermixing has been suggested for Pd capped Y as well,van der Molen et al. (1999) and was conclusively shown with photoelectron spectroscopy recently.Borgschulte et al. (2001) RBS showed an intermixing of Mg and Pd in our films as well. This can be due to either alloying, interface roughening or both. The net result is that a relatively Pd-rich Pd-Mg alloy is formed on top of MgH2 that absorbs some hydrogen but does not become insulating and this causes the shortcut.
In the as-deposited metallic state, hcp Mg has a preferential growth direction, and only the (002) reflection is present in the X-ray diffractogram (see Fig. 4(a)). Loading a thin Mg film in 1 bar H2 at 100∘C does not transform Mg completely to MgH2 (see Fig. 4(b)).
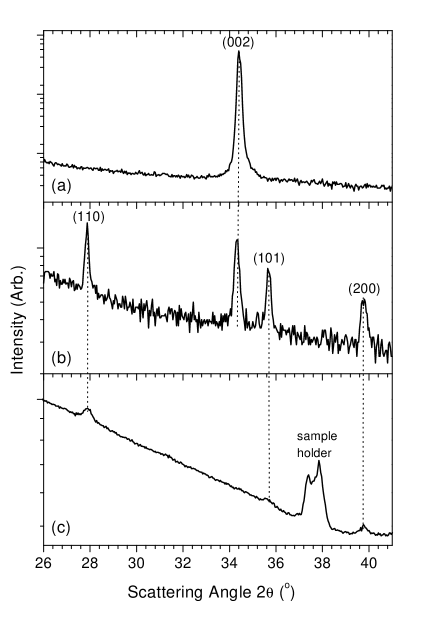
Loading at 100 bar and 100∘C, on the other hand, left no traces of metallic Mg. Only the peaks corresponding to the tetragonal structure of the rutile typeEllinger et al. (1955) of -MgH2 are observed (see Fig. 4(c)). Such a preferred growth direction is not observed for MgH2 where weak signals from the (110), (101) and (200) peaks can be seen. Rocking curves around the (002) Mg peak and the (110) MgH2 peaks show that our samples are polycrystalline.
AFM measurements revealed a significant difference between the as-deposited Pd covered Mg film and the fully hydrogenated films (see Fig. 5).
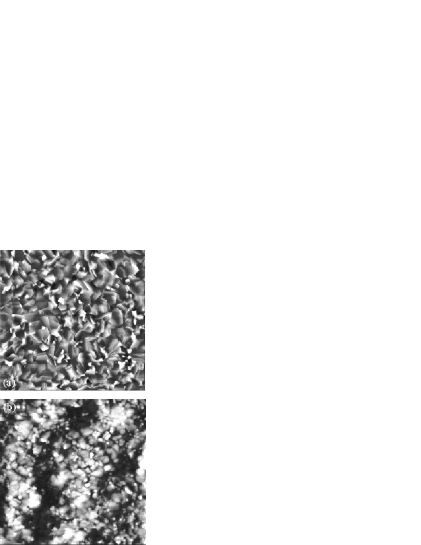
Mg expands by 32% in volume when transforming from hcp Mg to rutile MgH2.Schober (1981) Since the film is clamped by the substrate it cannot expand laterally and all the expansion must take place out-of-plane. With AFM we indeed noted an increase in the RMS roughness from 5 nm to 14 nm. It can be seen as well that our top layer of Pd is cracked. With a mechanical stylus profilometer we found a corresponding increase of the thickness of the film from 113 to 162 nm. This 43% increase is larger than the expected 32% volume expansion because the mechanical stylus has a tip radius of 12.5 m, and hence cannot probe the deep valleys seen on the AFM image. During ellipsometry we look through the substrate at the backside of our films and not from the top side as with AFM. Nevertheless, we found that surface roughening of our Pd top layer needed to be taken into account when modeling the ellipsometric data.
III.2 Transmission and band gap of MgH2
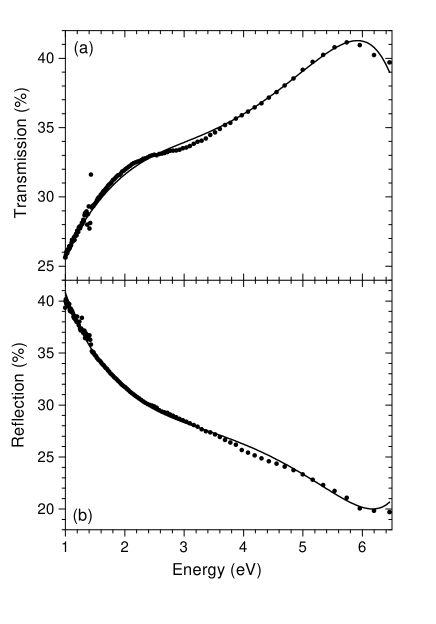
The optical transmission of Pd capped MgH2 films is measured in situ in 1 bar H2 using the gas loading cell (see Fig. 2). Figure 6 shows the total, specular and diffuse transmission of a 150 nm thick MgH2 film capped with 12 nm Pd, loaded at 100 bar H2 and 100∘C.
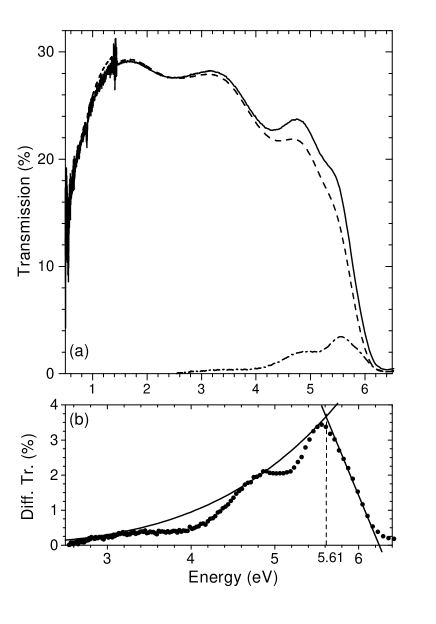
The total transmission is measured with the optical gas loading cell placed at the entrance port of the integrating sphere in the spectrophotometer. In this experiment a flat 3 mm thick quartz glass substrate is used. Since we look at our film from the substrate side, the MgH2 layer is situated 3 mm away from the port of the integrating sphere. The specular transmission is measured with the sample in the sample compartment, using the direct detector to monitor the signal. The difference between these two signals is the diffuse (scattered) transmission. It is probably due to the rough surface (see Sec. III.1 and Fig. 5(b)) of our loaded samples. This diffuse transmission, , has a strong wavelength dependence and is proportional to
| (2) |
where is the wavelength of light.Lord Rayleigh (1871) It is clear from Fig. 6(b) that the diffuse transmission decreases strongly above the band gap as the film starts to absorb light. The optical band gap , can be estimated from the intersection of a fitted curve to the data and an extrapolation of the flank of the absorption edge. Using this so called ‘Rayleigh method’ we find eV for this sample and eV for a second sample.
Another estimate for can be obtained from the absorption edge of the transmission spectra using the Lambert-Beer law, , where is the absorption coefficient, the film thickness and contains the transmission of the Pd cap layer and the quartz substrate. In the region of the absorption edge can be considered as constant in our films (see Figs. 7 and 10). The frequency dependence of near the band edge is related to the optical gap through,Tauc et al. (1966); Johnson (1967)
| (3) |
For direct, allowed (forbidden) transitions () and for indirect, allowed (forbidden) transition (). In amorphous material it has been found that gives the best results. Combining these equations gives
| (4) |
and the constants , , and are determined from a fit to the spectra near the transmission edge in the interference-free region.
Applied to the total transmission this ’Tauc procedure’ gives a gap of eV using . It was also possible to get a Tauc fit with and . However, using gives values that are too low compared to the ‘Rayleigh procedure’ and we might be fitting an interference fringe instead of the absorption edge. For the quality of the fit is not as good and we obtain a gap of eV from the total transmission.
Since the diffuse transmission increases rapidly at small wavelengths (i.e. with increasing energy), it is clearer where the absorption starts in this spectrum than in the total transmission. Therefore, we conclude that the band gap of MgH2 is eV.
III.3 Ellipsometry
III.3.1 Modeling strategy
Extracting the dielectric function of a layer from ellipsometric data on samples like ours, which consists of several thin layers on a substrate, is a complex task. The complicated inversion of the ellipsometric data to the dielectric function is, however, greatly simplified if the optical properties of each individual layer is measured in separate experiments. For this reason we adopted the following strategy to determine the dielectric function of MgH2.
We start by investigating the dielectric properties of the quartz substrate. The second step is to evaluate the optical properties of the hydrogenated Pd cap layer. This is done by investigating a 12 nm thick film of Pd on quartz, hydrogenate it in 1 bar H2 using the optical gas loading cell and measure it in the ellipsometer. In a third step we study the properties of the hydrogenated interface region between Pd and MgH2 carefully since earlier experiments with Mg-Pd thin films showed that interdiffusion starts already at 100∘C.Krozer and Kasemo (1990); Fischer et al. (1991) This is done by investigating a ‘Pd-Mg’ alloy layer consisting of 10 nm Mg on a quartz substrate covered with 10 nm Pd. This sample is loaded with hydrogen at 100∘C and 100 bar and measured in the ellipsometer. The final step is to measure the total stack (quartz, MgH2, Pd-Mg) and to extract the optical properties of MgH2 using the optical properties of all the other layers.
An optical model is defined for each sample and in the fitting procedure the difference between the calculated (cal) and the measured (exp) ()-values (see Sec. II.3) are weighted with the experimental standard deviation and fitted with a Levenberg-Marquardt algorithm to minimize the mean squared error (MSE) according toJr. Jellison (1991); Press et al. (1988)
| (5) |
where is the number of ()-pairs, is the number of fitting parameters, and the indices and denote data points at different wavelengths and angles. In most cases also normal incidence transmission data, , are used to improve the accuracy of the determination of the dielectric function.Johs et al. (1994) Then, a third term is included in the summation in Eq. 5.
In the modeling we take into account experimental errors in incident angle and angular spread due to the substrate design, and film thickness non-uniformity. It is difficult to model both the thickness and the dielectric properties simultaneously in ellipsometry.McGahan et al. (1993); Järrendahl and Arwin (1998) Thus, we allow the layer thicknesses to vary only slightly around our measured thickness values during fitting. The output from the modeling consists of the best-fit value of the Lorentz-Drude parameters (see Eq. 6) and their 90% confidence intervals.
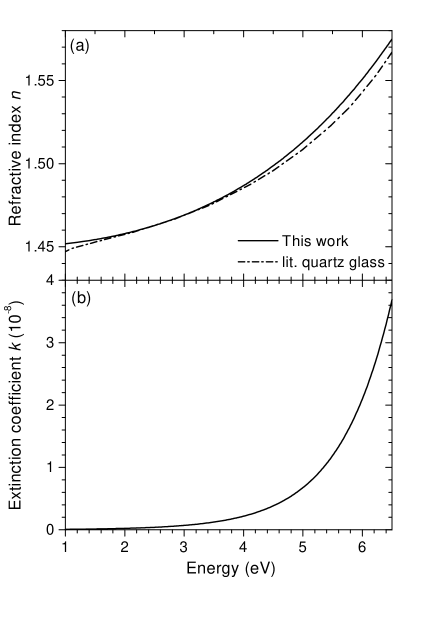
III.3.2 Optical constants of the glass substrate
The optical constants of the quartz substrates (both flat and semi-cylindrical) and the quartz window used in the optical gas loading cell (see Fig. 2) are determined using optical reflection and transmission measurements and ellipsometry. This is straightforward, and our results match the tabulated values of the refractive index from the manufacturer as well as those of quartz glass cited in Ref. Palik, 1998 (see Fig. 7(a)). The extinction coefficients being not tabulated in Ref. Palik, 1998 are assumed to be zero. Our results on the extinction coefficient show a slight absorption near and above 6.5 eV, but still below (see Fig. 7(b)). The corresponding dielectric function is used in the consecutive modeling of the metal hydride layers.
III.3.3 Optical properties of PdHx
A 12 nm thick Pd film, deposited on quartz is exposed to 1 bar hydrogen at RT in the optical gas loading cell and investigated in the ellipsometer (see Fig. 8 for the experimental and fitted data).
The Pd hydride, PdHx, that is formed is a strongly absorbing metal. Its dielectric function can be adequately parameterized with a Lorentz-Drude (LD) model:
| (6) |
where the constant accounts for excitations far above 6.5 eV; the Drude terms describe the free-carrier response with the plasma frequency of the -th Drude term and the relaxation time; the Lorentz terms represent the effect of interband transitions with the intensity of the -th oscillator, its energy, and its broadening. The relation between the dielectric function and the refractive index, and extinction coefficient, , is: and . The LD parameters obtained for PdHx in 1 bar H2 are given in Table 1.
| () | () | |||||
|---|---|---|---|---|---|---|
| (1) | 3.389 0.901 | 0.1892 0.019 | ||||
| (2) | 8.656 2.02 | 1.775 0.147 | ||||
| (1) | 3.418 0.124 | 8.588 4.6 | 5.195 0.691 | |||
| (2) | 6.878 0.119 | 11.32 4.63 | 7.713 0.519 | |||
| (3) | 9.669 | 11.96 | 0.5601 |
In addition to the sample for ellipsometry, an identical sample on a flat substrate is prepared for measurements in the spectrophotometer. The transmission and absolute reflection are determined for this sample in 40 mbar hydrogen (4% H2 in Ar). At higher pressures it is not possible to use the optical gas loading cell when we determine the absolute reflection since we must look directly at the Pd sample and not via the substrate. To obtain a hydrogenated Pd sample, the whole spectrophotometer is purged in Ar containing 4% H2, corresponding to a partial pressure of 40 mbar H2. This is the highest H2 concentration we can use in the (open) spectrophotometer.
In Fig. 9 the experimental and fitted data are displayed, the LD parameters obtained for PdHx in 40 mbar H2 are given in Table 2.
| () | () | |||||
|---|---|---|---|---|---|---|
| (1) | 5.156 0.955 | 0.001 0.0241 | ||||
| (2) | 8.382 2.65 | 2.238 0.323 | ||||
| (1) | 4.131 0.111 | 9.815 4.17 | 7.104 0.581 | |||
| (2) | 7.623 0.249 | 7.793 4.14 | 0.927 0.235 |
The difference in the MSE (see Table 1 and 2) between the 1 bar and 40 mbar measurements is mainly due to the different substrate geometry, semi-cylindrical vs. flat substrate. We assign the major part of the difference in the MSE to the cylindrical incident and exit surface of the semi-cylindrical substrate and to the fact that the ellipsomety measurements have been performed from the ‘backside’ of the sample through the substrate. Note that this does not change the dielectric function, it merely gives a larger spread in the input data for the analysis.
In Fig. 10 we show the resulting dielectric function at 1 bar, and 40 mbar H2 partial hydrogen pressure, and compare it to literature data for PdHx by Rottkay et al.von Rottkay et al. (1999) and literature data for Pd from Ref. Palik, 1998.
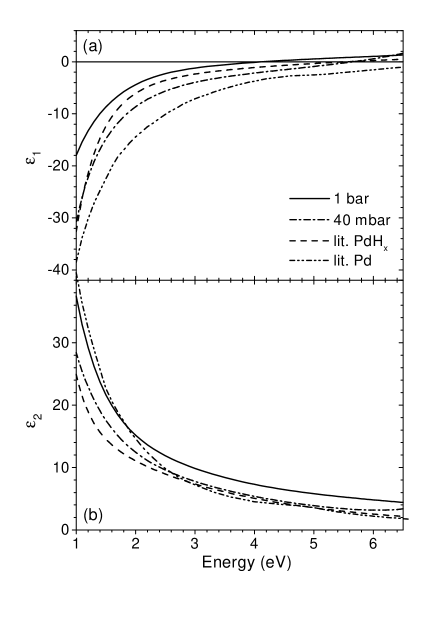
The plasma frequency, , of PdHx in 1 bar H2 is slightly larger than the one in 40 mbar H2. Because with the charge carrier density, there are more free charge carriers in PdHx in 1 bar than in 40 mbar H2. Values for the (optical) resistivity can be derived from the Drude parameters using
| (7) |
with the vacuum permittivity, the plasma frequency and the electron relaxation time. This optical resistivity calculated for the dominant Drude term no. 2 shows the same trend as the plasma frequency itself: In 40 mbar H2 PdHx has a resistivity of 235 cm, in 1 bar 178 cm. However, bulk Pd has a resistivity of 10.53 cm and PdHx has a maximum resisitivity of about 20 cm when at RT.Geerken and Griessen (1983) Our much larger resistivities are probably due to the fact that the 12 nm thick Pd film consists of somewhat disconnected islands. Hydrogen absorption causes the Pd islands to expand which decreases the resistivity between them.Favier et al. (2001); Dankert and Pundt (2002). Thus, we have a sort of percolation effect and the resistivity is lower in 1 bar H2 than in 40 mbar H2 contrary to bulk PdHx.
III.3.4 Optical constants of the double layer Pd/Mg
To investigate the optical properties of the partially interdiffused Pd-Mg top layer, we deposit a layer of 10 nm Mg capped with 10 nm Pd on quartz. This Pd-Mg film is then exposed to hydrogen at 100∘C and 100 bar (together with the thick Mg film covered by Pd (see Fig. 1)). After hydrogenation the optical properties are determined in the optical gas loading cell at RT. This sample is treated as consisting of two layers: a Mg-rich Pd-Mg alloy on the substrate covered with a Pd-rich Pd-Mg alloy on top. As starting values for the fitting procedure we use the PdHx dielectric function determined above for the Pd-rich Pd-Mg top layer, and combine it with voids in a Bruggeman effective medium approximation (EMA) to take surface roughness into account.Aspnes et al. (1979) A Lorentz-Drude model is used for the second layer, the Mg-rich Pd-Mg alloy. Ellipsometric data for three angles of incidence (55, 60 and 65∘) and normal incidence transmisson data are then combined in a multiple data type fit. All data are measured on the same sample and during fitting the layer optical functions and thicknesses are coupled. The final iteration results in a fit with a MSE of 8.7. The optical properties of this double layer are then used as starting values for the top layer of the thicker MgH2 film.
III.3.5 Dielectric function of MgH2
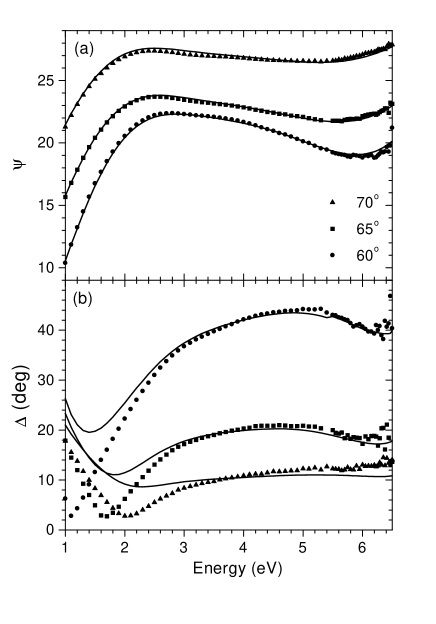
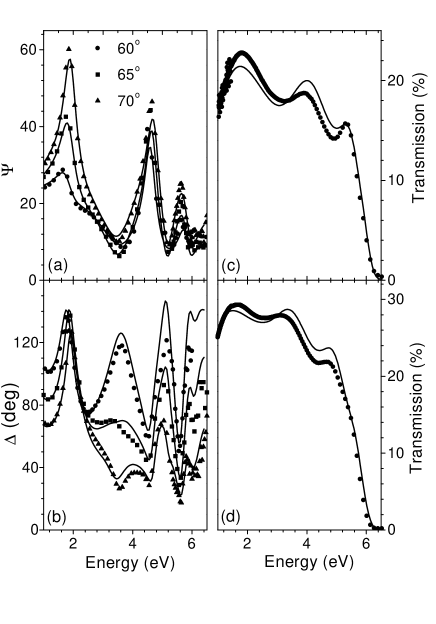
In the evaluation of the optical properties of MgH2 we analyze ellipsometric and transmission data of a 124 nm thick MgH2 film capped with 12 nm PdHx (as measured with a mechanical stylus profilometer in the hydrogenated state). In addition to these data, transmission data of a compositionally identical film, but with a thickness of 162 nm (when hydrogenated) are included in the modeling. These three data sets are evaluated in three parallel, coupled models simultaneously. The main features can be modeled using two Lorentz oscillators at the high energy side of the measured spectra, at 6.4 and 6.9 eV. These oscillators mark the beginning of the conduction band.
The optical parameters of the capping layer, consisting of the Pd-rich Pd-Mg alloy on top of the Mg-rich Pd-Mg alloy, are initially fixed to the parameter values obtained in Section III.3.4. The only parameters of the top layers which are allowed to vary are the thicknesses since the diffusion of Pd into MgH2 may be larger than the 10 nm in the thin Pd/Mg double layer. In the final iteration a global fit is used in which all LD parameters are allowed to change. The final MSE is 17.17. Table 3 gives the LD parameter values from the final iteration for MgH2, the Pd-rich Pd-Mg cap layer and the Mg-rich Pd-Mg cap layer.
| MgH2 film, nm | ||||||
| () | () | |||||
| (1) | 6.4 | 5.516 | 0.6454 | |||
| (2) | 6.9 | 7.689 0.519 | 0.01223 0.109 | |||
| Top cap layer: Pd-rich Pd-Mg alloy (with 53% voids), nm | ||||||
| () | () | |||||
| (1) | 14.35 0.062 | 1.055 30.6 | ||||
| (1) | 2.964 0.122 | 5.208 0.559 | 1.702 9.03 | |||
| (2) | 8.5 | 17.408 12.2 | 0.01366 4.96 | |||
| Lower cap layer: Mg-rich Pd-Mg alloy, nm | ||||||
| () | () | |||||
| (1) | 6.672 0.865 | 0.003629 8.29 | ||||
| (1) | 3.293 0.0824 | 24.61 0.420 | 14.09 7.06 | |||
The plasma frequencies obtained for the two top layers give us a clue about their composition. Since the plasma frequency of the top layer ( eV) is much larger than the one of the lower cap layer ( eV), the top layer has a larger charge carrier density and is thus more metallic than the lower one. This indicates that the top layer is formed by a metallic Pd-Mg alloy. The lower layer contains some insulating MgH2 as well. The optical resisitivity (see Eq. 7) of the top layer is 38 cm compared to an electrical resistivity of 63 cm (at RT) for the total stack as measured after loading. Thus, the top layer is indeed shunting the resisitivity measurements of MgH2. Since PdHx has an optical resistivity of 178 cm it is clear that the top layer contains some metallic Mg as well which has a much lower resistivity (6.5 cm).
The total thickness of the stack obtained from ellipsometry is 130.6 nm after hydrogenation. With the stylus profilometer we found a thickness of 136 nm. However, as mentioned before the profilometer gives a value that is too large. Before hydrogenation the thickness was 95 nm. This would mean an increase of 37.5% instead of the theoretical 32% volume expansion.
In Fig. 11(a),(b) the experimental and fitted values of and are given, in (c),(d) the experimental and fitted transmission curves are shown.
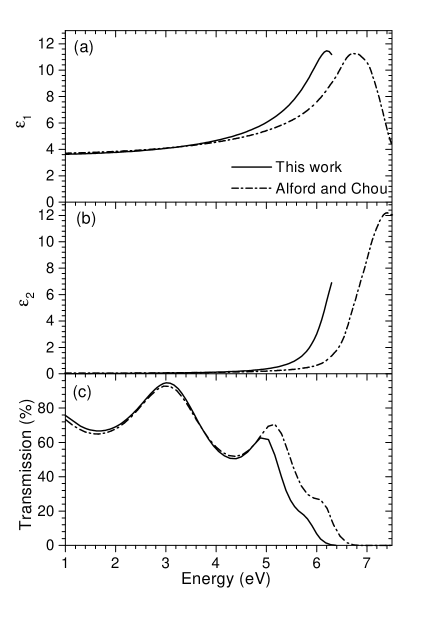
Finally, Fig. 12(a),(b) shows the real and imaginary part of obtained for -MgH2.
IV Discussion
In Table 4 both experimental and theoretical values for the band gap of MgH2 are given. Hartree-Fock (HF) calculations are not included since this method overestimates the band gap considerably. Very recent and not yet published theoretical work by HerzigHerzig , AuluckAuluck and Alford and ChouAlford and Chou on MgH2 is included.
| Material | Method | (eV) | Ref. | |
|---|---|---|---|---|
| -MgH2 | expt. | UV-absorption | 5.16 | Krasko,1982 |
| XPS | 5.8 | He and Pong,1990 | ||
| EELS | 3.7111If there are no charging effects, the band gap would be twice the indicated value. | Sprunger and Plummer,1991 | ||
| XPS | 3.4111If there are no charging effects, the band gap would be twice the indicated value. | Krozer et al.,1996 | ||
| Transmission | 6.05222This is the photon energy where the transmission vanishes. | Yamamoto et al.,2002 | ||
| Ellipsometry/ | 5.6 0.1 | this work | ||
| Transmission | ||||
| calc. | LDA | 3.06 | Yu and Lam,1988 | |
| LDA | 3.4 | Pfrommer et al.,1994 | ||
| LDA | 3.45 (4.34) | Herzig, | ||
| LDA | 3.3 | Auluck, | ||
| LDA | 3.10 | Alford and Chou, | ||
| GGA | 3.78 | Häussermann et al.,2002 | ||
| GGA | 4.2 | Vajeeston et al.,2002 | ||
| sX-LDA | 5.71 (6.41) | Herzig, | ||
| GWA | 5.25 (6.11) | Alford and Chou, | ||
| -MgH2 | calc. | GGA | 4.3 | Vajeeston et al.,2002 |
| -MgH2 | calc. | APW | 0.23 | Gupta,1993 |
| GGA | 2.35 | Vajeeston, |
The band gap of eV determined in this work for -MgH2 is close to values mentioned sporadically in literature. The value 5.16 eV was obtained in an UV-absorption study mentioned by Krasko.Krasko (1982) However, details about how this value was obtained have never been published. The value found by He and PongHe and Pong (1990) for the average band gap is close to ours. This is rather surprising since was obtained in an indirect way from X-ray photoelectron spectroscopy (XPS) data using Penn’s formula.Penn (1962) Yamamoto et al.Yamamoto et al. (2002) measured the specular optical transmission of thin layers of MgH2 covered by Pd and found that the transmission is zero at 6.05 eV. However, they did not apply Tauc’s method (see Sec. III.2) to the transmission edge in order to obtain an estimate for the band gap. Furthermore, one should keep in mind that 6.02 eV is at the detection limit of their Shimadzu spectrophotometer.
As can be seen in Table 4 LDA calculations give a band gap that is systematically too low. This is a well-known feature of this approximation. Similarly, the GGA used in two other papersVajeeston et al. (2002); Häussermann et al. (2002) to calculate the density of states of MgH2, underestimates the band gap. Our band gap is closest to the theoretically calculated gaps of HerzigHerzig using screened-exchange-LDA (sX-LDA) and Alford and ChouAlford and Chou using the GW approximation (GWA). Furthermore, it is interesting to point out that our experimentally found gap eV is very close to the difference in ionization energy between Mg and H: 5.952 eV.
Back in 1955 Ellinger et al.Ellinger et al. (1955) determined the refractive index of -MgH2 at 589.3 nm (2.107 eV) and found n = 1.95 and 1.96 for the ordinary and extraordinary rays, respectively. We find n = 1.94 and k = 7.6 at the same energy which is very close.
Both AuluckAuluck using LDA and Alford and ChouAlford and Chou using LDA and GWA have calculated the band structure and dielectric function for -MgH2. To obtain the dielectric function only direct transitions are taken into account. The only difference between the LDA and GWA curves is the energy position. The dielectric function obtained for -MgH2 with GWA agrees quite well with our measured values (see Fig. 12 (a),(b)), while the LDA curve, as expected, is shifted to too low energies. This indicates that a scissors-operation that shifts the conduction band rigidly with respect to the valence band works well to correct LDA calculations.Gygi and Baldereschi (1989); Del Sole and Girlanda (1993) The energy at which both and exhibit a marked increase is, however, slightly different for the experiment and the GWA calculation. sX-LDA seems to overestimate the band gap since it gives even larger values for the (in)direct gap than GWA.
Figure 12(c) shows the optical transmission for a 100 nm thick MgH2 film in vacuum as calculated with our experimental dielectric function and the one calculated by Alford and Chou. As can be seen MgH2 has an intrinsic transparency of about 80% over the entire visible spectrum. The difference in energy between the absorption edges of the two transmission spectra and the dielectric functions is about 0.5 eV. Thus, GWA overestimates the optical gap by 0.5 eV. The direct gap determined from the band structure using GWA is 6.11 eV. Subtracting 0.5 eV from 6.11 eV gives a value of 5.61 eV which is within the error margin of our experimentally found gap. More information about the dielectric function and band structure of MgH2 by Alford and Chou will be published elsewhere.
Yet unpublished calculations indicate that the optical properties of both - and -MgH2 are close to each other.Alford and Chou ; Auluck Vajeeston et al.Vajeeston et al. (2002) find a gap of 4.2 and 4.3 eV for - and -MgH2, respectively with GGA; Bastide et al.Bastide et al. (1980) and Bortz et al.Bortz et al. (1999) have found that the structures of the two different phases are closely related and that the density is almost the same as well as the H-H distances. Therefore, our dielectric function for -MgH2 is probably a very good approximation for -MgH2 as well. This is important to model the optical properties of switchable mirrors since in fully hydrogenated Y-Mg alloys Nagengast et al. found that fcc YH3 coexists with -MgH2.Nagengast et al. (1999) -MgH2 seems to be very different both structurallyBastide et al. (1980) and optically. Its density is much larger and the calculated band gap for this material turns out to be considerably smaller than that of both - and -MgH2 (see Table 4). The augmented plane wave (APW) calculations underestimate the band gap considerably, the GGA value of 2.35 eV (again by VajeestonVajeeston ) is much more reliable. The difference between the calculated band gap using GGA and the one measured for -MgH2 is 1.4 eV. Assuming that the same scissors-operation can be applied we expect an experimental gap of 5.7 eV for -MgH2 and 3.75 eV for -MgH2.
We now compare MgH2 to related materials such as MgF2, MgO, MgS, MgSe, and other alkaline-earth and alkali hydrides. In Table 5 the band gaps of these materials are listed.
| Material | Method | (eV) | Ref. | |
|---|---|---|---|---|
| MgF2 | expt. | Reflectance | 12.4 | Thomas et al.,1973 |
| calc. | tight-binding, | |||
| pseudopotentials | 12.8 | Jouanin et al.,1976 | ||
| MgO | expt. | Reflectance | 7.77 | Roessler and Walker,1967 |
| calc. | LDA | 5 | Schönberger and Aryasetiawan,1995 | |
| GWA | 7.8 | Shirley,1998; Schönberger and Aryasetiawan,1995 | ||
| MgS | calc. | LDA | 2.6 | de Boer and de Groot,1998a |
| LDA (corrected) | 4.59 | Ching et al.,1995 | ||
| MgSe | expt. | 5.6 | Strehlow and Cook,1973 | |
| MgTe | expt. | 4.7, 3.6 | Strehlow and Cook,1973 | |
| CaH2 | expt. | XPS | 5111Charging effects are taking into account in the experiments. | Franzen et al.,1977 |
| SRPES | 5111Charging effects are taking into account in the experiments. | Weaver et al.,1984 | ||
| calc. | LDA | 3.32 | Xiao et al.,1994 | |
| SrH2 | expt. | XPS | 5111Charging effects are taking into account in the experiments. | Franzen et al.,1977 |
| BaH2 | expt. | XPS | 5111Charging effects are taking into account in the experiments. | Franzen et al.,1977 |
| XPS | 2.2222If there are no charging effects, the band gap would be twice as large. | Krozer et al.,1996 | ||
| LiH | expt. | 4.99 | Baroni et al.,1985 | |
| calc. | GWA | 5.24 | Baroni et al.,1985 | |
| LiD | expt. | 5.04 | Shirley,1998 | |
| calc. | LDA | 2.84 | Shirley,1998 | |
| GWA | 5.37 | Shirley,1998 |
For all of them it turns out that LDA underestimates the measured gap. Again, as for MgH2, the GW approximation seems to give a very good agreement between experiment and calculation for MgO, LiH and LiD. The same is true for the alkali halides.Shirley (1998) MgH2 and CaH2 seem to be very similar. Both materials are wide band gap insulators and have a valence band that is predominantly determined by hydrogen orbitals.Yu and Lam (1988); Pfrommer et al. (1994); Xiao et al. (1994) For MgO and MgS both valence and conduction bands are determined by the anions (O or S)de Boer and de Groot (1998a) as well and again the same holds for the alkali halides.de Boer and de Groot (1998b)
Since both the valence and conduction band of MgH2 are formed by H states, the band gap of the alkaline-earth hydrides is expected to be almost independent of the metal as is the case for the alkali halides.de Boer and de Groot (1998b); Brown et al. (1970) The remaining dependence results from the influence of the metal-ion on the lattice parameter, and the influence of hybridization of the conduction band states with metal-ion - and -states. From XPS experiments by Franzen et al.Franzen et al. (1977) it seems that the onset of transitions in the valence band regions start for CaH2, SrH2 and BaH2 all at about 2.5 eV. Since charging effects are taking into account, this gives a gap of about 5 eV quite close to what we have found for -MgH2. It is striking that LiH and LiD also have a gap of 5.0 eV.
V Conclusions
In this study we use a novel experimental setup for optical transmission and ellipsometry measurements. This setup facilitates greatly measurements of the optical properties and dielectric function of metal hydrides in a hydrogen environment. It is possible to control the gas pressure from 1 mbar to 100 bar, and thus the composition of metal hydrides over a wide range. The temperature, pressure and resistivity are monitored in situ during hydrogenation of a sample. We determine the dielectric properties of -MgH2 and PdHx and find that MgH2 is a transparent, colour neutral insulator with a band gap of eV. The transparency over the whole visible spectrum is 80% (for a 100 nm thick film). The experimentally determined dielectric function in the photon energy range between 1 and 6.5 eV of -MgH2 is in very good agreement with very recent calculations using the GW approximation. If we assume that calculations of the band gap for - and -MgH2 underestimate the experimental gap by the same amount as in -MgH2 we expect an experimental gap of 5.7 eV for -MgH2 and 3.75 eV for -MgH2.
In a coming publication we shall show that the dielectric function of MgH2 determined here can be used to explain the large optical absorption (the so-called ‘black state’) of Mg-based alloys where metallic Mg and insulating MgH2 nanodomains coexist.
Acknowledgements.
The authors would like to thank N.J. Koeman, J.H. Rector and W. Lohstroh for their valuable help with the deposition and characterization of the samples. L. Jansen is gratefully acknowledged for constructing the optical gas loading cell and high pressure loading chamber. We are also very grateful to J.A. Alford, M.Y. Chou, P. Herzig, S. Auluck and P. Vajeeston for making available to us the results of their band structure calculations before publication. This work is part of the research program of the Stichting voor Fundamenteel Onderzoek der Materie (FOM), financially supported by the Nederlandse Organisatie voor Wetenschappelijk Onderzoek (NWO).References
- (1) J. A. Alford and M. Y. Chou, (unpublished).
- Kohlmann (2002) H. Kohlmann (Academic Press, New York, 2002), vol. 9 of Encyclopedia of physical sciences and technology, chap. Metal Hydrides, 3rd ed.
- Schlapbach and Züttel (2001) L. Schlapbach and A. Züttel, Nature 414, 353 (2001).
- Selvam et al. (1986) P. Selvam, B. Viswanathan, C. S. Swamy, and V. Srinivasan, Int. J. Hydrogen Energy 11, 169 (1986).
- Zaluska et al. (1999) A. Zaluska, L. Zaluski, and J. O. Ström-Olsen, J. Alloys Compd. 288, 217 (1999).
- Liang et al. (1999) G. Liang, J. Huot, S. Boily, A. Van Neste, and R. Schulz, J. Alloys Compd. 292, 247 (1999).
- Dehouche et al. (2000) Z. Dehouche, R. Djaozandry, J. Huot, S. Boily, J. Goyette, T. K. Bose, and R. Schulz, J. Alloys Compd. 305, 264 (2000).
- Pelletier et al. (2001) J. F. Pelletier, J. Huot, M. Sutton, R. Schulz, A. R. Sandy, L. B. Lurio, and S. G. J. Mochrie, Phys. Rev. B 63, 052103 (2001).
- Vajeeston et al. (2002) P. Vajeeston, P. Ravindran, A. Kjekshus, and H. Fjellvåg, Phys. Rev. Lett. 89, 175506 (2002).
- Bastide et al. (1980) J. P. Bastide, B. Bonnetot, J. M. Létoffé, and P. Claudy, Mat. Res. Bull. 15, 1215 (1980).
- Bortz et al. (1999) M. Bortz, B. Bertheville, G. Böttger, and K. Yvon, J. Alloys Compd. 287, L4 (1999).
- Yu and Lam (1988) R. Yu and P. K. Lam, Phys. Rev. B 37, 8730 (1988).
- Pfrommer et al. (1994) B. Pfrommer, C. Elsässer, and M. Fähnle, Phys. Rev. B 50, 5089 (1994).
- Häussermann et al. (2002) U. Häussermann, H. Blomqvist, and D. Noréus, Inorg. Chem. 41, 3684 (2002).
- Krasko (1982) G. Krasko, Metal-Hydrogen Systems (Pergamon, New York, 1982), p. 367.
- He and Pong (1990) Z. X. He and W. Pong, Physica Scripta 41, 930 (1990).
- Penn (1962) D. R. Penn, Phys. Rev. 128, 2093 (1962).
- Yamamoto et al. (2002) K. Yamamoto, K. Higuchi, H. Kajioka, H. Sumida, S. Orimo, and H. Fujii, J. Alloys Compd. 330-332, 352 (2002).
- Ellinger et al. (1955) F. H. Ellinger, J. C. E. Holley, B. B. McInteer, D. Pavone, R. M. Potter, E. Staritzky, and W. H. Zachariasen, J. Am. Chem. Soc. 77, 2647 (1955).
- Huiberts et al. (1996) J. N. Huiberts, R. Griessen, J. H. Rector, R. J. Wijngaarden, J. P. Dekker, D. G. de Groot, and N. J. Koeman, Nature 380, 231 (1996).
- Notten et al. (1996) P. H. L. Notten, M. Kremers, and R. Griessen, J. Electrochem. Soc. 143, 3348 (1996).
- Kooij et al. (1999) E. S. Kooij, A. T. M. van Gogh, and R. Griessen, J. Electrochem. Soc. 146, 2990 (1999).
- van der Sluis et al. (1997) P. van der Sluis, M. Ouwerkerk, and P. A. Duine, Appl. Phys. Lett. 70, 3356 (1997).
- Richardson et al. (2001) T. J. Richardson, J. L. Slack, R. D. Armitage, R. Kostecki, B. Farangis, and M. D. Rubin, Appl. Phys. Lett. 78, 3047 (2001).
- Isidorsson et al. (2001a) J. Isidorsson, I. A. M. E. Giebels, E. S. Kooij, N. J. Koeman, J. H. Rector, A. T. M. van Gogh, and R. Griessen, Electrochim. Acta 46, 2179 (2001a).
- van der Molen et al. (2001) S. J. van der Molen, D. G. Nagengast, A. T. M. van Gogh, J. Kalkman, E. S. Kooij, J. H. Rector, and R. Griessen, Phys. Rev. B 63, 235116 (2001).
- Isidorsson et al. (2001b) J. Isidorsson, I. A. M. E. Giebels, M. Di Vece, and R. Griessen, SPIE Proc. 4458, 128 (2001b).
- Nagengast et al. (1999) D. G. Nagengast, A. T. M. van Gogh, E. S. Kooij, B. Dam, and R. Griessen, Appl. Phys. Lett. 75, 2050 (1999).
- Di Vece et al. (2002) M. Di Vece, S. J. M. Zevenhuizen, and J. J. Kelly, Appl. Phys. Lett. 81, 1213 (2002).
- Di Vece et al. (2003) M. Di Vece, A. M. J. van der Eerden, J. A. van Bokhoven, S. Lemaux, J. J. Kelly, and D. C. Koningsberger, Phys. Rev. B 67, 035430 (2003).
- Darriet et al. (1980) B. Darriet, M. Pezat, A. Hbika, and P. Hagenmuller, Int. J. Hydrogen Energy 5, 173 (1980).
- Sun et al. (2002) D. Sun, F. Gingl, Y. Nakamura, H. Enoki, M. Bououdina, and E. Akiba, J. Alloys Compd. 333, 103 (2002).
- Giebels et al. (2002) I. A. M. E. Giebels, J. Isidorsson, E. S. Kooij, A. Remhof, N. J. Koeman, J. H. Rector, A. T. M. van Gogh, and R. Griessen, J. Alloys Compd. 330-332, 875 (2002).
- Griessen (1997) R. Griessen, Phys. Bl. 53, 1207 (1997).
- (35) I. A. M. E. Giebels, J. Isidorsson, and R. Griessen, (unpublished).
- Isidorsson et al. (2002) J. Isidorsson, I. A. M. E. Giebels, R. Griessen, and M. Di Vece, Appl. Phys. Lett. 80, 2305 (2002).
- Krozer and Kasemo (1987) A. Krozer and B. Kasemo, J. Vac. Sci. Technol. A 5, 1003 (1987).
- Krozer and Kasemo (1989) A. Krozer and B. Kasemo, J. Phys.: Condens. Matter 1, 1533 (1989).
- Rydén et al. (1989) J. Rydén, B. Hjörvarsson, T. Ericsson, E. Karlsson, A. Krozer, and B. Kasemo, J. Less-Common Met. 152, 295 (1989).
- Krozer and Kasemo (1990) A. Krozer and B. Kasemo, J. Less-Common Met. 160, 323 (1990).
- Spatz et al. (1993) P. Spatz, H. A. Aebischer, A. Krozer, and L. Schlapbach, Z. Phys. Chem. 181, 393 (1993).
- Luz et al. (1980) Z. Luz, J. Genossar, and P. S. Rudman, J. Less-Common Met. 73, 113 (1980).
- (43) R. J. Westerwaal, I. A. M. E. Giebels, N. J. Koeman, and R. Griessen, (unpublished).
- van der Pauw (1958) L. J. van der Pauw, Philips Res. Rep. 13, 1 (1958).
- Azzam and Bashara (1977) R. M. A. Azzam and N. M. Bashara, Ellipsometry and polarized light (North-Holland, Amsterdam, 1977).
- McGahan et al. (1993) W. A. McGahan, B. Johs, and J. A. Woollam, Thin Solid Films 234, 443 (1993).
- Järrendahl and Arwin (1998) K. Järrendahl and H. Arwin, Thin Solid Films 313-314, 114 (1998).
- Hjort et al. (1996) P. Hjort, A. Krozer, and B. Kasemo, J. Alloys Compd. 234, L11 (1996).
- Lide (2001) D. R. Lide, ed., Handbook of Chemistry and Physics (CRC Press, Cleveland, 2001), 82nd ed.
- Fischer et al. (1991) A. Fischer, H. Köstler, and L. Schlapbach, J. Less-Common Met. 172-174, 808 (1991).
- van der Molen et al. (1999) S. J. van der Molen, J. W. J. Kerssemakers, J. H. Rector, N. J. Koeman, B. Dam, and R. Griessen, J. Appl. Phys. 86, 6107 (1999).
- Borgschulte et al. (2001) A. Borgschulte, M. Rode, A. Jacob, and J. Schoenes, J. Appl. Phys. 90, 1147 (2001).
- Schober (1981) T. Schober, Met. Trans. A 12A, 951 (1981).
- Lord Rayleigh (1871) Lord Rayleigh, Phil. Mag. XLI, 274 (1871).
- Tauc et al. (1966) J. Tauc, R. Grigorovici, and A. Vancu, Phys. Stat. Sol. 15, 627 (1966).
- Johnson (1967) E. J. Johnson, Absorption near the fundamental edge (Academic Press, New York, 1967), vol. 3 Optical properties of III–V compounds of Semiconductors and semimetals, chap. 6.
- Jr. Jellison (1991) G. E. Jr. Jellison, Appl. Opt. 30, 3354 (1991).
- Press et al. (1988) W. H. Press, B. P. Flannery, S. A. Teukosky, and W. T. Vetterling, Numerical recipes: the art of scientific computing (Cambridge University Press, Cambridge MA, 1988).
- Johs et al. (1994) B. D. Johs, W. A. McGahan, and J. A. Woollam, Thin Solid Films 253, 25 (1994).
- Palik (1998) E. D. Palik, ed., Handbook of optical constants of solids (Academic Press, San Diego, 1998).
- von Rottkay et al. (1999) K. von Rottkay, M. Rubin, and P. A. Duine, J. Appl. Phys. 85, 408 (1999).
- Geerken and Griessen (1983) B. M. Geerken and R. Griessen, J. Phys. F: Met. Phys. 13, 963 (1983).
- Favier et al. (2001) F. Favier, E. C. Walter, M. P. Zach, T. Benter, and R. M. Penner, Science 293, 2227 (2001).
- Dankert and Pundt (2002) O. Dankert and A. Pundt, Appl. Phys. Lett. 81, 1618 (2002).
- Aspnes et al. (1979) D. E. Aspnes, J. B. Theeten, and F. Hottier, Phys. Rev. B 20, 3292 (1979).
- (66) P. Herzig, (private communication).
- (67) S. Auluck, (private communication).
- Sprunger and Plummer (1991) P. T. Sprunger and E. W. Plummer, Chem. Phys. Lett. 187, 559 (1991).
- Krozer et al. (1996) A. Krozer, A. Fischer, and L. Schlapbach, Phys. Rev. B 53, 13808 (1996).
- Gupta (1993) M. Gupta, Z. Phys. Chem. 181, 543 (1993).
- (71) P. Vajeeston, (private communication).
- Gygi and Baldereschi (1989) F. Gygi and A. Baldereschi, Phys. Rev. Lett. 62, 2160 (1989).
- Del Sole and Girlanda (1993) R. Del Sole and R. Girlanda, Phys. Rev. B 48, 11789 (1993).
- Thomas et al. (1973) J. Thomas, G. Stephan, J. C. Lemonnier, M. Nisar, and S. Robin, Phys. Stat. Sol. (b) 56, 163 (1973).
- Jouanin et al. (1976) C. Jouanin, J. P. Albert, and C. Gout, J. Phys. (Paris) 37, 595 (1976).
- Roessler and Walker (1967) D. M. Roessler and W. C. Walker, Phys. Rev. 159, 733 (1967).
- Schönberger and Aryasetiawan (1995) U. Schönberger and F. Aryasetiawan, Phys. Rev. B 52, 8788 (1995).
- Shirley (1998) E. L. Shirley, Phys. Rev. B 58, 9579 (1998).
- de Boer and de Groot (1998a) P. K. de Boer and R. A. de Groot, J. Phys.: Condens. Matter 10, 10241 (1998a).
- Ching et al. (1995) W. Y. Ching, F. Gan, and M.-Z. Huang, Phys. Rev. B 52, 1596 (1995).
- Strehlow and Cook (1973) W. H. Strehlow and E. L. Cook, J. Phys. Chem. Ref. Data 2, 163 (1973).
- Franzen et al. (1977) H. F. Franzen, J. Merrick, M. Umaña, A. S. Khan, D. T. Peterson, J. R. McCreary, and R. J. Thorn, J. Electron Spectrosc. Relat. Phenom. 11, 439 (1977).
- Weaver et al. (1984) J. H. Weaver, M. Gupta, and D. T. Peterson, Solid State Commun. 51, 805 (1984).
- Xiao et al. (1994) C.-Y. Xiao, J.-L. Yang, K.-M. Deng, Z.-H. Bian, and K.-L. Wang, J. Phys.: Condens. Matter 6, 8539 (1994).
- Baroni et al. (1985) S. Baroni, G. Pastori Parravicini, and G. Pezzica, Phys. Rev. B 32, 4077 (1985).
- de Boer and de Groot (1998b) P. K. de Boer and R. A. de Groot, Eur. Phys. J. B 4, 25 (1998b).
- Brown et al. (1970) F. C. Brown, C. Gähwiller, and H. Fujita, Phys. Rev. B 2, 2126 (1970).