Strong 3D correlations in vortex system of Bi2212:Pb
Abstract
The experimental study of magnetic flux penetration under crossed magnetic fields in Bi2212:Pb single crystal performed by magnetooptic technique (MO) reveals remarkable field penetration pattern alteration (flux configuration change) and superconducting current anisotropy enhancement by the in-plane field. The anisotropy increases with the temperature rise up to . At an abrupt change in the flux behavior is found; the correlation between the in-plane magnetic field and the out-of-plane magnetic flux penetration disappears. No correlation is observed for . The transition temperature does not depend on the magnetic field strength. The observed flux penetration anisotropy is considered as an evidence of a strong 3D correlation between pancake vortices in different CuO planes at . This enables understanding of a remarkable pinning observed in Bi2212:Pb at low temperatures.
pacs:
74.72.Hs, 74.60.Ge, 74.60.Jg, 74.25.HaI Introduction
The structure and dynamics of the magnetic flux in high- superconductors (HTSC) are intensively studied because of their importance for both a fundamental physics and applications. The main results of these studies are summarized in several reviews. Brandt ; Fein ; Blat The investigations reveal the variety of flux line lattice (FLL) states or phases in HTSC. Peculiarities of the FLL structure are determined by the crystal symmetry or by the origin of pinning. The transitions between different FLL phases are possible with temperature and magnetic field variation. The qualitative difference in the FLL properties is found to be closely related to the layered structure of crystal lattice of low and high anisotropic HTSC materials. In particular, the pancake-like and Josephson-like vortex structures are observed in inclined magnetic field in highly anisotropic Bi- and Tl-based superconductors, whereas anisotropic Abrikosov vortices are found in superconductors with a lower anisotropy, such as YBCO. However, even in the highly anisotropic superconductors the three-dimensional (3D) correlations can exist between two-dimensional the (2D) pancake-like vortices located in neighboring CuO planes. Brandt ; Fein ; Blat The FLL behavior of such 3D-correlated phase is in some aspects closer to the anisotropic Abrikosov vortex lattice than to uncorrelated 2D phase. Basically, the 3D correlations in the pancake structure could disappear with the increase of temperature due to the first-order phase transition or FLL melting. A possibility of different types of the FLL phase transitions in highly anisotropic HTSC was widely discussed. Brandt ; Fein ; Blat ; melt ; kosh ; baz ; dod ; Zeld ; InvM ; ir1 ; ir2 ; ir3 ; ir4
The high resolution magnetooptic (MO) technique revMO ; revMO1 is admitted to be a convenient tool for direct observation of the magnetic flux structure and dynamics in superconductors. In particular, the MO studies in crossed magnetic fields are employed to clarify a presence or absence of the 3D correlations in FLL of superconductor single crystals. In ; Zeld ; InvM ; Vl-Vl ; Grig ; Tokun1 ; Tokun2 ; Mats Usually, a plate like sample of a single crystal is placed in these experiments in a DC magnetic field directed in the sample plane, , and then a field, , perpendicular to the plane is applied. In such geometry the MO technique is used to study a penetration of the magnetic flux induced by the field . The experiments reveal two strikingly different types of flux behavior depending on the anisotropy of the material. In The transverse flux moves into the YBCO single crystals preferably along the direction of the in-plane magnetic field . Quite contrary, the transverse magnetic flux penetrates independent of the orientation of the in-plane magnetic field in case of highly anisotropic Bi2212 superconductors. This difference can be readily understood. In ; kes ; br
Two systems of orthogonal vortices evidently exist in the sample under considered field configuration. First system is induced by the in-plane field and the second one enters the crystal under the growing perpendicular field. In case of moderate crystal anisotropy, both systems are the systems of mutually perpendicular Abrikosov vortices. It is rather evident that perpendicular flux lines moves easier along the in-plane vortices than across them, because vortex intersection requires additional driving force and additional energy. cross This mechanism is effective for Abrikosov-like vortices and insignificant for the pancake-like structures existed in materials with high anisotropy.
The second reason for the in-plane field induced anisotropy is related to the magnetic interaction between vortices. This interaction gives rise to the so-called force-free configuration CampIv at which vortices are twisted around the in-plane field. The critical current density, , is limited in this case by the specific FLL instabilities. CampIv ; ff1 ; ff2 ; ff3 ; ff4 This current is usually remarkably higher than the current determined by pinning, . This leads to the situation when that the current screening the flux motion along the is much smaller than the current screening the motion across . This mechanism is important for Abrikosov vortices. It could be effective also for the pancake structure in case of strong enough correlation between the pancakes located in different CuO planes. Obviously, an interaction between Josephson vortices and the pancakes should be significantly weaker. In ; kes
However, the absence of strong anisotropy of the magnetic flux penetration induced by the in-plane field, In does not mean that the pancakes and Josephson vortices are completely independent in Bi2212. A specific weak interaction is discussed widely and acknowledged by direct MO observation under low magnetic fields in a wide temperature range. Zeld ; InvM ; Vl-Vl ; Grig ; Tokun1 ; Tokun2 ; Mats ; bul ; sav
The transition between two mentioned above types of magnetization behavior of superconductors is not reported in the literature. Probably such type of transition could be observed in the material with an intermediate anisotropy compared to YBCO and Bi2212. Possible way to achieve the goal is to increase the anisotropy of the YBCO material by preparing of oxygen-deficient samples or to reduce the anisotropy of the Bi2212 superconductor by Pb doping.
It is well known, that Pb doping in Bi2212 single crystals baz ; Pb1 ; Pb2 ; Pb4 ; Pb reduces the electromagnetic anisotropy parameter from downto , where denotes the normal resistivity along the corresponding crystal axis i, as measured at K with Pb content varying from 0 to 0.3. Besides, the doping significantly increases the critical current density that was attributed to the pinning at so-called ’laminar’ superstructure formed by variation of the Pb concentration in a system of planes parallel to the crystal plane. Pb
In the present work a penetration of the transverse magnetic flux into the Pb-doped Bi2212 single crystals magnetized by the in-plane magnetic field is studied by the MO technique in a wide temperature range, K. We characterize the flux penetration qualitatively by images and quantitatively by the profiles of the perpendicular magnetic induction measured along different directions in the sample plane. We find that the in-plane magnetic field influence remarkably on the transverse flux penetration pattern if the temperature is lower than some threshold value K. The increases the current anisotropy and causes the preferential flux propagation along its direction. The current along the becomes stronger while the current across the becomes weaker. Both the current and flux penetration anisotropy increase with the strength and temperature rise.
The flux behavior changes drastically at . In the temperature range the penetration becomes independent of the in-plane field direction and the flux creep increases significantly. The transition temperature is independent of the strength of both magnetic fields and within the studied range Oe and Oe. So, our samples behave like YBCO at temperatures below and like Bi2212 at higher temperatures.
II Samples
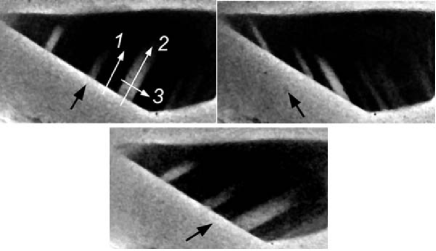
The single crystals of (Bi0.7Pb0.3)2.2Sr2CaCu2O8+δ were grown by the top solution growth technique. Kul ; Kul1 As-grown samples have plate like shape with the main surface coincided with the crystallographic plane. To provide a flat surface that is always necessary for MO studies the samples were chemically polished in ethylendiaminetetraacetic acid. The final thickness of the samples was m. The inductive coil measurements showed K with the transition width about 1 K. For the sake of easier understanding and comparison we present below the images for one typical sample of trapezium shape, shown in Fig. 1. Other crystals of different shape exhibited similar results.
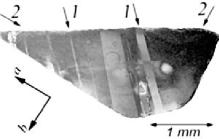
The X-ray scanning revealed typical for Bi2212:Pb planar defects structure, the twins and laminae. Kul ; Kul1 The twin boundaries are parallel to the -axis and coincide with the bisectrix of the angle between - and -axis. Twins are seen in the presented polarized-light image as stripes with light and dark contrast, some of them are marked by arrows 1 in Fig. 1. The laminar structure coincides with -plane. It is parallel with two trapezium sides in Fig. 1 (the directions of invisible in polarized light laminae are shown by arrows 2).
III Experimental
The MO studies were performed in the temperature range from 12 K to . The distribution of the transverse magnetic induction was observed by means of standard MO technique. revMO ; revMO1 ; MO The indicator films used in the study allow us to correctly reconstruct the magnetic induction distribution in fields up to 2000 Oe. The MO images were taken by the EDC1000 digital video camera of fixed sensitivity and variable exposure. The brightness of the images is a function of magnetic induction. Taking benefits of constant film sensitivity within the temperature range K we calibrate the brightness with respect to the induction value. For this purpose we recorded the MO images at a set of values of the and at slightly above . As a result, the field mapping and profiles of the transverse magnetic induction along and across the applied in-plane magnetic field were obtained.
The transverse magnetic field parallel to the crystal -axis was generated by a solenoidal coil and varies from 0 to Oe. The in-plane magnetic field was produced by Helmholtz coils with a soft magnetic core. The uniformity of the field better than 1 % was attained across the sample. We were capable to rotate the field in any direction and to change its value from 0 to 1800 Oe. The orientation of the in-plane field was controlled by the MO technique with an accuracy about 10-3 rad. The experiments were performed on samples cooled from room temperature either with or without (FC or ZFC regime, respectively).
IV Magnetooptic observations of flux penetration
IV.1 Zero in-plane field
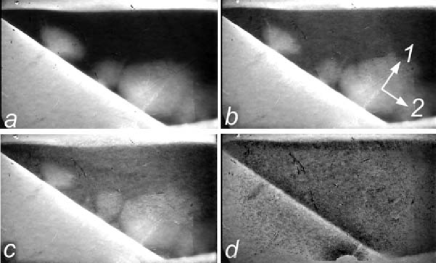
The transverse magnetic flux penetrates into the sample under the growing through a few ”weak points”, which are located at the positions where the twin boundaries intersect the sample edges, compare Figs. 1 and 2. The flux enters through the same points within the temperature range K. The penetrated flux looks like a bubbles attached to the sample edges, Figs. 2a-2c, White spots near the left sample edge in Fig. 2 correspond to the entered magnetic flux; the brighter is the spot the higher is the induction.
An increase of expands flux ’bubbles’ living then attached to the edge. The same penetration depth is reached at lower fields with temperature increase. The shape of the entered flux is near the same at all temperatures below K.
The flux localization allows us to easily determine anisotropy of the flux penetration in the -plane based on the bubble’s shape. This anisotropy is remarkably smaller than expected from the literature data about critical current anisotropy. Pb4 Note, the twin structure in our sample is arranged so that the -axis is parallel to the left edge of the sample in Fig. 1. Therefore the current along the edge should be -times higher than the current across the edge. Pb4 Hence, the flux penetration across the edge should be shorter than along the edge. Moreover, the higher is the temperature the greater should be anisotropy. In our experiments most of the observed flux ’bubbles’ show rather small anisotropy at all temperatures below K. Only flux spot located very near to the sharp corner of the sample has a pronounced flux penetration anisotropy, Fig. 2. However this anisotropy could be explained by an influence of laminar structure as well as by Meissner current configuration along the nearest sample edges.
Evidently, the flux penetration characterizes the current anisotropy only qualitatively because the penetration is determined by distribution of all screening currents in the sample.
The current distribution can be calculated from magnetic induction map. MO4 ; Pb4 However the absolute current value can be obtained only under some hypothetical approximations of space current distribution. Therefore the derivative of the induction taken in the direction perpendicular to the flux front, , which is proportional to the current value, is given in the figures below. The profiles measured along () and across () laminar structure are given in Fig. 3 (corresponding directions are marked by arrows in Fig. 2b).
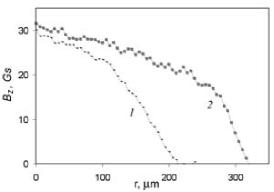
The magnetic induction in the ”bubble” is a slowly varying function of coordinates near the center of the flux and decays steeply at the periphery. This steep part is used to determine proportional to the current. The magnetic induction slopes demonstrate definite anisotropy, which could be attributed to some extent to the flux pinning by the laminar structure.
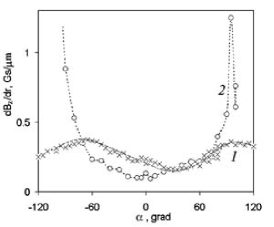
The slope of varies with the direction, Fig. 4 (curve 1), that is determined as an angle, , between the directions of vector and the perpendicular to the laminae, marked by 1 in Fig. 2b. It should be noted that the higher is the in some direction, the higher is the current , that flow in perpendicular direction. We find that the current anisotropy does not follow exactly the expected anisotropy with minimum current along the laminae, and maximum current across them, . We find shift of both directions at which the current reaches the extremum for -clockwise. The current anisotropy to compare with the literature data Pb4 could be characterized by the coefficient defined as the ratio of maximum and minimum derivatives taken at the flux sport periphery, . The does not acceed 2 in temperature range from 12 K up to 50 K and fields up to 300 Oe.
The magnetic field penetration behavior changes with temperature, compare Figs. 2a-2d. The magnetic flux ’bubbles’ remane attached to the flux entrance points with field rise while K. However the flux creep grows with the temperature. The flux configuration is quasi-stable at K; the flux enters only a few percent deeper into the sample in ten minute after increase at K; the flux spreads in seconds for 20% deeper at K still remaining separated ”bubbles” with definite -slopes at flux periphery if is small enough. The shape of the entered flux and the induction distribution profiles looks very similar in this temperature range for the flux that just enter the sample and for awhile.
At , the flux penetration behavior changes drastically. The magnetic flux starts to penetrate the superconductor at some ”weak” points and spreads very fast in the whole sample volume. Only frame by frame browsing of video-records allows us to understand the flux behavior. We found that the flux spreads very fast through the geometrical center of the sample, changing the shape from the beachcomber for smooth flux distribution dropped near the sample edges by Meissner current. All process runs in a time less than 0.1 s. So during this short time the flux distribution becomes typical for undoped Bi2212, Fig. 2d, that is determined by Meissner current in the absence of pinning. In
IV.2 MO studies in crossed fields
The in-plane magnetic field, , changes the flux penetration pattern if . The magnetic field enters the superconductor from the same weak points as without . However the flux diffuses predominantly along the direction of the . For this reason, the entered flux looks now rather like stripes, extended along the .
Typical pictures of the distribution in the presence of perpendicular magnetic flux penetration into the sample cooled in the in-plane magnetic field (FC regime) are shown in Fig. 5 at fixed value of the transverse field and temperature . Different images in the figure correspond to different directions of the vector . The flux penetration depth and the magnetic induction magnitude rise with the increase of transverse field . The anisotropy of magnetic flux penetration increases monotone with the in-plane magnetic field; the entered flux ’stripes’ become narrow and longer. The anisotropy is the same in FC and ZFC regimes.
The appearance of the penetration anisotropy induced by the in-plane field in Bi2212:Pb was not reported till now. Such behavior of the magnetic flux is observed within the temperature range from 12 to K. This type of the field penetration is analogous to that usually observed in YBCO single crystals.
The Fig. 6 shows three profiles of the magnetic field induction taken along the directions shown in Fig. 5. Curve 1 is the coordinate dependence of along the direction (-axis) measured between two weak points where the magnetic flux penetration is screened by the supercurrents. Some growth of the magnetic field near the edge is due to the non-zero demagnetizing factor of the sample. This field ’hill’ is always observed near thin crystal. Curve 2 is the magnetic induction profile scanned in the same direction but near the weak point within the band of the magnetic flux penetration into the superconductor. This profile exhibits a definite drop near the surface due to the Meissner current.
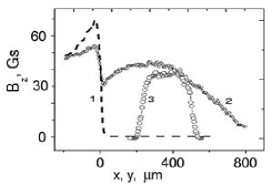
In the bulk of the sample, the entering magnetic flux has a variable slope similar to that in the case of 0, Fig. 3; namely, varies slowly near the magnetic induction maximum and drops down almost linearly at the flux periphery. Profile 3 is obtained in the same flux penetration zone as profile 2 but in the direction perpendicular with respect to the vector (-axis). This profile also consists of parts with different slopes, that is, a central part with a small flux gradient and two peripheral parts with the much steeper and almost linear slopes. The value of the transverse (with respect to the in-plane field) slope is much larger than the longitudinal one and both of them are much smaller than the slope of the magnetic induction due to the Meissner current, compare profiles in Fig. 6.
The in-plane field changes the gradient of the magnetic induction, , along all flux periphery. The corresponding angle dependence, measured in the same manner as in the case of 0, is shown in Fig. 4 (curve 2). The distribution is obtained for the stripe-like flux entered the crystal at K following FC under 1800 Oe. The is directed along laminae. The has minimum in this namely direction and increases sharply near perpendicular direction. It is evident the in-plane field induced anisotropy is much stronger than the anisotropy due to the laminar structure.
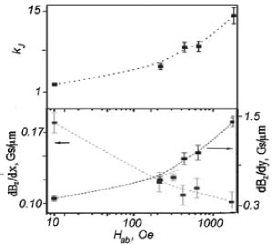
The slopes of the induction and the currents proportional to the slopes, changes with the value of the in-plane field. The induction derivative along the in-plane field decreases with while the derivative across this direction increases, Fig. 7. Hence, is an increasing function while is a decreasing one. Accordingly, the current anisotropy is a rising function of , Fig. 7. So, the current in Bi2212:Pb behaves with the in-plane field at in the same manner as in YBCO.
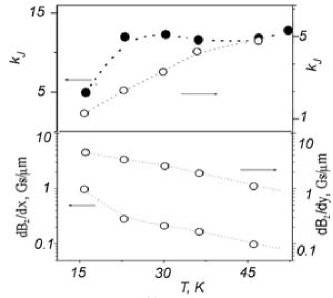
The magnetic flux penetration depth grows monotone with in the temperature range K, Fig. 8. It is evident the geometrical anisotropy of flux penetration increases with . The analysis of the magnetic field profiles reveals that the current anisotropy is a growing function of temperature as well despite both screening current components and decrease with temperature, Fig. 9. The curves , are also presented in Fig. 9. These values increase with temperature approaching to saturation at K for and K for .
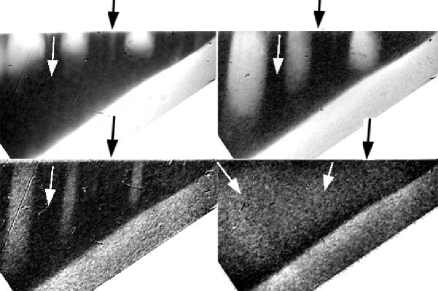
The picture of the magnetic field penetration changes dramatically if temperature exceeds the transition value (see Fig. 8d) just as in the case of . The flux motion becomes independent of the in-plane magnetic field direction. The vortex lines enter the sample through a weak points in the same way as at lower temperatures, but move to definite geometric ’center’. The position of this ’center’ is determined by the sample shape only and does not depend on the direction and value of the in-plane field. The magnetic flux fills the sample volume in a time less than 0.04 s. Browsing of the MO frame sequence allows us to reveal the direction of the magnetic flux motion indicated by white arrows in Figs. 8, black arrows indicate directions of the in-plane field. Such mode of flux penetration in crossed fields is similar to that observed in Bi2212 single crystals in the absence of pinning. The final vortices distribution in our samples at is also similar to Bi2212 with typical dome-shape determined by the geometric barrier. It should be emphasized that the crossover temperature K is independent of the magnetic field within the field ranges Oe and Oe.
We studied also these phenomena in samples with the same Pb doping but without twins. The magnetic flux enters such samples by a wide pillow-like front. The in-plane magnetic field influence the depth of the flux penetration and the magnetic induction slope. The anisotropy induced by the in-plane field was observed in these samples only at .
The described above behavior of the magnetic flux in the FC regime is similar to the picture of the magnetic field penetration in the ZFC mode.
V Discussion
V.1 Magnetic flux dynamics below
The MO studies in crossed fields reveal that supercurrents of three different types screen the magnetic flux entering into the sample. The largest current (see curve 1 in Fig. 6) flows near the sample surface far from the ’weak’ points. It can be associated with the Meissner current . The is independent of the in-plane magnetic field and is by order of magnitude higher than two other currents and flowing in the sample bulk along and across the direction of the vector , . Naturally, the values of the screening currents , , and decrease with the temperature.
We observed grows monotone with , Fig. 7. Really, the current along the in-plane field does not act by the Lorentz force on the in-plane vortices, as discussed in the Introduction. In such force-free configuration the critical current density should increase with the increase of . CampIv The growth of with should take place for anisotropic Abrikosov-like flux line structures as well as for 3D correlated stacks of pancake-like vortices.
The current across the in-plane field, , decreases with as one often observe for pinning controlled current, Fig. 9.
The penetration and current anisotropy increases with temperature while , Fig. 12. Such anisotropy growth was found for YBCO single crystals. In This could be connected with the rise of the coherence lengths with . The superconducting correlations between different CuO planes become stronger giving rise to a stronger interaction between the in-plane and transverse magnetic flux.
The presented results show that the magnetic properties of our samples at are in many features analogous to that of YBCO. This allows us to assume the existence of rather strong 3D correlations in the vortex system of Bi2212:Pb.
V.2 FLL phase above and transition temperature
The apparent picture of the magnetic flux penetration changes drastically at . The observed disappearance of the intercoupling between the in-plane and transverse magnetization could find the reasonable explanation in terms of a decay of correlations between pancakes located in different CuO planes. In ; kes ; Letter A possible alternative explanation of the crossover in magnetization behavior at is vortex depinning that means the should be treated as a irreversibility line. Really, the flux creep rate rises and the pinning diminishes with approaching to . However, at this temperature the correlation between the direction of the entering transverse magnetic flux and the in-plane field decays in a step-like manner also. The latter effect could not be explained in terms of the thermal depinning. Moreover, the found crossover temperature is independent of the magnetic field, while the magnetic field dependence of the irreversibility line is usually strong for Bi-based systems. ir1 ; ir2 ; ir3 ; ir4 Thus, an attempt to attribute thermal depinning fails. In the same time, a decay of a 3D-correlations in the flux line system should be supplemented by the reducing of the bulk pinning and by disappearance of correlations between the transverse and in-plane flux. Therefore, we consider the 3D-2D crossover as a more realistic explanation of the observed transition at .
Such type of 3D-2D transition could occur due to a melting of the vortex structure during which the strong correlated stacks of pancakes melt in disordered gas or liquid of 2D vortices. Fein ; Blat ; Brandt An indication that the observed change in FLL properties at is due to some first-order phase transition is the behavior of the magnetic flux penetration anisotropy versus the temperature. The anisotropy increases with and reduces abruptly at . The transition of the pancake stacks into the phase of non-correlated 2D vortices should lead to a considerable increase of the thermal creep, e.g. due to diminishing of the activation volume and due to corresponding decrease of the effective pinning, Blat that is observed in the experiment.
Following common conceptions, Fein the melting temperature can be estimated by equating the characteristic energies of the FLL elastic strain and thermal fluctuations , where is Boltzmann’s constant. The corresponding relation is given by
| (1) |
where 1 is Lindeman’s constant, is the FLL shear modulus, is the FLL constant, and is an effective correlation length between the pancakes along -axis. Lind1 ; Lind2 The coincides with the distance between neighboring CuO planes by order of magnitude in strongly anisotropic system. Fein The melting temperature defined by Eq. (1) is independent of the perpendicular magnetic field since and . Fein ; Blat ; Brandt The last fact is in agreement with the results of the present experiments. In the dislocation melt approach Lindeman’s constant can be estimated as . Lind1 Substituting and into Eq. (1) one finds the equation for the melting temperature Fein ; Lind2
| (2) |
where is the magnetic flux quantum and is the London penetration depth in the -plane. We find K if nm and nm, which seems reasonable for Bi2212:Pb. Pb ; Kul This estimation is not a strong proof but some evidence in favor of the 3D-2D transition.
In disordered 2D phase the correlation between the motion of the transverse flux and the in-plane magnetic field is significantly lower compared with the 3D correlated system. The reduction of the activation volume makes easier the thermoactivated motion of the non-correlated 2D vortices in any direction.
VI Conclusion
The MO studies of Bi2212:Pb single crystals in crossed magnetic fields revealed that a transition occurs in the magnetic flux behavior at K. The transverse magnetic flux at behaves like in YBCO spreading preferably along the in-plane magnetic field. At the transverse flux penetrates independent of the in-plane magnetic field as in Bi2212 system. The anisotropy of the flux penetration increases with the in-plane magnetic field and temperature at . The transition temperature is independent of the magnetic field. The obtained experimental results could be understood within the concept of the flux line melting giving rise to the transition of 3D correlated stacks of pancakes into disordered phase of 2D ones. We believe that the existence of strong 3D correlations in the flux line structure due to Pb doping is the main reason for enhanced critical current in Bi2212:Pb.
Acknowledgements.
The authors acknowledge M. V. Indenbom, V. V. Riazanov, L. M. Fisher, I. F. Voloshin, A. V. Kalinov, I. K. Bdikin for useful discussions, and Alexander von Humboldt Foundation for financial support for part of the experimental equipment. This work is supported by INTAS (grant 01–2282), RFBR (grants 02–02–17062 and 00–02–18032) and Russian State Program on Superconductivity (project 40.012.1.1.11.46).References
- (1) E. H. Brandt, Rep. Prog. Phys. 58, 1465 (1995).
- (2) D. Feinberg, J. Phys III (France), 4, 169 (1994).
- (3) G. Blatter, M. V. Feigel’man, V. B. Geshkenbein, and V.M. Vinokur, Rev. Mod. Phys. 66, 1125 (1994).
- (4) D. T. Fuchs, E. Zeldov, D. Majer, R. A. Doyle, T. Tamegai, S. Ooi, and M. Konczykowski, Phys. Rev. B54, 796 (1996).
- (5) A. E. Koshelev, Phys. Rev. Lett. 83, 187 (1999).
- (6) M. Baziljevich, D. Giller, M. McElfresh, Y. Abulafia, Y. Radzyner, J. Schneck, T. H. Johansen, and Y. Yeshurun, Phys. Rev. B62, 4058 (2000).
- (7) M. J. W. Dodgson, cond-mat/0201197 (2002).
- (8) A. Soibel, E. Zeldov, M. Rappoport, Yu. Myasoedov, T. Tamegai, S. )0i, M. Konczyakowski, V. B. Geshkenbein, Nature, 406, 282 (2000).
- (9) N. Avraham, B. Khaykovich, Yu. Myasoedov, M. Rappoport,H. Shtrikman, D. E. Feldman, T. Tamegai, P. H. Kes, Ming Li, M. Konczyakowski, Kees van der Beek, E. Zeldov, Nature, 411, 451 (2001).
- (10) A. Schilling, R. Jin, J. D. Guo, and H. R. Ott, Phys. Rev. Lett. 71, 1899 (1993).
- (11) R. Cubitt, E. M. Forgan, G. Yang, S. L. Lee, D. McK Paul, H. A. Mook, M. Yethiraj, P. H. Kes, T. W. Li, A. A. Menovsky, Z. Tarnawski, and K. Mortensen, Nature, 365, 407 (1993).
- (12) K. Harada, T. Matsuda, H. Kasai, J. E. Bonevich, T. Yoshida, U. Kawabe, and A. Tonomura, Phys. Rev. Lett. 71, 3371 (1993).
- (13) S. L. Lee, P. Zimmermann, H. Keller, M. Warden, I. M. Savic, R. Schauwecker, D. Zech, R. Cubitt, E. M. Forgan, P. H. Kes, T. W. Li, A. A. Menovsky, and Z. Tarnawski, Phys. Rev. Lett. 71, 3862 (1993).
- (14) Ch. Joss, J. Albrecht, H. Kuhn, S. Leonard, and H. Kronüller, Rep. Progr. Phys. 65, 1651 (2002).
- (15) V. K. Vlasko-Vlasov, U. Welp, G. W. Crabtree, and V. I. Nikitenko, in Physics and Material Science of Vortex States, Flux Pinning and Dynamics, Vol. 356 of NATO Advanced Study Institute, Series E: Applied Sciences, edited by R. Kossowvsky et al. (Kliwer, Derdrecht, 1999), pp. 205-237.
- (16) M. V. Indenbom, A. Forkl, B. Ludescher, H. Kronüller, H.-U. Habermeier, B. Leibold, G. D’Anna, T. W. Li, P. H. Kes, and A. A. Menovsky, Physica C 226, 325 (1994).
- (17) V. K. Vlasko-Vlasov, A. Koshelev, U. Welp, G. W. Crabtree, and K. Kadowaki, Phys. Rev. B66, 014523 (2002).
- (18) A. Grigorenko, S. Bending, T. Tamegai, S. Ooi, M. Henini, Nature, 414, 728 (2001).
- (19) T. Matsuda, O. Kamimura, H. Kasai, K. Harada, T. Yoshida, T. Akashi, A. Tonomura, Y. Nakayma, J. Shimoyama, K. Kishio, T. Hanaguri, K. Kitazawa, Science, 294, 2136 (2001).
- (20) M. Yasugaki, K. Itaka, M. Tokunaga, N. Kameda, T. Tamegai, Phys. Rev. B65, 212502 (2002).
- (21) M. Tokunaga, M. Kobayashi, Y. Tokunaga, T. Tamegai, Phys. Rev. B66, 060507 (2002).
- (22) P. H. Kes, J. Aarts, V. M. Vinokur, and C. J. van der Beek, Phys. Rev. Lett. 64, 1063 (1990).
- (23) E. H. Brandt, Phys. Rev. Lett. 68, 3769 (1992).
- (24) M. Bou-Diab, M. J. W. Dodgson, G. Blatter, Phys. Rev. Lett. 86, 5132, (2001).
- (25) A. M. Campbell and J. E. Evetts, Critical Currents in Superconductors (Taylor and Francis, London, 1972).
- (26) E. H. Brandt, Phys. Rev. B25, 5756 (1982).
- (27) A. Perez-Gonzalez and J. R. Clem, Phys. Rev. B31, 7048 (1985).
- (28) M. A. R. LeBlanc, S. Celebi, S. X. Wang, and V. Plechacek, Phys. Rev. Lett. 71, 3367 (1993).
- (29) M. V. Indenbom, C. J. van der Beck, V. Berseth, W. Benoit, G. D’Anna, A. Erb, E. Walker, and R. Fluekiger, Nature 385, 702 (1997).
- (30) L. N. Bulaevskii, M. Maley, H. Safar, and D. Dominguez, Phys. Rev. B53, 6634 (1996).
- (31) S. E. Savel’ev, J. Mirkovic, and K. Kadowaki, Phys. Rev. B64, 094521 (2001).
- (32) F. X. Rei, J. Schneck, H. Savary, R. Mellet, and C. Daguet, Appl. Supercond. 1, 627 (1993).
- (33) I. Chong, Z. Hiroi, M. Izumi, J. Shimoyama, Y. Nakayama, K. Kishio, Y. Nakayama, T. Terashima, Y. Bando, and M. Takano, Science 276, 770 (1997).
- (34) J. Shimoyama, K. Murakami, K. Shimizu, Y. Nakayama, K. Kishio, Physica C 357-360, 1091 (2001).
- (35) T. Motohashi, Y. Nakayama, T. Fujita, K. Kitazawa, J. Shimoyama, and K. Kishio, Phys. Rev. B59, 14080 (1999).
- (36) A. B. Kulakov, I. K. Bdikin, S. A. Zver’kov, G. A. Emel’chenko, G. Yang, and J. S. Abell, Physica C 371, 45 (2002).
- (37) A. B. Kulakov, I. G. Naumenko, S. A. Zver’kov, A. V. Kosenko, S. S. Khasanov, I. K. Bdikin, G. A. Emel’chenko, M. Fehlman, L. J. Gaukler, G. Yang, and J. S. Abell, J. Cryst. Growth 371, 194 (2001).
- (38) L. A. Dorosinskii, M. V. Indenbom, V. I. Nikitenko, Yu. A. Ossip’ian, A. A. Polyansky, and V. K. Vlasko-Vlasov, Physica C 203, 149 (1992).
- (39) L.S. Uspenskaya, V.K. Vlasko-Vlasov, V.I. Nikitenko, T.H. Johansen, Phys. Rev. B56, 11179 (1997)
- (40) L. S. Uspenskaya, A. B. Kulakov, and A. L. Rakhmanov, Pis’ma v Zh. Exp. Teor. Fiz. 76, 213 (2002) (JETP Letters 76, 180 (2002)).
- (41) D. S. Fisher, Phys. Rev. B22, 1190 (1980).
- (42) M. V. Feigelman, V. B. Geshkenbein, and A. I. Larkin, Physica C 167, 177 (1990).