Cherenkov radiation emitted by ultrafast laser pulses and the generation of coherent polaritons
Abstract
We report on the generation of coherent phonon polaritons in ZnTe, GaP and LiTaO3 using ultrafast optical pulses. These polaritons are coupled modes consisting of mostly far-infrared radiation and a small phonon component, which are excited through nonlinear optical processes involving the Raman and the second-order susceptibilities (difference frequency generation). We probe their associated hybrid vibrational-electric field, in the THz range, by electro-optic sampling methods. The measured field patterns agree very well with calculations for the field due to a distribution of dipoles that follows the shape and moves with the group velocity of the optical pulses. For a tightly focused pulse, the pattern is identical to that of classical Cherenkov radiation by a moving dipole. Results for other shapes and, in particular, for the planar and transient-grating geometries, are accounted for by a convolution of the Cherenkov field due to a point dipole with the function describing the slowly-varying intensity of the pulse. Hence, polariton fields resulting from pulses of arbitrary shape can be described quantitatively in terms of expressions for the Cherenkov radiation emitted by an extended source. Using the Cherenkov approach, we recover the phase-matching conditions that lead to the selection of specific polariton wavevectors in the planar and transient grating geometry as well as the Cherenkov angle itself. The formalism can be easily extended to media exhibiting dispersion in the THz range. Calculations and experimental data for point-like and planar sources reveal significant differences between the so-called superluminal and subluminal cases where the group velocity of the optical pulses is, respectively, above and below the highest phase velocity in the infrared.
pacs:
71.36.+c, 78.47.+p, 41.60.BqI Introduction
Polaritons are hybrid modes of solids and, more generally, dense systems associated with elementary excitations that carry electromagnetic polarization.Born and Huang (1954); Mills and Burstein (1974) Such excitations couple to light, resulting in a new mixed particle called the polariton. The polariton description is, in some sense, an alternative to that involving the index of refraction; polaritons are dressed photons. Phonon polaritons, lattice vibrations coupled to infrared light, were first studied experimentally by spontaneous Raman scattering.Henry and Hopfield (1965) Soon after, mixing of coherent polaritons with visible laser light was reported for GaP.Faust and Henry (1966) The generation, dispersion and decay of phonon polaritons have been extensively investigated using various coherent optical methods, particularly, coherent anti-Stokes Raman scattering (CARS)Shen and Bloembergen (1965) followed by time-domain CARSGale et al. (1986) and, more recently, the closely related technique of impulsive stimulated Raman scattering (ISRS).
This work centers on ISRS, i.e., coherent scattering using pulses whose bandwidth exceeds the polariton frequency.Yan and Nelson (1987) In ISRS experiments, a pump pulse imparts an impulsive force on the phonon component of the polariton starting a coherent oscillation which in turn, through the inverse process, perturbs the index of refraction.Dhar et al. (1994); Merlin (1997) This perturbation is measured by a probe pulse that follows behind the pump pulse at a controllable time delay. The most common ISRS approach to generate coherent polariton fields is to use an intensity grating obtained from crossing two pump beams. This geometry leads to polaritons of nearly well-defined wavevector even in the pulsed case where the (transient) grating travels with the pulses.Wiederrecht et al. (1995); Bakker et al. (1998a) An alternative method, associated with the nonlinear susceptibility , is to excite the electromagnetic component of the polariton through difference frequency generation (DFG), or optical rectification.Bass et al. (1962) Here, the pump pulse induces a nonlinear polarization proportional to its intensity envelope. If the pulse is tightly focused and its group velocity is greater than the phase velocity in the infrared, its polarization leads to emission of infrared light in much the same way that a relativistic dipole emits (coherent) Cherenkov radiation (CR). This interpretation, originally proposed for second-harmonic generation,Tien et al. (1970) was put forth for DFG by Auston and coworkersAuston et al. (1984); Kleinman and Auston (1984); Auston and Nuss (1988) whose technique became later the standard for generating short THz pulses.Hu et al. (1990). Recently, the CR interpretation was revisited in the analysis of pump-probe experiments on ZnSeStevens et al. (2001) and ZnTe.Wahlstrand et al. (2002) In these and other polar materials, strong dispersion near the frequency of the transverse-optical (TO) phonon results in two qualitatively distinct regimes for CR depending on whether the velocity of the source is larger or smaller than the phase velocity of light at zero frequency. In the former, superluminal regime, the CR field is qualitatively the same as in the experiments of Auston and co-workers Auston and Nuss (1988) whereas the latter subluminal regime displays new features. Afanasiev et al. (1999)
In the ultrafast literature, the relationship between the two, transient grating and tightly-focused single pump methods is rarely discussed. While the generation mechanisms are closely related, ISRS is often described as four-wave mixing and, as such, as a technique that distinguishes itself from DFG. Here, we present a unified approach encompassing the two methods. We show that the generation of THz radiation by single or multiple pulses of arbitrary shape can always be described as CR. We also report experimental results on three materials, ZnTe, GaP, and LiTaO3, in three geometries (point, planar, and transient grating) using an electro-optic field sampling technique based on that of Auston and co-workers.Auston and Nuss (1988) This method allows us to map out the polariton field as a function of time delay and lateral position for polarization sources of arbitrary shape and, simultaneously, to image the shape of the source pulse itself.
II Phonon polaritons and optical susceptibilities
As mentioned earlier, polaritons can be described either as excitations that carry polarization through the coupling to the electromagnetic field, or as light perturbed by the refractive index of the medium, which exhibits strong dispersion near the resonant TO frequency. In the Cherenkov picture of phonon polariton generation we take the latter view, incorporating the effect of the infrared-active phonon into the dielectric function and the second-order nonlinear susceptibility. For a diatomic cubic lattice, and neglecting damping, the dielectric function is of the Lorentz form
| (1) |
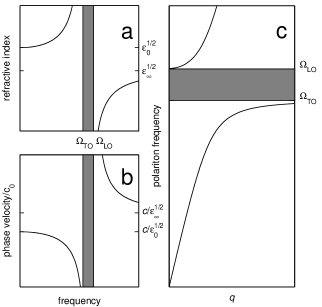
where is the TO frequency of the three-fold degenerate infrared-active mode, is the dielectric constant including the effects of higher-lying resonances, and is the static dielectric constant. The Lyddane-Sachs-Teller (LST) formula gives the relationship between , the longitudinal optical (LO) phonon frequency, and . The refractive index , phase velocity , and polariton dispersion relation are plotted in Fig. 1 for a material with given by Eq. (1). In this work we deal mainly with frequencies below . Near zero frequency, where the dispersion curve is linear, the polariton is mostly light-like whereas, near , it is phonon-like. When there is more than one infrared-active phonon, as in LiTaO3, each mode contributes to the polarization and the dielectric function reflects a sum of these contributions (poles).
Nonlinear interaction of visible light with phonon polaritons involves both the lattice and the THz electromagnetic field. The nonlinear tensor that couples polaritons and visible light is thus composed of two parts: the Raman tensor , which couples visible light to the phonon mode with amplitude , and the second-order nonlinear susceptibility , which couples visible to infrared electric fields. Both of these susceptibilities are almost entirely electronic in nature. Counting both contributions, the total nonlinear polarization isFaust and Henry (1966)
| (2) |
where is the amplitude of one of the three-fold degenerate phonon modes, is the frequency of the visible laser light and is the frequency of the phonon polariton. As is well-known, the Raman contribution can be included in an effective nonlinear susceptibility , each tensor element of which is of the form
| (3) |
where the Faust-Henry coefficient gives the ratio of the Raman (often termed ionic) to the electronic contribution.Faust and Henry (1966) Here, is the transverse effective charge and is the reduced mass of the lattice mode. Because and do not change appreciably with frequency in the THz range, can be approximated as a constant for a given laser wavelength and material. If there is more than one phonon mode, there is a Raman contribution to and to the Faust-Henry coefficient from each one. In our experiments we do not need to consider the dispersion of , for we mainly deal with low frequency polaritons. Thus, in the following we assume that the nonlinear susceptibility is constant, and approximately given by .
III Theory of Cherenkov emission in an infinite crystal
In non-centrosymmetric media, an optical pulse induces through a low-frequency polarization proportional to its intensity. This is DFG, also known as optical rectification.Bass et al. (1962) The dipolar charge distribution moves at the optical pulse’s group velocity and, like a charged particle, it can emit CR if is greater than the phase velocity of the THz radiation in the medium. The bandwidth of the THz radiation emitted by a pulse is limited to the pulse bandwidth. The spatial and temporal shape of the pulse envelope, together with the optical properties of the medium, determine the THz field.
Kleinman and Auston adapted the theory of CR to an optical pulse traveling through a nonlinear isotropic medium.Kleinman and Auston (1984) Their approach, which we build on here, is essentially to separate the nonlinear mechanism by which the polarization in the medium is generated from the Cherenkov mechanism by which infrared light is emitted. This approach works well in the absence of higher-order effects such as self-focusing and self phase modulation, which affect the spatiotemporal shape of the pulse as it propagates, and depletion, which diminishes the induced polarization. Neglecting these effects, the emission process is entirely analogous to the emission of CR by a continuum of dipoles traveling at the group velocity of the pulse. In the following, we discuss electro-optic CR by pulses of a variety of spatiotemporal shapes.
III.1 Point source
For a beam focused to a small waist compared to the polariton wavelength, the polarization induced by the optical pulse can be approximated by a point dipole. This geometry, the 3D case discussed by Kleinman and Auston,Kleinman and Auston (1984) is the closest electro-optic analogue to conventional CR (emitted by a relativistic monopole), which is coherent. The theory of CR was largely worked out more than 60 years ago by Tamm and Frank.Frank and Tamm (1937); Tamm (1939) For an infinite medium and pulses propagating along the axis, the fields are a function of and the cylindrical coordinates and . This approximation, valid for a thick sample, greatly simplifies the theory.
The radiation field due to a propagating dipole can be derived from the radiation field due to a monopole by taking a derivative in the direction of the dipole orientation.Zrelov (1970) In the experiments discussed here, the induced dipole is oriented perpendicular to the axis. For this orientation, the fields are proportional to , where is measured from the direction of the dipole, dropping for simplicity the dependence, we haveFrank and Tamm (1937); Tamm (1939); Zrelov (1970)
| (4) | |||||
| (5) |
where and are the and components of the electric field, and
| (6) |
where is a Hankel function and .
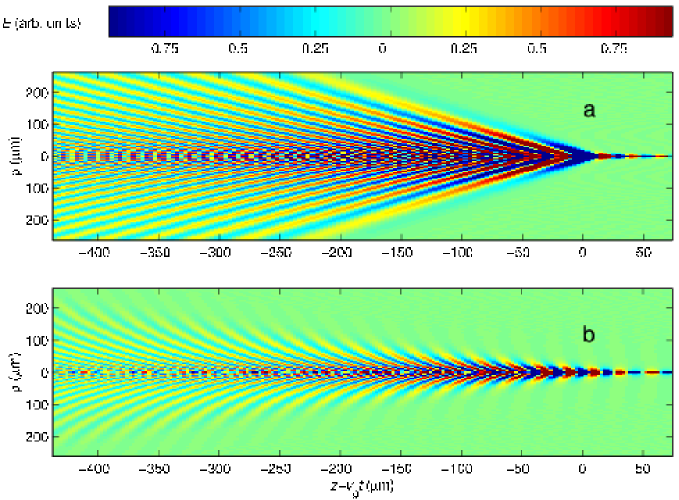
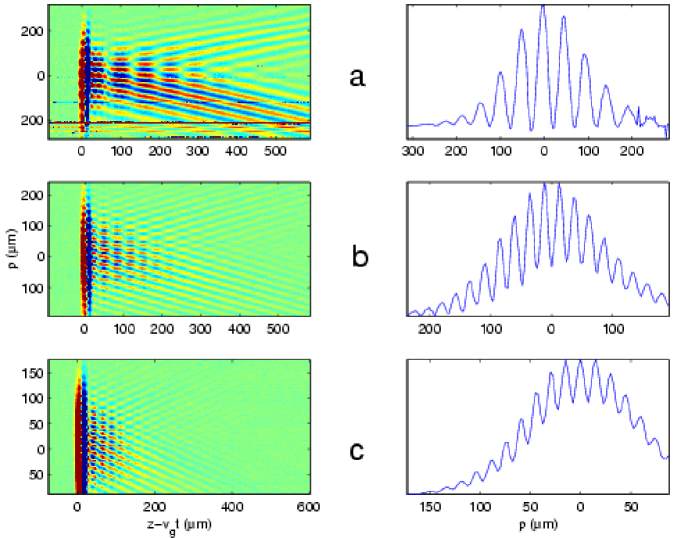
Radiation is emitted at frequencies for which the Cherenkov condition is satisfied. Integrating Eq. (5) over these frequencies, two qualitatively different radiation patterns emerge, depending on .Stevens et al. (2002) For , the laser pulse propagates faster than the entire lower polariton branch . We call this the superluminal regime. For , the laser pulse only travels faster for frequencies in the band , where the velocity matched frequency is defined by . We have referred to this as the subluminal regime.gin
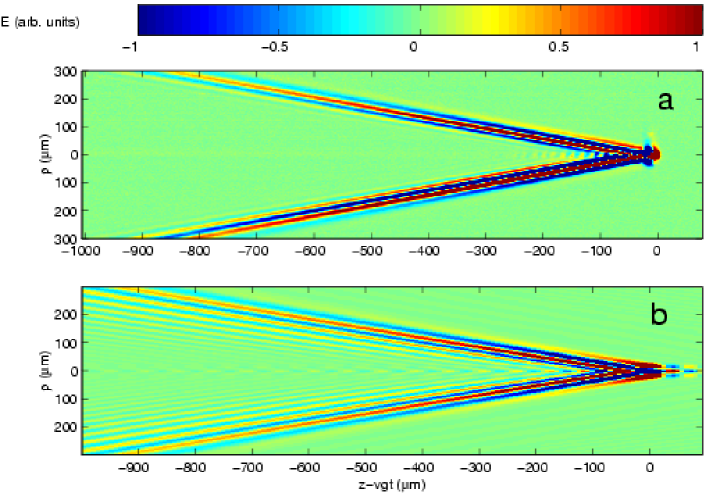
Shown in Fig. 2 are plots of , calculated using Eq. (5), in a medium with refractive index given by Eq. (1). For the superluminal regime (Fig. 2a), there is a sharp shock front with small amplitude ripples behind it. The weak ripples are due to dispersion, but the shock wave is defined by . On the other hand, the subluminal regime (Fig. 2b) is dominated by dispersion effects. The angle of the phase front depends on , and there is a large field near the axis of motion . The radiation pattern is still confined within a cone, but the cone angle becomes larger as decreases, in contrast to the superluminal regime. The special features of the subluminal regime are apparent in the calculations reported by Afanasiev and co-workers.Afanasiev et al. (1999)
In the CR literature, it is common to use the asymptotic form of the fields for large to find an approximate analytical solution. In this limit, becomes
| (7) |
For large , the integral is small except for values of for which the integrand does not oscillate. Using the stationary phase method, Eq. 7 can be approximated as
| (8) |
where are the frequencies within the range of integration for which the phase in the exponential is stationary. These are the solutions to
| (9) |
which defines a cone of angle with respect to the axis. The cone angle depends on frequency because contains . Explicitly, Eq. (9) becomes
| (10) |
The dependence of on is plotted for the two regimes in Fig. 3. In the superluminal case, is a monotonic function of frequency, whereas in the subluminal regime two frequencies map onto the same angle, resulting in the complex beating behavior shown in Fig. 2b.
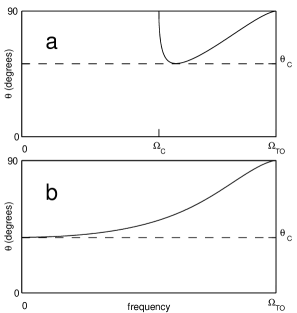
The angle , defined as the smallest angle at which radiation is emitted, is shown as a dashed line in Fig. 3. The frequencies associated with this angle are solutions to . In the superluminal regime, for all frequencies within the range of integration, and is the only solution. Thus, from Eq. (10), , which is the standard Cherenkov formula. In the subluminal regime, there are two solutions. For a material with dispersion given by Eq. (1), , where , , and .Afanasiev et al. (1999)
So far, we have considered isotropic materials, and therefore, the considerations above apply to ZnTe and GaP but, in the strictest sense, not to the uniaxial LiTaO3. The theory of CR in an anisotropic material is considerably more complex than that discussed here, because extraordinary and ordinary waves may be emitted. Other complications result for the case of an extremely tightly focused pulse, for which there exists a small longitudinal component of the laser electric field, leading to the breakdown of the point dipole approximation. In addition, the confocal parameter comes into play resulting in the breakdown of the infinite crystal approximation. We note in passing that exact integrals for an electric dipole oriented arbitrarily with respect to the axis of motion, as well as those of a magnetic dipole, are given in the work of Zrelov.Zrelov (1970)
III.2 Planar source
When the beam waist is much larger than the wavelength of the polariton (), we have another important limiting case. Here, the polarization induced by the optical pulse is shaped like a pancake. This planar geometry is often used for the generation and detection of THz pulses by nonresonant optical rectification.Wu and Zhang (1996); Nahata et al. (1996) When applied to this problem, the CR picture is useful because it quantifies phase matching issues encountered in thick crystals due to dispersion in the infrared.
For an infinitely thick crystal, and approximating the optical pulse as infinitely short (this is valid as long as the pulse is short compared to the period of the radiation being generated) the polarization induced is , where is a unit vector pointing in the direction of the dipole orientation and is the areal polarization. It is possible to obtain the CR field from the point dipole solution by convolution, but here we use the corresponding Hertz potential
| (11) |
The electric field is thenStevens et al. (2001)
| (12) | |||||
| (13) |
It can be shown that the field vanishes unless . In the superluminal regime, for all , and . In the subluminal regime, . Note that the phase matching condition is only met in the presence of dispersion. In the superluminal regime, no radiation is emitted from the bulk because the pulse is traveling faster than the phase velocities of all infrared frequencies.
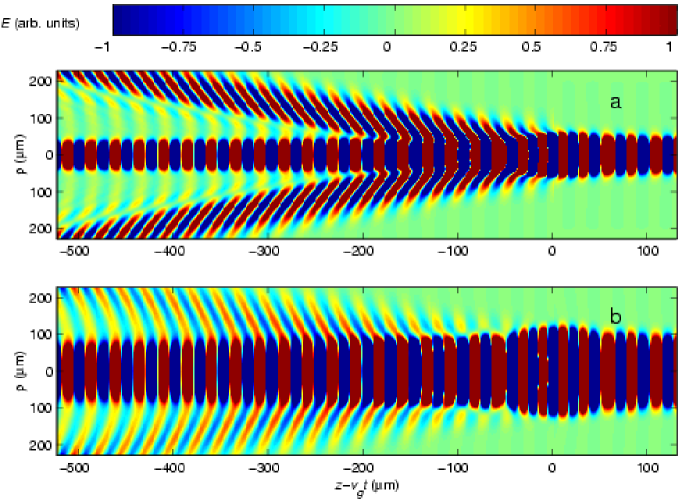
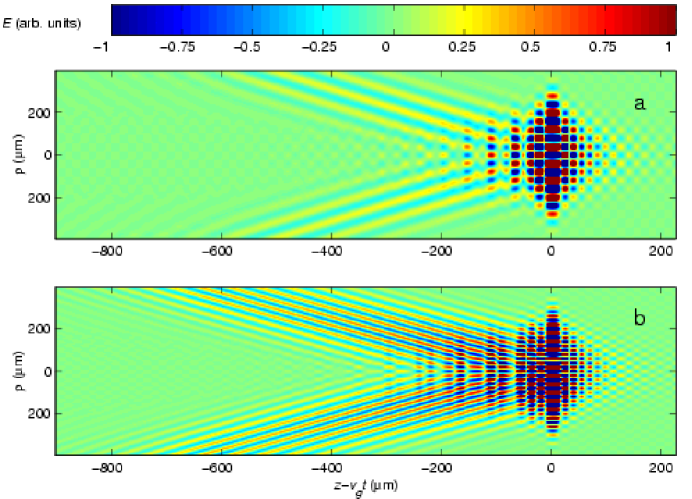
Practically, a beam cannot be focused to a point, nor is it really planar. If cylindrical lenses are used to focus the beam, it can be extended in one direction and tightly focused in another. The extreme case of the 2D geometry was treated by Kleinman and Auston.Kleinman and Auston (1984) The point geometry solution is the Green’s function of the problem, in that the radiation pattern of an arbitrary source can be obtained by convolution of the point solution with the source shape. Two examples are shown in Fig. 4. This is a powerful machinery for calculating the radiation field generated by ultrafast optical pulses which have been shaped spatially and temporally, for example, in the manner recently demonstrated by Koehl, Adachi, and Nelson.Koehl et al. (1999) To the best of our knowledge, our approach has not been previously applied to this problem.
III.3 Periodic source (transient grating)
The last source shape we consider is a periodic distribution, or transient grating, implemented by interfering two pump beams inside the sample. This geometry is useful because it excites a unique polariton wavevector determined by the grating period. If we cross two pump beams of equal intensity at an angle , Gaussian in space with waists in the direction and in the direction and Gaussian in time with pulsewidth , the intensity grating has the form
| (14) |
where is the wavevector of the laser light inside the medium. Here, we have assumed that is small, which makes approximately equal to the group velocity of each separate pulse. This is a good approximation for the experiments described here, since is much larger than the wavevector of the gratings. The Cherenkov angle converts the spatial periodicity of the transient grating into a temporal periodicity in the polariton field, resulting in a checkerboard pattern and a well-defined polariton frequency , as shown in Fig. 5.
In the impulsive limit, a defocused probe pulse traveling at the same speed as the pump pulse and, thus, at the speed of the polariton field, samples a slice of the checkerboard field in the plane. The electric field in this slice is periodic with the same wavevector as the intensity grating. Through the electro-optic effect, the probe pulse diffracts from the periodically varying index of refraction, resulting in an oscillatory signal at as a function of time delay, because the diffracted intensity is proportional to . This technique is known as homodyne detection in the ISRS literature.Wiederrecht et al. (1995) Heterodyne detection,Bakker et al. (1998a); Gautier et al. (1996); Crimmins et al. (2002) in which one mixes the diffracted signal with undiffracted probe light, gives a much larger signal at , because the signal is proportional to . Because it is sensitive to the phase of the polariton field, which defines the phase of the diffracted probe pulse, heterodyne detection works just as well outside the checkerboard, in what we might call the Cherenkov wing of the field. As we discuss in detail below, heterodyne detection is often discussed in terms of four-wave mixing.Gautier et al. (1996)
It is important to emphasize that the wavevector of the grating is not the same as the polariton wavevector, since the polariton propagates in the direction normal to the wavefront. The magnitude of the polariton wavevector is given by , where is the Cherenkov angle. In many early ISRS papers, it is assumed that the wavevector of the grating is the same as the polariton wavevector, tantamount to assuming that is very large. This is generally a poor approximation, and leads to incorrect polariton dispersion measurements, as recently pointed out by Hebling.Hebling (2002)
The simple interpretation above works best for large , in which case the polariton wavevector is well-defined. For small , edge effects make the polariton field more complex but, by convolving the point dipole solution with the grating (as in Fig. 5), we can calculate the polariton field due to a grating of arbitrary shape.
IV Phase matching
One source of confusion when comparing the transient grating, the tightly focused, and the planar geometries is that, at first glance, the phase matching conditions seem entirely different. Here, we clarify this point. An ultrafast pulse contains a continuum of frequencies and wavevectors, and the generated polariton wavevectors are determined by conservation of energy and momentum. The Cherenkov interpretation is, of course, consistent with phase matching. In all geometries, the nonlinear polarization contains terms of the form , where , , , and denote wavevector and frequency components of the optical pulse. For the planar geometry, the wavevector components all point along the axis, and conservation of momentum requires , where is the polariton wavevector. Since ,
| (15) | |||||
| (16) |
making the connection to the group velocity matching argument derived in Section IIIB.
A tightly focused optical pulse has wavevector components pointing in many directions. The dependence of the polarization on forces . The polariton wavevector and frequency must also satisfy . Let be the component of the polariton wavevector perpendicular to the axis. Momentum conservation gives
| (17) |
and the polariton is emitted at an angle to the axis, which is identical to the Cherenkov angle.
In the transient grating geometry, the angle between and is well-defined, and the wavevector is emitted in the direction given by Eq. (17) because the polarization is a function of . The transient grating configuration allows one to excite wavevectors that are higher than those accessible in the planar geometry.
A recently proposed technique developed by Hebling and co-workers relies on a tilted pulse front.Hebling et al. (2002) This can also be encompassed in a Cherenkov radiation framework as a planar source which propagates at an angle. Tuning the tilt angle changes the wavevector of the generated polariton, and this shows promise as an easily tunable THz source.
As is well-known, it is possible to interpret ISRS as four wave mixing.Gautier et al. (1996) Here one hides both the generation and detection of the polariton in , much as we included the Raman contribution to the generation of the polariton in . The four-wave mixing polarization is
| (18) | |||||
where and are the pump fields, is the probe field, and is the effective nonlinear susceptibility defined in Section II. All propagation and damping effects can be included in , and this formalism is often used.Gale et al. (1986)
Finally, we discuss briefly the advantages and disadvantages of the various scattering geometries. The experiments with tightly focused beams produce the highest peak polariton amplitude (for a given pulse peak power), but also a wide range of wavevectors and frequencies. ISRS by a transient grating has the advantage of defining the polariton wavevector and producing a large amplitude polariton at that particular wavevector. CARS has the advantage of yielding the best frequency and wavevector resolution.
V Materials
Generation of electro-optic CR requires a non-zero , present only in crystals without inversion symmetry. In our experiments, we used three readily available and well-characterized materials: the zincblende ZnTe and GaP, and LiTaO3. The parameters relevant to our work are listed in Table 1.
| Parameter | GaP | ZnTe | LiTaO3111Parameters are for the lowest mode. |
|---|---|---|---|
| (THz) | 11.0222Reference Mooradian and Wright, 1966. | 5.32333Reference Gallot et al., 1999. | 6444Reference Barker et al., 1970. |
| (THz) | 12.122footnotemark: 2 | 6.1833footnotemark: 3 | 12555From LST relation using parameters of Ref. Barker et al., 1970. |
| 3.31666Reference Pikhtin et al., 1976. | 3.1633footnotemark: 3 | 6.344footnotemark: 4 | |
| at 800 nm | 3.5666footnotemark: 6 | 3.24777Reference Marple, 1964. | 2.2 |
| 888Calculated from .(THz) | 7.7 | 2.2 | - |
V.1 GaP and ZnTe
Materials with the zincblende structure have a triply degenerate infrared-active optical mode. For light normally incident on a (110) face, the selection rules forbid excitation of the nondispersive LO mode. For the TO mode,
| (19) |
where and are the Raman tensors for the modes polarized along the [] and [001] directions, respectively. The single independent tensor component corresponds to the nonlinear coefficient . The dipolar distribution induced by the pump pulse is always oriented perpendicular to the [110] direction. We measure the polariton by the inverse process, and we are only sensitive to the electric field component .
In their pioneering work using nonlinear mixing of visible and infrared cw laser light, Faust and Henry measured in GaP.Faust and Henry (1966) This leads to total destructive interference between the ionic and electronic contributions to at 6.5 THz. Because this frequency is close to for Ti:sapphire pulses, this results in a small signal. Recently Leitenstorfer and co-workers found in ZnTe by analyzing data from time-domain spectroscopy of THz pulses by electro-optic sampling.Leitenstorfer et al. (1999) This small value leads to at 5.2 THz, very close to . For our experiment in ZnTe, we are only able to measure up to roughly 4 THz, not high enough to probe effects of the dispersion of .
V.2 LiTaO3
This material crystallizes in the perovskite structure. LiTaO3 is ferroelectric at room temperature and exhibits 4 symmetry and 9 symmetry modes, all of which are Raman and infrared active.Raptis (1988) There has been considerable disagreement over the assignment of several Raman peaks, but the lowest-frequency mode considered here is well-characterized. The Raman tensor for phonons isRaptis (1988)
| (20) |
The independent tensor elements and are associated with nonlinear coefficients and , respectively. Here, we use and , which are the largest coefficients, to both generate and detect the polariton. The dipolar distribution points along the optic axis, and the probe pulse is sensitive to the component of the Cherenkov electric field along that axis. Barker, Ballman, and Ditzenberger measured the infrared reflectivity and found that, for the extraordinary index, most of the oscillator strength in the infrared is in the lowest-lying TO mode.Barker et al. (1970) This mode is also the strongest Raman scatterer. We performed our experiment on the lowest polariton branch.
The refractive index in the visible is weakly anisotropic. Since the laser pulses in our experiment are polarized along the optic axis, there is no effect of this anisotropy, in contrast with experiments on modes.Albert et al. (1996) The static dielectric constant is also weakly anisotropic. However, since the lowest-lying and TO frequencies are different (6 and 4.2 THz, respectively), the dielectric function becomes more anisotropic at large frequencies, where the cubic approximation is expected to break down. For the low frequencies discussed here, the approximation is well obeyed. For the lowest-lying mode in LiTaO3, is positive.Boyd and Pollack (1973)
VI Experiments
VI.1 Techniques
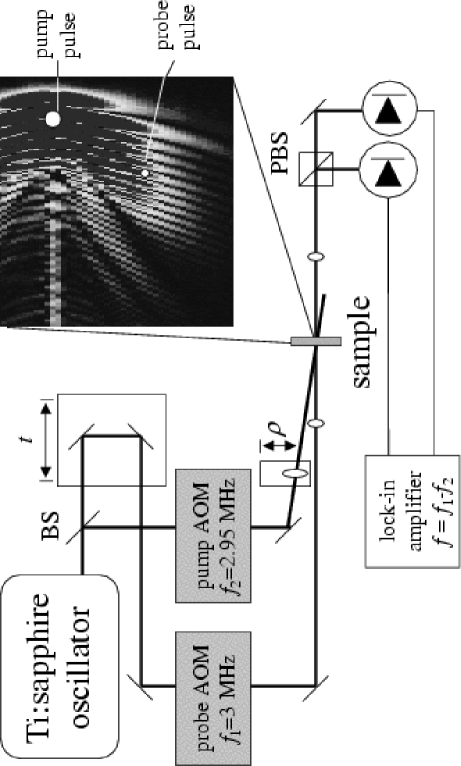
Our experimental technique is similar to that of Auston and Nuss.Auston and Nuss (1988) A diagram of the experimental setup is shown in Fig. 6. Pump and probe beams are focused and crossed inside the sample. The pump pulse is the Cherenkov source and the tightly focused probe serves as the detector of the Cherenkov radiation field. The probe pulse “surfs” on top of the Cherenkov wakefield generated by the pump pulse and samples the polariton field through both the linear electro-optic and the Raman effects, which both cause changes in the refractive index. We change the time delay () between pump and probe with a motorized delay stage in the probe path and the relative focal position () between pump and probe by moving a motorized translation stage upon which the pump’s focusing lens is mounted. By sampling the diffracted probe beam as a function of and , we map the polariton field.
We used two different detection schemes. The first is a frequency shift measurement, which takes advantage of the fact that the spectrum of the probe is shifted proportional to .Dhar et al. (1994) The polariton induces a change in the index of refraction due to its electromagnetic and vibrational components, so that contains a term proportional to and another one to . We measure the frequency shift by cutting half of the probe spectrum with a bandpass filter before detection with a photodiode. This technique is especially useful when the pump and probe polarizations are chosen perpendicular to each other to suppress the scattered pump light. The second technique, widely used for detecting THz radiation, is polarization detection.Valdmanis et al. (1982); Wu and Zhang (1996) When properly oriented, the polariton’s electric field induces birefringence, which can be probed by measuring the polarization state of the probe beam after the sample. This yields a signal directly proportional to the THz Cherenkov electric field.
The spot size inside the crystal was determined experimentally using the same technique. In ZnTe and GaP, two photon absorption depletes the probe when pump and probe overlap temporally and spatially, creating a large Gaussian peak in the signal. In LiTaO3, the intensity-dependent refractive index due to modulates the probe pulse’s phase when it overlaps with the pump pulse, also producing a large signal (known as the coherent artifact).
Auston and Nuss used thin samples and a collinear geometry to achieve spatial resolution on the order of 1.5 m.Auston and Nuss (1988) A problem with this setup is that it is difficult to measure the field behind the source, because of strong pump scattering due to the fact that the two beams are collinear. In order to measure the source itself plus the field behind it, we used the nearly-collinear setup described above, which enables the spatial separation of the pump and probe beams even when they overlap spatially inside the sample. This introduces a source of distortion in the data due to spatial walk-off between the pump and probe pulses as they travel through the sample. To minimize this walk-off, we focused the pump and probe beams with two small lenses placed as close together as possible. In order to ensure that the walk-off did not affect the spatial resolution, we made the plane shared by the pump and probe beams perpendicular to the axis along which the pump lens was moved. We accomplished this by directing the probe beam below the pump lens, and moving the relative focal position horizontally. The resolution in is determined by the pulsewidth of the probe pulse, and in by the focal waist of the probe beam.
Ultrafast pulses were generated by a Ti:sapphire oscillator producing 800 nm, 60 fs pulses at the repetition rate of 82 MHz. Acousto-optic amplitude modulators were used to modulate the pump and probe beams at 3 MHz and 2.95 MHz, respectively, and the probe was detected with an unbiased photodiode at the difference frequency, 50 kHz, with a lock-in amplifier. The maximum pump and probe average power at the sample were 140 and 30 mW, respectively, limited mostly by the efficiency of the modulators. We emphasize the importance of the double-modulation technique because it helps reject the scattered pump light. Recently, experiments have been performed using a Zernike method with a CCD camera, to image the phase change of a weakly-focused probe beam caused by the polariton field as a function of position and time delay.Koehl et al. (1999); Koehl and Nelson (2001) This is another powerful technique for imaging the Cherenkov field, although it suffers from unwanted large scattering near the pump pulse.
VI.2 Point source: Experiments
If the pump pulse is focused to a waist smaller than the wavelength of the polariton, we can approximate it as a point dipole. Because of the large thickness of our samples, we are limited to a focal waist of about 20 m which corresponds to a maximum polariton frequency of 2-4 THz, depending on the material. For lower frequencies, the pump pulse acts like a point dipole.
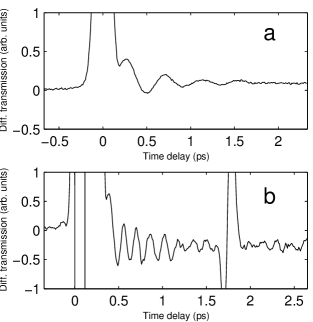
First we discuss the data on LiTaO3, a superluminal material; see Fig. 7. Our sample was an -cut wafer 2 inches in diameter and 1 mm thick, and we used frequency shift detection. For pulses of wavelength 800 nm, . The experiment matches the calculations quite well after taking into account the 20 m pump waist by convoluting the point dipole solution with a Gaussian of that width. However, the absence of ripples behind the sharp Cherenkov cone indicates that damping, not included in the simulation, is strong for higher frequencies. In addition to polaritons of the lowest branch, we were also able to generate and detect polaritons and coherent phonons from higher branches; see later.
Our measurements on ZnTe, a subluminal material, and the comparison with calculations are shown in Fig. 8. The (110) oriented ZnTe sample was 10101 mm3, and polarization-sensitive detection was used. The data shows many of the features predicted for subluminal CR. The artifact that appears about 1.6 ps after the pump pulse is due to a second pulse about 1000 times smaller than the pump pulse, due to a reflection from an optical element upstream. We have subracted the contribution from an exponentially decaying signal caused by free carriers generated by two-photon absorption. This signal is partially balanced out by using polarization-sensitive detection, and the remnant has been fitted and subtracted out in Fig. 8a to show the absence of CR near .
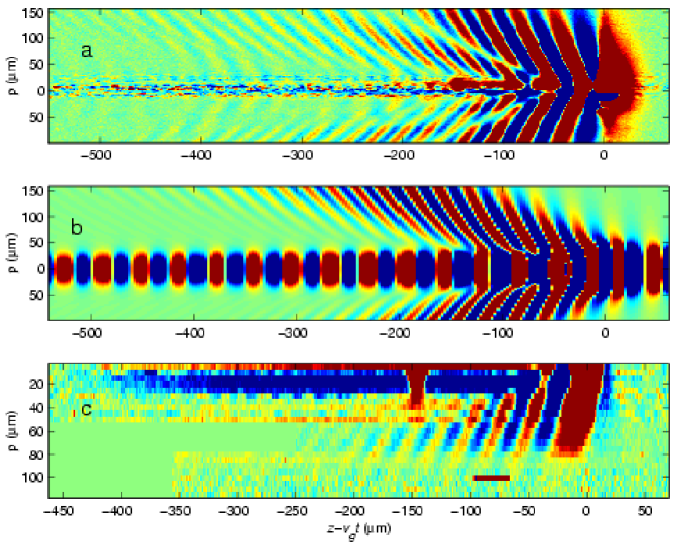
As discussed earlier, subluminal CR is expected to exhibit a beating pattern. In Fig. 8a, there is a striking node that separates the shock wave into two and possibly three distinct parts. This can be explained in the calculations by both subluminal beats, or by a convolution artifact due to the finite spatial size of the pump and probe pulses. However, note that the node is not as prominent in the calculation. This discrepancy, and the lack of experimental signal near , is probably due to the finite size of the crystal, as discussed in detail later.
VI.3 Planar source: Experiments
For the planar geometry, scans were performed only along the axis in the direction. Results for GaP and ZnTe with a pump waist of roughly 100 m are shown in Fig. 9. The GaP sample, (110) oriented, was a 411 mm3 crystal. The time scans show oscillations at the group velocity matched frequencies predicted by theory, with an apparent decay probably due to a combination of the finite length of the sample (see below), and the finite extent of the pump pulse.Stevens et al. (2001) The planar geometry is commonly used for generating THz pulses by nonresonant optical rectification.Nahata et al. (1996) The distortion of the electro-optic sampling signal due to infrared dispersion, especially in a thick crystal, has been the subject of much discussion recently.Bakker et al. (1998b); Gallot and Grischkowsky (1999)
We also performed an experiment on the superluminal material LiTaO3. As expected, there was no signal from the lowest polariton branch. However, our pulses were short enough to see higher branches. The phase matching condition is given by , and this expression was found to match the higher polariton branches quite well.
VI.4 Finite crystal effects
Point geometry experiments were also performed on a 300 m thick ZnTe sample. As is apparent in Fig. 8c, the node we observed in the 1-mm-thick crystal has now disappeared. This is probably a result of the breakdown of the infinite crystal approximation. In the superluminal regime, the infinite crystal calculation works well because the radiation is emitted at large angles at all frequencies down to zero. Therefore, effects of the finiteness of the crystal can be expected only at the very edge of the shock wave, at , where is the length of the crystal. For example, the edge of the shock wave is at mm in our 1 mm thick LiTaO3 sample, well beyond what we can practically measure due to the fall-off proportional to in the electric field from a point source.
The situation is considerably different in the subluminal regime because polaritons near are emitted in the near forward direction. In the 1 mm thick ZnTe crystal, the Cherenkov angle for 2.5 THz polaritons is about , so that this component reaches m before the pulse reaches the end of the crystal. In the 300 m thick crystal, it only reaches m. Thus, the subluminal beats, due to interference between frequency components sent in the forward direction, require some propagation time to develop. We believe this is the reason why they do not appear in the thin crystal. This could also explain other discrepancies between theory and experiment in Fig. 8. The large oscillatory signal at near in the calculation is clearly absent in the experiment, probably because radiation at is emitted in the forward direction The difference in the shape of the cone between theory and experiment is likely due to the same effect. A finite crystal calculation is probably needed to fully understand the details of the experiment. Note that CR in a finite crystal is similar to the so-called “Tamm problem” of CR for a particle traveling along a finite path.Tamm (1939); Afanasiev et al. (2000)
The finiteness of the crystal is expected to play an even more important role in the planar geometry, in which Cherenkov components are emitted exclusively in the forward direction. The CR pattern is the result of interference among these components, so that this pattern should change dramatically with crystal thickness. A very thin crystal would show no propagation effects, simply reproducing the time derivative of the pump pulse envelope as a short THz pulse.
VI.5 Periodic source: Experiments
We adapted the setup described previously to perform experiments with two pump pulses, creating a periodic dipolar distribution in LiTaO3, and used frequency shift detection to map the polariton field. The pump pulse was split into two equally intense pulses which were focused by a single lens and crossed inside the sample at an angle . Using a beam waist such that , we avoided the so-called “pancake effect,”Crimmins et al. (2002) a shrinking of the overlap between weakly-focused pulses due to their short duration. In our experiments, we did not have to measure , because the grating period was directly obtained by measuring the coherent artifact as a function of spatial position. As for the point geometry, we mapped the polariton field due to this pump configuration as a function of and . The results in Fig. 10 show excellent agreement with the theoretical predictions.
VI.6 LiTaO3: Phonons and Polaritons
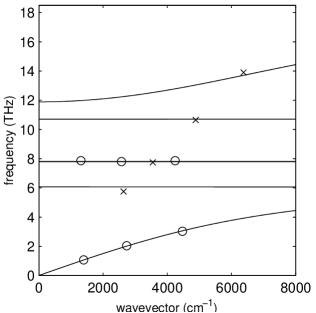
LiTaO3 has a particularly rich history in the ISRS literature.Bakker et al. (1992, 1993); Wiederrecht et al. (1995); Brennan and Nelson (1997); Perry and Dougherty (1997); Bakker et al. (1998a); Bakker (1998); Romero-Rochin et al. (1999); Koehl et al. (1999); Koehl and Nelson (2001); Crimmins et al. (2002) In this section we compare our data to those of other reports. There are two main points of contention in the literature: the origin of frequency-dependent damping effects and avoided crossings at low frequency. Our results for the polariton dispersion are summarized in Fig. 11.
As previously discussed for the transient grating geometry, see below Eq. (17), the Cherenkov angle appears in the expression for the polariton wavevector. Using the correct expression, our data fall almost exactly on the dispersion relation of the lowest branch polaritons inferred from the IR data of Barker et al.Barker et al. (1970) Recent ISRS papers have begun to take this into account as well.Hebling (2002); Crimmins et al. (2002) The grating technique is also sensitive to non-dispersive phonons, and the signal at 7.8 THz roughly matches an phonon peak seen in Raman spectra.Raptis (1988) Scans in the planar geometry, with wavevector given by the group velocity of the pulse, are also shown in Fig. 11. Here, we are sensitive to even more phonon branches, including a higher-branch polariton above 12 THz. Note that higher branches were also observed in a recent heterodyne experiment.Crimmins et al. (2002)
Our measurements of the polariton damping rate by the grating method,dam agree very well with those reported by others: cm-1 at 1 THz, cm-1 at 2 THz, and cm-1 at 3 THz. Large damping, peaked at 2.7 THz, was reported by Auston and Nuss in their original experiment.Auston and Nuss (1988) They suggested that this was due to multi-phonon absorption. In their homodyne transient grating experiment, Wiederrecht et al Wiederrecht et al. (1995) measured increased damping peaked at 2.76 THz and 4.38 THz, and attributed this to strain-induced coupling to heavily damped -symmetry modes at the same frequencies. Very recently, Crimmins, Stoyanov, and Nelson measured the damping rate using heterodyne detection and suggested that the damping is due to quadratic coupling between the phonon-polariton mode at 2.1 THz and the lowest-lying -mode at 4.2 THz.Crimmins et al. (2002)
The inelastic neutron scattering data of Cheng et alCheng et al. (1993) supports the idea that the damping is due to anharmonicity, more precisely, to a process involving the simultaneous creation and destruction of two different phonons. Close to the observed peaks at 2.76 and 4.38 THz, the phonon dispersion shows TO and LA (TA) branches for which the frequency difference at the zone edge, where the density of states is large, is 2.6 THz (4 THz). In this context, we note that decay by two-phonon difference modes has been seen in many materials, including ZnTe.Schall et al. (2001) Furthermore, many spontaneous Raman studiesPenna et al. (1976); Raptis (1988), including one on our particular crystal,Wahlstrand and Merlin show a broad peak at 2.55 THz, consistent with a second-order feature. An alternative explanation for polariton broadening, supported by the fact that the TA and LA branches at the zone edge are at 3.2 and 4.6 THz, respectively,Cheng et al. (1993) is coupling to high-wavevector phonons due to disorder-induced breakdown of momentum conservation. Given that LiTaO3 is often non-stoichiometric, defect-related processes may contribute strongly to the damping.
Another anomaly reported in LiTaO3 is an extra avoided crossing in the polariton dispersion at 0.9 THz.Bakker et al. (1992, 1993, 1998a) Similar avoided crossings were also reported for LiNbO3,Bakker et al. (1994) and increased absorption was observed at the corresponding frequencies in stimulated Raman gain measurements.Qiu et al. (1995) The avoided crossings were assigned by Bakker and co-workersBakker et al. (1998a) to quantum beats between levels of an intrinsic anharmonic potential. However, our work on LiTaO3, as well as a recent heterodyne ISRS experiment,Crimmins et al. (2002) show no sign of an avoided crossing at 0.9 THz. The observation of several low-lying modes in a CARS study of MgO-doped LiNbO3Schwarz and Maier (1998) suggests that the extra modes are due to defects. If this were the case, the reported discrepancies for LiTaO3 may simply be due to differences in the concentration of defects for different samples.
We take issue with the intrinsic anharmonicity proposed by Bakker et alBakker et al. (1998a) to explain these extra modes. Unlike in molecules, lattice anharmonicity in solids leads to decay, because anharmonic coupling involves a continuum of modes. Hence, unless the anharmonicity is strong enough to support 2-phonon bound states, it cannot introduce new frequencies. To the best of our knowledge, no such bound states have been observed in LiTaO3 or LiNbO3.
An unexplored area is the role of anisotropy in LiTaO3. As briefly discussed earlier, for frequencies approaching the lowest -phonon frequency, the index of refraction becomes extremely anisotropic. Anisotropy is known to have an important effect on CRZrelov (1970) but as far as we know, it has been completely ignored in the ISRS literature. For a point charge traveling through a uniaxial material in a direction perpendicular to the optical axis, both ordinary and extraordinary waves are emitted, with the extraordinary waves polarized at a finite angle to the optical axis. Assuming this is also true for a dipole oriented along the optic axis, it should have a large effect on the CR pattern.
Finally, we note the observation of wavevector overtones in transient grating experiments using amplified pulses, which Nelson et alBrennan and Nelson (1997); Romero-Rochin et al. (1999) ascribed to lattice anharmonicity. Since polariton nonlinearity is primarily due to phonon anharmonicity and the polaritons in question are mainly light-like, we consider this interpretation to be questionable. Instead, we propose that the higher-order diffraction peaks simply reflect a non-sinusoidal grating due to higher-order optical nonlinearities. This is an area which needs to be explored further.
VII Conclusions
In summary, we have used ultrafast optical pulses to generate and image coherent polariton fields in ZnTe, GaP and LiTaO3. For single and multiple pulses of arbitrary shape and, in particular, for the transient-grating geometry, we have shown that the polariton field can be calculated by convolving the slowly-varying pulse envelope with the Cherenkov field due to a dipole. The standard phase matching arguments can also be explained by applying ideas from the theory of Cherenkov radiation. Results for point-like and planar sources reveal important differences between the superluminal and subluminal regimes, especially for the Cherenkov emission by a plane of dipoles which can only occur in the subluminal case.
Acknowledgements.
We thank G. Narayanasamy for assistance in the early stages of the experiments and T. E. Stevens for useful discussions. We are grateful to M. DeCamp, C. Herne, and J. Murray for providing the ZnTe samples, and J. Deibel for the LiTaO3 sample. This work was supported by the AFOSR under contract F49620-00-1-0328 through the MURI program, and by the NSF FOCUS Physics Frontier Center.References
- Born and Huang (1954) M. Born and K. Huang, Dynamical Theory of Crystal Lattices (Oxford: Oxford University Press, 1954).
- Mills and Burstein (1974) D. L. Mills and E. Burstein, Rep. Prog. Phys. 37, 817 (1974).
- Henry and Hopfield (1965) C. H. Henry and J. J. Hopfield, Phys. Rev. Lett. 15, 964 (1965).
- Faust and Henry (1966) W. L. Faust and C. H. Henry, Phys. Rev. Lett. 17, 1265 (1966).
- Shen and Bloembergen (1965) Y. R. Shen and N. Bloembergen, Phys. Rev. 137, A1787 (1965).
- Gale et al. (1986) G. M. Gale, F. Vallee, and C. Flytzanis, Phys. Rev. Lett. 57, 1867 (1986).
- Yan and Nelson (1987) Y.-X. Yan and K. A. Nelson, J. Chem. Phys. 87, 6240 (1987).
- Dhar et al. (1994) L. Dhar, J. A. Rogers, and K. A. Nelson, Chem. Rev. 94, 157 (1994).
- Merlin (1997) R. Merlin, Solid State Comm. 102, 207 (1997).
- Wiederrecht et al. (1995) G. P. Wiederrecht, T. P. Dougherty, L. Dhar, K. A. Nelson, D. E. Leaird, and A. M. Weiner, Phys. Rev. B 51, 916 (1995).
- Bakker et al. (1998a) H. J. Bakker, S. Hunsche, and H. Kurz, Rev. Mod. Phys. 70, 523 (1998a).
- Bass et al. (1962) M. Bass, P. A. Franken, J. F. Ward, and G. Weinreich, Phys. Rev. Lett. 9, 446 (1962).
- Tien et al. (1970) P. K. Tien, R. Ulrich, and R. J. Martin, Appl. Phys. Lett. 17, 447 (1970).
- Auston et al. (1984) D. H. Auston, K. P. Cheung, J. A. Valdmanis, and D. A. Kleinman, Phys. Rev. Lett. 53, 1555 (1984).
- Kleinman and Auston (1984) D. A. Kleinman and D. H. Auston, IEEE J. Quantum. Electron. 20, 964 (1984).
- Auston and Nuss (1988) D. H. Auston and M. C. Nuss, IEEE J. Quant. Electron. 24, 184 (1988).
- Hu et al. (1990) B. B. Hu, X.-C. Zhang, D. H. Auston, and P. R. Smith, Appl. Phys. Lett. 56, 506 (1990).
- Stevens et al. (2001) T. E. Stevens, J. K. Wahlstrand, J. Kuhl, and R. Merlin, Science 291, 626 (2001).
- Wahlstrand et al. (2002) J. K. Wahlstrand, T. E. Stevens, J. Kuhl, and R. Merlin, Physica B 316-317, 55 (2002).
- Afanasiev et al. (1999) G. N. Afanasiev, V. G. Kartavenko, and E. N. Magar, Physica B 269, 95 (1999).
- Frank and Tamm (1937) I. Frank and I. Tamm, Dokl. Akad. Nauk SSSR 14, 109 (1937).
- Tamm (1939) I. Tamm, J. Phys. 1, 439 (1939).
- Zrelov (1970) V. P. Zrelov, Cherenkov Radiation in High-energy physics (Israel Program for Scientific Translation, 1970).
- Stevens et al. (2002) T. E. Stevens, J. Kuhl, and R. Merlin, Phys. Rev. B 65, 144304 (2002).
- (25) Our usage of the terms superluminal and subluminal has been recently criticized [V. L. Ginzburg, Physics-Uspekhi, 45, 341 (2002)]. However, we believe that it is important to draw such a strong distinction between the two qualitatively different regimes, especially for nonlinear optics applications.
- Wu and Zhang (1996) Q. Wu and X.-C. Zhang, Appl. Phys. Lett. 68, 1604 (1996).
- Nahata et al. (1996) A. Nahata, A. S. Weling, and T. F. Heinz, Appl. Phys. Lett. 69, 2321 (1996).
- Koehl et al. (1999) R. M. Koehl, S. Adachi, and K. A. Nelson, J. Chem. Phys. 110, 1317 (1999).
- Gautier et al. (1996) C. A. Gautier, J. C. Loulergue, and J. Etchepare, Solid State Comm. 100, 133 (1996).
- Crimmins et al. (2002) T. F. Crimmins, N. S. Stoyanov, and K. A. Nelson, J. Chem. Phys. 117, 2882 (2002).
- Hebling (2002) J. Hebling, Phys. Rev. B 65, 092301 (2002).
- Hebling et al. (2002) J. Hebling, G. Almasi, I. Z. Kozma, and J. Kuhl, Opt. Express 10, 1161 (2002).
- Mooradian and Wright (1966) A. Mooradian and G. B. Wright, Solid State Commun. 4, 431 (1966).
- Gallot et al. (1999) G. Gallot, J. Zhang, R. W. McGowan, T.-I. Jeon, and D. Grischkowsky, Appl. Phys. Lett. 74, 3450 (1999).
- Barker et al. (1970) A. S. J. Barker, A. A. Ballman, and J. A. Ditzenberger, Phys. Rev. B 2, 4233 (1970).
- Pikhtin et al. (1976) A. N. Pikhtin, V. T. Prokopenko, and A. D. Yas’kov, Sov. Phys. Semicond. 10, 1224 (1976).
- Marple (1964) D. T. F. Marple, J. Appl. Phys. 35, 539 (1964).
- Leitenstorfer et al. (1999) A. Leitenstorfer, S. Hunsche, J. Shah, M. C. Nuss, and W. H. Knox, Appl. Phys. Lett. 74, 1516 (1999).
- Raptis (1988) C. Raptis, Phys. Rev. B 38, 10007 (1988).
- Albert et al. (1996) O. Albert, M. Duijser, J. C. Loulergue, and J. Etchepare, J. Opt. Soc. Am. B 13, 29 (1996).
- Boyd and Pollack (1973) G. D. Boyd and M. A. Pollack, Phys. Rev. B 7, 5345 (1973).
- Valdmanis et al. (1982) J. A. Valdmanis, G. Mourou, and C. W. Gabel, Appl. Phys. Lett. 41, 211 (1982).
- Koehl and Nelson (2001) R. M. Koehl and K. A. Nelson, J. Chem. Phys. 114, 1443 (2001).
- Bakker et al. (1998b) H. J. Bakker, G. C. Cho, H. Kurz, Q. Wu, and X.-C. Zhang, J. Opt. Soc. Am. B 15, 1795 (1998b).
- Gallot and Grischkowsky (1999) G. Gallot and D. Grischkowsky, J. Opt. Soc. Am. B 16, 1204 (1999).
- Afanasiev et al. (2000) G. N. Afanasiev, V. G. Kartavenko, and J. Ruzicka, J. Phys. A: Math. Gen. 33, 7585 (2000).
- Bakker et al. (1992) H. J. Bakker, S. Hunche, and H. Kurz, Phys. Rev. Lett. 69, 2823 (1992).
- Bakker et al. (1993) H. J. Bakker, S. Hunsche, and H. Kurz, Phys. Rev. B 48, 13524 (1993).
- Brennan and Nelson (1997) C. J. Brennan and K. A. Nelson, J. Chem. Phys. 107, 9691 (1997).
- Perry and Dougherty (1997) H. M. Perry and T. P. Dougherty, Phys. Rev. B 55, 5778 (1997).
- Bakker (1998) H. Bakker, Phys. Rev. B 57, 3167 (1998).
- Romero-Rochin et al. (1999) V. Romero-Rochin, R. M. Koehl, C. J. Brennan, and K. A. Nelson, J. Chem. Phys. 111, 3559 (1999).
- (53) Due to the complexity of the Cherenkov field pattern, extreme care must be taken in extracting damping from ISRS data. The values quoted are from measurements using a large transient grating, in which case spurious edge effects are minimized.
- Cheng et al. (1993) G. Cheng, B. Hennion, P. Launois, M. Xianlin, X. Binchao, and J. Yimin, J. Phys.: Condens. Matter 5, 2707 (1993).
- Schall et al. (2001) M. Schall, M. Walther, and P. Uhd Jepsen, Phys. Rev. B 64, 094301 (2001).
- Penna et al. (1976) A. F. Penna, A. Chaves, P. d. R. Andrade, and S. P. S. Porto, Phys. Rev. B 13, 4907 (1976).
- (57) J. K. Wahlstrand and R. Merlin, unpublished.
- Bakker et al. (1994) H. J. Bakker, S. Hunsche, and H. Kurz, Phys. Rev. B 50, 914 (1994).
- Qiu et al. (1995) T. Qiu, T. Tillert, and M. Maier, Opt. Commun. 119, 149 (1995).
- Schwarz and Maier (1998) U. T. Schwarz and M. Maier, Phys. Rev. B 58, 766 (1998).