How the shift of the glass transition temperature of thin polymer films depends on the adsorption with the substrate
Abstract
Recent experiments have demonstrated that the glass transition temperature of thin polymer films can be shifted as compared to the same polymer in the bulk, the amplitude and the sign of this effect depending on the interaction between the polymer and the substrate. A model has been proposed recently for explaining these effects in two limiting cases: suspended films and strongly adsorbed films. We extend here this model for describing the cross-over between these two situations. We show here how, by adjusting the strength of the adsorption, one can control the glass transition temperature of thin polymer films. In particular, we show that the shift of glass transition temperature, refered to that of a suspended film, varies like where is the adsorption energy per monomer and is the critical exponent for the mass of aggregates in the 2D percolation problem. We show also that the interaction leads to an increase of for as small as a few where is the thermal energy, and that this increase saturates at the value corresponding to strongly interacting films for adsorption energies of order .
pacs:
64.70.Pf Glass transitions, 61.41.+e Polymers, elastomers and plastics and 68.15.+e Liquid thin filmsI Introduction
When cooling a glass forming liquid, instead of freezing at some well defined temperature, one observes a huge increase of the viscosity which takes place continuously. Such glass formers can be either simple liquids or polymer liquids, and many features are similar in both regarding the glass transition. One defines the glass transition temperature as the temperature at which the dominant relaxation time on the molecular scale (or monomeric scale in the case of polymers) reaches about , which corresponds typically to a viscosity of in the case of simple liquids. Typically for such glass forming liquids, the viscosity increases by 12 orders of magnitude over a change of temperature of about down to . For reviews on the glass transition see e.g. ediger ; science . The underlying mechanisms involved in this dramatic increase are still poorly understood. One of the issue has long been to know whether the relaxation mechanisms take place on an increasing length scale when lowering the temperature adams . This issue lead to a huge interest in studying the glass transition in thin liquid films over the past ten years forrest3 . For practical reasons (film stability) these studies have been performed on thin polymer films. Indeed it has been demonstrated that the glass transition behaviour in thin polymer films is very different from that of the bulk. When considering a film deposited on a substrate with which the interactions are supposed to be very weak, Jones et al jones1 have shown that the glass transition temperature can be reduced by as much as for thick films. Numerous studies have confirmed this effect since then (see e.g. for1 ; for2 ; jones2 ; mattsson ; miyamoto ). In the case of polymers with radius of gyrations larger than the thickness of the film, Forrest and co-workers for1 ; for2 found even larger reductions, by as much as for thick films. In this manuscript we will consider only the case of shorter chains, with radius of gyration smaller than the thickness of the film. On the contrary many other experiments performed on strongly adsorbed films have shown that the glass transition temperature increases in this case wallace1 ; zanten1 ; grohens ; grohens2 ; grohens3 , sometimes by as much as for films thick. More generally, it has been demonstrated by various authors that both the sign and the amplitude of the shift depends on the interaction with the substrate nealey1 ; nealey2 ; russell ; green ; kremer2 . These experiments were performed by measuring the thermal expansivity of the films by ellipsometry jones1 ; jones2 ; wallace1 ; zanten1 ; grohens ; grohens2 ; grohens3 ; green or Brillouin light scattering for1 , by probing molecular dynamics using dielectric spectroscopy kremer2 ; miyamoto or by calorimetric measurements nealey1 ; nealey2 .
Note that these shifts are very important effects if one considers molecular relaxation times, or viscoelastic properties. For instance -according to the usual WLF law- a shift of of a few tens of Kelvins results in an increase (or decrease) of relaxation times by several orders of magnitude at a given temperature . The same polymer film is therefore expected to have fundamentally different viscoelastic properties depending on the substrate on which it is deposited. Note however that most measurements of shifts have been performed either by dilatometry (ellipsometry) or by dielectric measurements and are somehow indirect. More direct measurements by Atomic Force Microscopy have been reported e.g. in hammerschmidt ; tanaka ; sokolov , but brought conflicting results. Indeed, some studies have confirmed previous results hammerschmidt ; tanaka while another sokolov failed to reveal corresponding changes in the viscoelastic properties. However, even though experimental studies are still required to get a complete understanding of thin film behaviour, it is generally considered now that huge dynamical changes take place in thin films as compared to the bulk.
Another feature of glass transition which has been emphasized recently is the strongly heterogeneous nature of the dynamics close to spiess1 ; spiess2 ; ediger10 ; chamberlin ; richert1 ; otpdeta ; sillescu4 ; ediger1 ; ediger9 ; ediger2 ; ediger3 ; ediger12 ; ediger4 . This heterogeneous nature has been demonstrated by many experimental studies, using techniques such as NMR spiess1 ; spiess2 ; ediger10 , fluorescence recovery after photo-bleaching (FRAP) ediger1 ; ediger9 ; ediger2 ; ediger3 ; ediger12 ; ediger4 , translational and rotational probe diffusion sillescu4 ; otpdeta ; ediger9 , dielectric hole-burning chamberlin or solvation dynamics richert1 . These studies have demonstrated the coexistence of domains with relaxation time distributions spread over more than 3 to 4 decades at temperatures typically above . The characteristic size of these domains, measured by NMR spiess2 , is typically 2 to 4 nm in the case of van der Waals liquids and as small as 1 nm in glycerol ediger10 . Using a deep photo-bleaching technique, Ediger and co-workers have measured the life-time of these heterogeneities, which they found comparable and even larger than the dominant relaxation time ediger12 at temperatures below , while Spiess and coworkers spiess2 found both times to be comparable. For reviews on these issues, see e.g. sillescu ; ediger5 ; richert .
One of us recently proposed a model for the glass transition in the bulk, which allowed both to interpret thin film experiments, and to propose an explanation for the origin of the heterogeneous nature of the dynamics in the bulk long ; long2 , in the case of van der Waals liquids. We proposed that the glass transition in the bulk is controlled by the percolation of slow domains corresponding to upwards density fluctuations on the scale of a few nanometers. Note that the possible r le of density fluctuations had first been considered in references moynihan ; ediger8 and that the model proposed by Long et al can be considered as an extension of that proposed by Ediger. In the case of a suspended film, the glass transition occurs when the slow domains percolate in the direction parallel to the film, which requires a larger fraction of slow domains and results in a decrease of the glass transition temperature. In the case of films deposited on a substrate with which the interactions are strong, the glass transition occurs when both interfaces are connected with continuous paths of slow domains. This requires that the correlation length of the 3D percolation problem is comparable to the thickness of the film, which requires a smaller fraction of slow subunits as compared to the bulk glass transition. In both cases -suspended films and strongly interacting films- we predict a shift of the glass transition of the form
| (1) |
where is a number of order unity. The sign of is positive in the case of strongly interacting films (SI films) and negative in the case of suspended or weakly interacting films (WI films). is the critical exponent for the correlation length in 3D percolation. Note that the mechanism at work in the model proposed by Long and co-workers applies only for simple liquids, or short polymers, in that it does not predict molecular weight dependence of the shift such as those observed by Forrest and co-workers for1 ; for2 . Thereby we restrict our discussions below to the case of low molecular weight polymers, i.e. chains with radius of gyration smaller than the thickness of the film. Note that de Gennes degennes1 has proposed a mechanism at work in the case of large chains, which is not incompatible with the mechanisms described in long .
The aim of this paper is to describe the cross-over between the two extreme cases, and thereby to give a more precise meaning to the expressions“weakly interacting films” or “strongly interacting films”. The issue is: what is the strength of the polymer-substrate interaction required for observing an increase of the glass transition? Are typical adsorption interactions sufficient or is chemical grafting required? The paper is organized as follows. First (section II) we summarize briefly the model for the glass transition in van der Waals liquids proposed in long . Then in section III we re-discuss the glass transition in thin suspended films or in strongly interacting films. In section IV we discuss the cross-over between the WI case and the SI case precisely, and provide an expression of the energy scale of the interaction at the cross-over. We discuss our predictions (section V) and compare them to some recent experimental data (section VI). Note that in a joint paper sotta , we study in more details percolation properties in thin films in various situations corresponding to the physical cases studied here, and we perform Monte Carlo numerical simulations to illustrate and support our theoretical considerations.
II Model for the glass transition in van der Waals liquid
As mentioned in the introduction, it has been demonstrated over the past ten years that the dynamics is strongly heterogeneous close to the glass transition sillescu ; ediger5 ; richert . One of us long ; long2 proposed that the slow subunits correspond to upwards density fluctuations, and fast subunits to downwards density fluctuations. We introduced a density above which a microscopic domain of volume (to be defined below) is in a very high viscosity state, i.e. has a relaxation time of order , where e.g. is the time scale chosen for defining the glass transition. We proposed that the scale is determined by two competing relaxation processes: individual monomer jumps and the relaxation of the density of dense subunits in the more mobile neighbouring subunits by a diffusion process. The competition of these two processes results in the building up of the slowest relaxation process at an intermediate scale that we calculated to correspond to a number of about a few hundreds of monomers long2 , which corresponds to a characteristic length of 2 to 4 nanometers and to a volume of order a few typically ( is a typical monomer length), in agreement with experimental results. The probability distribution of the density of these small domains of volume is
| (2) |
where is the mean equilibrium density at temperature and is the bulk modulus. In our model, the glass transition is defined as the temperature at which subunits of volume and density larger than percolate. According to our model, the heterogeneous nature of the dynamics results from the strongly non-linear behavior of the dynamics as a function of close to . More generally, at any temperature , the viscosity is dominated by the characteristic time scale corresponding to the density , such that subunits of density equal or larger than percolate, that is
| (3) |
which reads
| (4) |
where is the reciprocal function of the error function defined by
| (5) |
Note that is positive for and negative for . is a 3D percolation threshold. Thereby, the dominant relaxation time in a mechanical experiment is . It coexists with much faster relaxation times which are not relevant for the viscosity long ; long2 . Knowing , one can calculate , using equation (4). If one considers for instance bond percolation on a FCC cubic lattice, one has . With the typical values and Pa, one obtains that is of order a few percent.
III Glass transition in thin suspended films and in films with strong interactions with their substrate
III.1 Glass transition in thin suspended films
Consider first a film of small thickness of order a few hundred Angstr ms, either freely suspended or deposited on a substrate with which interactions are weak. In the same way as for the glass transition in the bulk, for the thin polymer film to be in the glassy state, we assume that the viscous domains of volume and density larger than percolate. The percolation that is required is in the direction of the plane parallel to the film so as to build macroscopic clusters of slow dynamics. On the scale , the film has a finite number of layers in the direction normal to the film. For (which amounts to taking ), is of order a few tens. Then, as far as percolation is concerned, the situation is intermediate between a 3D and a 2D problem: we call it a quasi 2D problem. One can show sotta that the percolation threshold in a film with a finite number of layers is larger than the 3D percolation threshold and is given asymptotically by
| (6) |
where is a number of order unity ( for a cubic lattice), and is the critical exponent of the correlation length in 3D percolation. Thus, the cross-over between 2D and 3D is described by a power law and is wide. For the film to be in the glassy state, one needs a fraction of slow subunits, which is larger than that required in the bulk, . By calculations similar as those used to calculate , it has been shown in long that the relation between the temperature and the fraction of subunits of volume with density larger than is given by
| (7) |
where we have used the relations ( is the dimensionless thermal expansion coefficient) long . Since we consider only small differences for , this equation can be linearised to yield
| (8) |
with and . Writing equation (8) with , and using equation (6), one obtains the glass transition temperature of the film:
| (9) |
Note that we are using the notation here because is larger than and because is shifted downwards in this case (), as it is clear in equation (9). From this result, one deduces the shift:
| (10) |
which we can write also
| (11) |
with and is the monomer length (typically ). With , , sotta , stauffer and , one obtains that . In the case of polystyrene, for which , this leads to a decrease of of about for a film thick, which is in agreement with typical experimental results jones1 ; jones2 . One of the most important conclusion here is that the shift that we predict is long ranged. According to our model, the shifts measured e.g. in ellipsometric experiments such as in references jones1 ; for2 do not result from an average effect of strongly perturbed thin layers at the interfaces of the film: the “bulk” of the film itself has a lower , as given by equation (11).
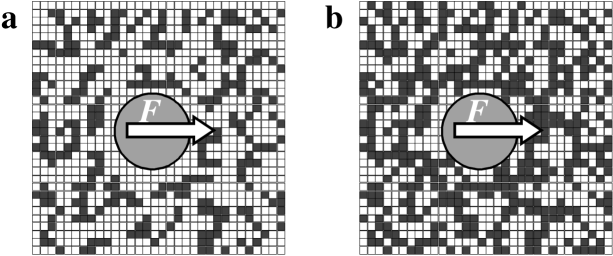
Fig.1 illustrates our model for the glass transition in thin suspended films. One can see from above a spherical body, with a radius larger than the thickness of the film. Both caps of the particle emerge from the film on each side. At a temperature higher than the slow aggregates of relaxation time may connect both surfaces, but they do not percolate in the direction parallel to the film. They build only finite clusters, which move freely in the film. The viscosity of the film is measured by pulling the spherical body. It is smaller here than the viscosity in the bulk and it is dominated by the slowest subunits which percolate in the direction parallel to the film. The measured viscosity of the film may be calculated from the shift that we calculated before :
| (12) |
where is given by equation (10) and is given by the corresponding WLF (or VFT) law of the considered liquid (remember that is higher than since is negative). The viscosity which dominates the motion of the body is that in the middle of the film, where it is the highest. Note that in a two layer model, in which the measured shift would result from an average between a fluid thin layer and an unperturbed “bulk” of the film, the viscosity of the film would be given by the viscosity of the bulk. Thereby, an experiment analogous to that proposed here (cf Fig.1), or an analogous one, is discriminating between our interpretation and that of the two layer model for2 ; jones2 . At the temperature (Fig. 1.b.) the slow subunits percolate in the direction parallel to the film and the film is at its glass transition: in order for the body to move, the slow subunits have to deform and reorganise. The viscosity of the film measured by pulling the body is thereby the same as that of the bulk at .
III.2 Glass transition in films with strong interactions with their substrates
Let us consider now a thin polymer film with strong interactions with the substrate, at a temperature . The correlation length of slow subunits, i.e. the size of slow aggregates is -where is the fraction of slow domains at temperature . If is sufficiently close to , i.e. if the temperature is not too far above , the size of slow aggregates is comparable to the thickness of the film. This means that there is a finite fraction of monomers from the free interface which are connected to the rigid substrate by continuous path of slow subunits. Then, the film is glassy. Indeed, consider a shear experiment between the two interfaces: there is a no-slip boundary condition on the upper interface, while the monomers are attached to the other: one needs therefore to deform slow aggregates which thereby control the viscosity of the film. The condition for being glassy reads then:
| (13) |
Thereby a fraction of slow subunits smaller than is required at the glass transition. It is given by
| (14) |
which results in an increase of given by
| (15) |
which we can write also:
| (16) |
where is analogous to , with a different pre-factor however. To illustrate our model, one may also adopt an equivalent point of view, by considering a semi-infinite polymer melt in contact with a strongly interacting substrate, at a temperature where is the glass transition temperature in the bulk. Monomers directly in contact with the substrate are immobilized. Then, one may ask: is the melt in a glassy state in the vicinity of the substrate? If yes, what is the range of this effect? We argue that at a distance smaller or comparable to the 3-D percolation correlation length -where is the fraction of slow domains at the temperature -, a finite fraction of monomers are connected to the substrate by continuous paths of slow dynamics domains. Then, these monomers will control the dynamics at the distance , as a consequence of the strong adsorption. Indeed, without adsorption, the continuous path may move freely within the melt since . Then, the polymeric liquid is glassy within a distance to the substrate given by
| (17) |
with is of order one monomer length, i.e.
. Note that at about , the distance can be
a few tens of nanometers. We have just emphasized that the effects
we predict are long ranged. Indeed our model predicts a shift of
given by a power law as a
function of the distance to the interface. In particular, we argue
against the interpretation proposed by some authors (see e.g.
mattsson ) according to which the measured shifts result from an
average effect, between strongly perturbed thin interfacial layers
and an essentially unperturbed “bulk” of thin films. This point
is essential when one considers viscoelastic properties of thin
films hammerschmidt ; tanaka ; sokolov or of filled materials
landel ; edwards ; berriot .
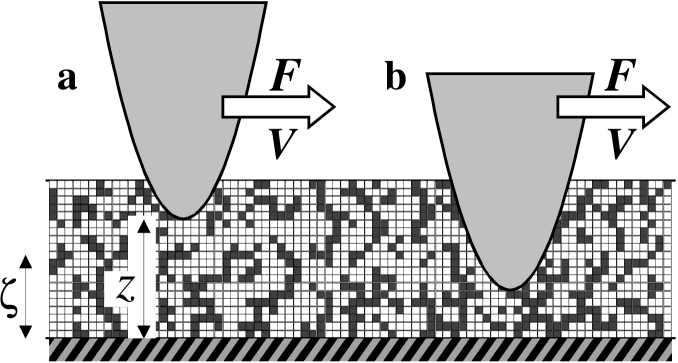
The case of a SI film is schematised on Fig. 2. Let us consider here a body, such as the tip of an AFM, penetrating in the film, within a distance to the substrate. We suppose that the interactions between the tip and the polymeric liquid are weak, whereas they are strong between the liquid and the substrate. There is indeed a no slip boundary condition on the surface of the tip, whereas the monomers in the aggregates are attached to the substrate. At a temperature larger than , and at a distance larger than the size of the slow aggregates, the viscosity controlling the motion of the AFM tip is smaller than that at . Indeed, at this distance, the slow aggregates move freely in the film and can move away rigidly to open a path for the tip. When the tip gets closer to the substrate, the viscosity increases (Fig. 2.b). Indeed, at distances smaller than , the AFM tip has to deform the slow aggregates in order to move parallel to the film. More precisely, the viscosity measured by the probe is then:
| (18) |
where is given by equation (15) and is the distance to the substrate (here , so that ). Note the difference between the no slip boundary condition at the surface of the tip (if interactions between the tip and the monomers are weak) and the fact that the monomers on the substrate are attached. That latter condition is much more restrictive. A no slip boundary condition allows the monomers in contact with the tip to be renewed, which is not the case for the monomers in contact with the substrate if they are attached. For instance, if there was no specific interaction between the monomers and the substrate, one would have a no slip boundary condition also at the film-substrate interface. Then the slow aggregates encountered by the tip (Fig. 2.b) could rotate and reorganise within the film. According to our model, this difference results in the huge difference in viscosity between the cases of suspended films and SI films, as illustrated by equations (12) and (18). More precisely, the viscosity of the film can be calculated using equation (18) and the bulk WLF law (or VFT law in the context of simple liquids) ferry ; handbook :
| (19) |
and are two constants which depend on the considered polymer. The viscosity at , is typically of order in the case of simple liquids. In the case of polymeric liquids, it is more appropriately defined a monomeric jump time of order ferry ; handbook . Close to , the slope of is very large, such that an increase of of results in an increase of the viscosity up to 3 or 4 orders of magnitude depending of the liquids. When compared to the opposite case of a WI film, the same polymer films at the same temperature can have viscosities which differ by more than 6 or 7 orders of magnitude depending on their substrates.
IV Adsorbed polymer film
We have just seen that when the film-substrate interaction is strong, the film is glassy when the size of the aggregates of slow subunits is comparable to the thickness of the film. This occurs when the correlation length of the 3D percolation problem is comparable to the thickness of the film. The main point is that the monomers in contact with the substrate are “attached”. As a consequence, a probe which moves within the film deforms slow aggregates, which thereby control the viscosity of the film. However, when the interactions with the substrate are finite, a monomer remains anchored on the substrate during a finite time. Thus the issue is: which interaction strength is required for the film to be glassy, or can we calculate the shift as a function of the interaction strength? Are typical adsorption interactions sufficient for inducing an increase of ? Let us define as the adsorption energy of one monomer with the substrate. If one could remove a monomer independently of the other ones, the life-time of monomer adsorption on one site would be:
| (20) |
where is a microscopic time of typical order of magnitude . For the film to be in the glassy state, the time must be at least equal to . However, typical adsorption energies are of order a few at most, which is far from required.
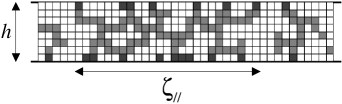
However, one must consider the number of monomers which must be removed collectively on the time scale . These are the ensemble of monomers which belong to the same aggregate of slow subunits and which are in contact with the substrate. One can see such an aggregate on Fig. 4. We call the number of such monomers. On a time scale smaller than , such an aggregate must be considered to be rigid. The time scale for removing such an aggregate from the substrate is therefore
| (21) |
where is the fraction of monomers in contact with the substrate which are adsorbed. In a first approach, this function can be considered to be of order unity and shall be omitted in the following. Of course equation (21) holds as long as the r.h.s is smaller than , since the aggregate does not persist on longer time scales. This equation breaks down at low when the quantity is smaller than one. Then the time for removing the aggregates must be considered to be equal to . Now, when considering equation (21), one can understand why typical adsorption energies are sufficient for increasing the glass transition temperature of thin films. Indeed, when the size of the aggregates is comparable to the thickness of the film, the number is at least equal to , which is the number of monomers on one interface of a slow subunit. Then, this number is of order a few tens, which can be sufficient for being comparable to , depending on the adsorption energy .
Let us describe now in more details the glass transition mechanism that we propose for thin films deposited on a substrate with interaction energy per monomer. First let us note that the relevant temperature range is
| (22) |
where and are the glass transition temperatures of a freely suspended film and of a strongly adsorbed film and are given by equations (11) and (16) respectively. Indeed for a film is fluid whatever the interactions with the substrate according to previous discussions. For a film is glassy, even if the interactions with the substrate vanish, as in the case of suspended films. In terms of the fraction of slow aggregates, this temperature range corresponds to:
| (23) |
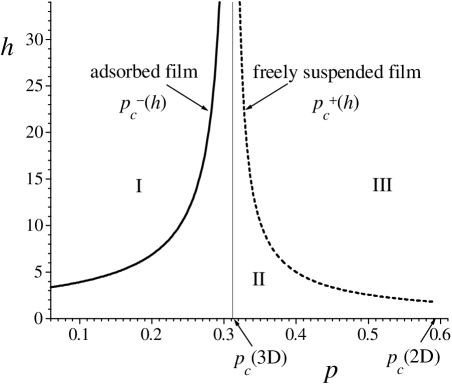
where is given by equation (6) () and is larger than , and is smaller than and is given by equation (14). Both curves and are shown in Fig. 3. Both quantities correspond to a correlation length for the 3D percolation problem comparable to the thickness of the film. One () is below the percolation threshold (case of strongly adsorbed film), the other one () is above the percolation threshold (case of a suspended film).
Let us start from the fluid state at . By lowering the temperature below (i.e. by increasing above ), the size of the aggregates increases and they attain a lateral extension larger than the thickness of the film: one enters the cross-over between 2D and 3D percolation. One can see such an aggregate on Fig. 4. We show in sotta that this quasi-2D percolation problem with probability of occupation and mesh size can be mapped, using a coarse-graining function , into a 2D problem of mesh size and probability of site occupation with . is the number of iterations for transforming the film of thickness on the scale () into a 2D lattice of mesh size . Using this procedure, one can demonstrate that the mass of an aggregate is sotta :
| (24) |
where the mass is given in unit of cubes of size in the renormalised system. On the other hand, the correlation length (expressed in the renormalised system, i.e. in units of ) is:
| (25) |
where as a function of is given in equation (6). All these relations hold within a pre-factor of order unity which can be measured by numerical simulations sotta . The exponents and are the 2D critical exponents for the correlation length and for the mass of the aggregates, respectively. In units of mesh size , the mass reads
| (26) |
where is the anomalous exponent of the 3D correlation function of the percolation problem. In physical unit length, the correlation length parallel to the film reads
| (27) |
Note that the above result insures that for , i.e. when the correlation length is equal to the thickness of the film, the size of the aggregates is equal to as it should be. From equations (24) and (26), one deduces that the number of monomers from one aggregate in contact with the substrate is (within a pre-factor of order unity)
| (28) |
where is the number of monomers on the interface of a subunit of size . Equations (24), (26-28), together with equation (8) which gives the variation of as a function of the temperature, and (6) giving , provide the variation of the mass of the aggregates, of the correlation length parallel to the film, and of the number of monomers from one aggregate in contact with the substrate, as a function of the temperature, for . At , all these quantities diverge. From equations (21) and (28), one can calculate the time for removing an aggregate from the substrate. At the glass transition temperature of the film, this time must be equal to , which reads
| (29) |
This yields
| (30) |
This equation gives the fraction of slow subunits in the film at the glass transition as a function of the interaction energy . The glass transition temperature of the film is then obtained using equation (8) which relates the fraction of slow subunits and the temperature: , where is positive. Using the relation , where is the shift of thin suspended films, one obtains
| (31) |
or, using equation (10):
| (32) |
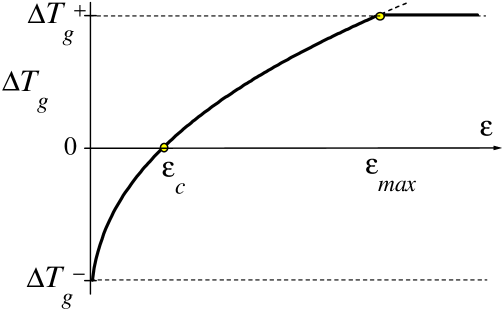
This equation describes the cross-over between a suspended film and a film with strong interaction with its substrate, as a function of the adsorption energy per monomer . At low values of , one recovers the shift of suspended films, by setting in the above equation. For strong interactions, the shift given by equation (32) is valid as long as it is smaller than , i.e. as long as the correlation length is larger than . Equation (32) must be considered as leveling off at when increasing . Indeed, consider a system for which can be tuned. At , the shift of is negative. The lateral size of the aggregates is infinite. When increasing , the glass transition temperature increases. At , the shift cancels. At larger value, the shift of is positive. The lateral size of the slow aggregates has decreased but is still so large that the number of monomers of one aggregate in contact with the substrate is large enough for the desorption time of the aggregate to be equal to . In this regime the lateral size is still larger than the thickness of the film. At some value , the glass transition temperature corresponds to a 3D size of the aggregates comparable to . Then, increasing further the adsorption energy does not increase further the glass transition temperature since it would correspond to a correlation length much smaller than the thickness of the film. This plateau value is reached when is a few as given below, and the corresponding shift is equal to . In any case our model predicts:
| (33) |
The interaction can be considered to be strong when
| (34) |
The interaction is weak, and the situation of the film is equivalent to that of a suspended film when
| (35) |
Thereby, the cross-over between a freely suspended and a strongly interacting film of thickness is given by
| (36) |
With , is of order a few tens. The time scale chosen for the glass transition is , which means that the quantity typically. With for instance and , one obtains then
| (37) |
This value for the interaction per monomer can be considered to be typical at the cross-over between negative shift of and positive shift of . Expressed in terms of the interaction energy between the substrate and the polymer melt, one obtains mJ/m2. Note that the thicker is the film, the sharper is the transition between the two regimes (WI films and SI films), but the smaller () the amplitude of the effect. One can write equation (32) as:
| (38) |
to emphasize that increases like in the crossover region, a relation which may perhaps be tested experimentally. The glass transition temperature as a function of the interaction per monomer is plotted on Fig. 5. Finally, the shift can be written as a function of the thickness of the film and of the interaction energy as:
| (39) |
in which is the negative shift in a non-adsorbed film (cf equation (11)). The crossover value contains itself a dependence and is given by equation (36). Equation (39), together with equations (11) and (36), is the main result of this manuscript.
As already discussed, equation (39) levels off at so that the shift is equal to in the regime of strong adsorption. One has thereby
| (40) |
The ratio is the ratio of the shift between the case of suspended films and that of strongly adsorbed films. Experimental data show that the typical shifts for thick films are and in these respective cases. With stauffer , one obtains , or given our prediction for for a film thick, we obtain
| (41) |
which, expressed in adsorption energy per unit area, corresponds to about . Considering the respective values of and , one sees indeed that observing a negative shift of in a film deposited on a rigid substrate requires very well controlled surfaces, with very low interactions between the substrate and the monomers.
V Discussion
At this point, let us discuss some important aspects of the glass transition in thin films that can be deduced from our model. First, let us emphasise here that our assumption is that the local dynamics on small scale is the same in the bulk and in thin films. The change of dynamical properties between both situations take place on larger scale due to percolation mechanism, which differ between the bulk and thin films. This assumption is underpined by the fact that the statistics are the same between both cases: the perturbations of the thermodynamics due to the presence of interfaces is short ranged long and do not extend beyond or .
An important consequence of our model is that the measured shift of should depend on the type of technique used for measuring the dynamics. This a consequence of the heterogeneous nature of the dynamics. The modification of the dynamics in thin films as respect to the bulk might be different for instance when considering viscoelastic properties and the diffusion of probes, as it has already been observed in the bulk, as a function of temperature otpdeta ; sillescu4 ; ediger1 ; ediger9 . Note that the size of the probe plays a crucial r le at this respect long2 . We expect also that the shift measured e.g. by NMR experiments, if any, should be different as that measured by mechanical experiments. Indeed, in a mechanical experiment as described in this manuscript, one probes only a part of the dynamical spectrum (as defined by equation (3)), according to the model proposed in long ; long2 , whereas a NMR experiments probes a more local environment.
However, the shift should also depend, for a given technique, of some precise aspects of the experiment. For instance, we argued that a suspended film is more fluid when considering pulling a probe in the film, while for the same experiment we expect a strongly adsorbed film to be more viscous. Consider now an experiment in which one shears the film between two rigid substrates, which have no interaction with the considered liquid. Then, the shift should be different from that measured by pulling the probe and discussed in this paper. Indeed even at temperatures above , the slow aggregates are strongly anisotrope and are very elongated in the direction parallel to the film, if is not too far above . Then, in a shearing experiment as discussed here, one needs to deform them given the no-slip boundary condition. Some dilatancy is also expected, depending on the shearing rate. In other words, we expect the viscosity of the film to be strongly anisotropic.
Another issue is a more precise calculation of . Indeed, our result here (equation (15)) has been obtained only within a pre-factor, assuming the relation , so that a fraction of order one of slow subunits on one interface are connected to the other interface by a slow aggregate. But we did not specify the value of this fraction. Thereby, the pre-factor in equation (15) must be considered to be an adjustable parameter, which we choose to be consistent with a shift of about K for strongly interacting films of thickness nm, which is close to experimental results wallace1 ; grohens ; grohens2 . For the type of experiments discussed here (e.g. probe motion, Fig. 1 and Fig. 2), the viscosity of the suspended film is controlled by the slowest percolating subunits, leading to an equation analogous to equation (3) with instead of . The percolation threshold in the direction parallel to the film is a well defined state, which is also the case in the bulk. It allows thereby to calculate the shift of between suspended films and the bulk as corresponding to the shift of the percolation threshold. In particular we expect the glass transition in thin suspended film as discussed here to be similar to that in the bulk. The situation of strongly adsorbed film is very different. The fraction of slow subunits at the free interface connected to the lower interface is never zero, but decays exponentially with the thickness of the film: the percolation between both interfaces is not a well defined state, but occurs continuously. In addition to the broad distribution of relaxation times already present in the bulk and in thin films, this fact tends to increase the width of the glass transition, as compared to the bulk or as compared to suspended films. This fact might be observed experimentally. For our purpose here, it makes a calculation of the shift more involved, as it requires a more precise model as that presented here for calculating the viscosity of the film as a function of the statistics of the slow aggregates.
VI Comparison with experimental results
We have described in this paper a mechanism which leads to a shift in thin polymer films. This shift depends on the film thickness and it can be either positive or negative depending on the interaction between the monomers and the substrate. Two limiting cases must be considered when dealing with equation (39): 1) the case of very weak interactions. Then, the shift is negative and equal to . The variation of as a function of is then given by a power law . 2) the case of strong interactions. When increasing , equation (39) must be considered as leveling off when becomes larger than which is a few tens of , so that the shift saturates at . This is a direct consequence of the model proposed here. Increasing indefinitely the interaction energy does not change the shift. In the strong interaction limit, the shift is equal to and has the same power law dependence on : . In the crossover region, the shift is a function of both and . Since itself depends on , the shift is not exactly a power law of in this regime and the complete equation (39) must be used to fit the data. When considering experimental results, one needs thereby to check whether one deals with one of the two limiting case, or whether the system is in the cross-over in between. Let us now discuss some experimental data regarding the shift of on various substrates and conditions within this framework.
Kawana and Jones jones2 have reported various measurements of the glass transition temperature of polystyrene (PS) films deposited on silicon wafers by spin coating, as a function of the thickness of the film. is measured from thermal expansivity curves obtained by ellipsometry. In these experiments, is shifted downwards, which corresponds to a case where the interactions between the polymer film and the substrate are weak. The data were fitted using the empiric relation
| (42) |
with a best fit value . This value is indeed very close to our prediction (eq(11)). However, the dispersion of the data is too large for discriminating precisely the value of this exponent. The amplitude of the observed shifts corresponds to a length nm. We shall compare this value to our prediction for a film on a non-adsorbing substrate:
| (43) |
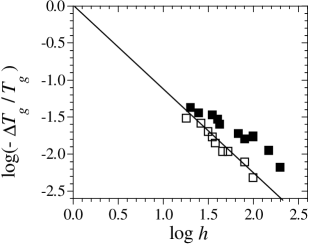
with . The values , , , , nm give nm, which is in remarkable agreement with the measured value. Our prediction is thereby in quantitative agreement with Kawana and Jones data, and we conclude that their experiments correspond indeed to the case of a non-interacting film, for which the effect of the interactions with the substrate is negligible. We retain here that the typical shift for a non-interacting film of thickness nm is about K (for a bulk of the order 375 K), or about K at nm.
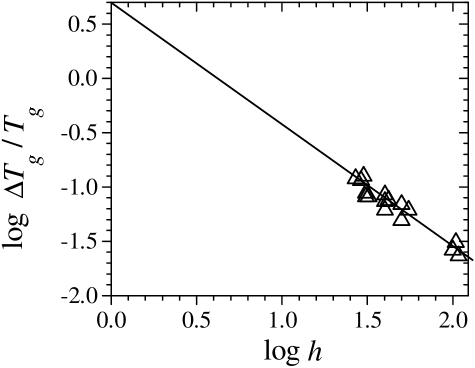
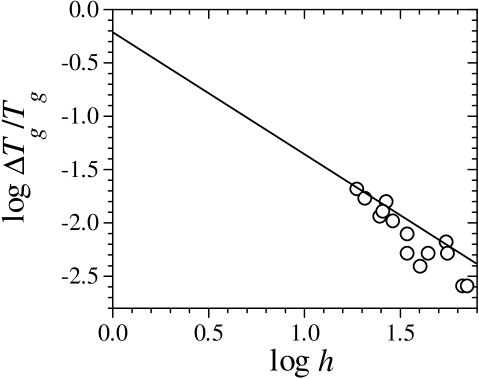
Hartmann et al kremer2 have reported dielectric measurements in isotactic poly(methyl methacrylate) (i-PMMA) deposited on aluminium electrodes evaporated on glass substrates, which show a decrease of as decreases. The shift is of the order K for nm, which in this case also coincides with the value mentioned above for a negligibly interacting film (with here of the order K). We deduce thereby that in that case the interactions were indeed negligible. In another series of experiments, they have also performed ellipsometric measurements in i-PMMA deposited on silica wafers, which show an increase of as decreases. This apparent contradiction is interpreted as due to a difference in the polymer-substrate interaction strength, because the experiments have been performed on different substrates. Hartmann et al interpreted these measurements in terms of a model by Herminghaus herminghaus , which gives an expression for the shifts as a function of the ratio ( the surface tension, the Young’s modulus of the polymer at ). However, within Herminghaus model, only decreases of are predicted, disregarding of the polymer-substrate interaction. Changing the sign of the shift as predicted by Herminghaus for interpreting Hartmann and co-workers experiments is thereby an unsubstantiated extension of this model long3 . On Fig. 6 we plotted Hartman and al’s results obtained by dielectric measurements, for two different molecular weights. The straight line represents the extrapolation of the data according to equation (43), with a slope . The data are compatible with this slope, even though they are also not precise enough to test this exponent. The ordinate at gives the coefficient nm. Equation (39) of the present paper provides an explicit dependence of the shift as a function of the interaction strength in which is the negative shift obtained for a non-interacting film. As discussed above, the crossover value contains itself a dependence (cf equation (38)) and in this regime, the shift is not precisely a power law. Nevertheless, if the -dependence in is neglected in equation (39), the intersection of the solid line in Fig. 7 with the ordinate axis provides the pre-factor of equation (39), i.e. , or , that is -assuming , i.e. nm. From that we deduce that these experiments have been performed in the regime of strong interactions. In Fig. 7) we have indicated the slope which fits reasonably well the data. Fryer and co-workers nealey2 have measured the shift of PMMA films of various thicknesses deposited on silicon oxide, using a thermal probe technique. Here also, positive shifts have been reported, which correspond thereby to non-negligible interactions between the polymer film and the substrate. However, the positive shift here is not as large as in the previously discussed case. In Fig. 8), the ordinate at gives , that is (with nm). We are thus here in an intermediate regime, where the ratio is not very large with respect to one. Therefore the variation of versus should be better described using the exact equation (39). However, in the above discussion, the data have been extrapolated using the power law . Indeed, the data are not precise enough and the range is too small to discriminate the strong adsorption limit and the cross-over regime, as far as the variation of versus is concerned. The amplitude of the shift, however, allows for this discrimination. In another series of experiments, Fryer et al nealey1 have measured the shift in PS and PMMA films deposited on substrates with tuned interfacial energy. This was achieved by using as substrates octadecyltrichlorosilane (OTS) films deposited on silicon wafers and exposed to various doses of X-Rays. The authors claim that, at a given thickness, the shift varies linearly with the interfacial energy , which at first sight may seem in apparent contradiction with our prediction (equation (39)). However, we stress that the adsorption energy and the interfacial energy are two different quantities, and that the relation between these two parameters is not straightforward nealey1 ; isr . Nevertheless, the data published by Fryer and co-workers offer the opportunity to estimate the ratio using our model in the different cases considered in nealey1 .
| Polymer | (mJ/m2) | ||
|---|---|---|---|
| PS | 0.8 | -8 | 0.02 |
| PS | 1.7 | -4 | 0.3 |
| PS | 6.5 | +30 | 27 |
| PMMA | 0.5 | -8 | 0.02 |
| PMMA | 1.3 | -5 | 0.2 |
| PMMA | 3.3 | +11 | 6 |
For each polymer (PS or PMMA), a series of results obtained for 3 different thicknesses are presented, for 3 values of the interfacial energy (obtained by an X-Ray irradiation with 3 different doses). The thickness-dependent shift is either negative or positive, according to the interfacial energy. The value at the crossover is obtained as the point where on each curve versus , for each given thickness . It is observed that all curves (obtained for various values) intersect at a point of coordinates , mJ/m2. In terms of interfacial energy , the crossover should therefore correspond roughly to the value . Note however that the surface tension is not the relevant parameter for describing the strength of the interaction as far as the shift is concerned: the relevant paremeter is the adsorption energy per monomer. More precisely the relation between the shift and depends on the considered substrate and polymeric liquid. We expect only the relation between and the adsorption energy to be universal as given by equation (39). Using equation (39), and by taking , one can deduce the ratio . The results are summarised in Table I. One can see there that the regime of strong interaction is reached when . Note that the shift of for a film thick is in the plateau regime. Thereby, our estimate here of is an underestimate, and the real adsorption energy might be higher.
VII Conclusion
In conclusion, we have proposed here a model for calculating the shift of thin polymer films, as a function of the adsorption energy between the polymer and the substrate. We show also how to calculate the corresponding viscosity of the film using the bulk WLF law with the corresponding temperature shift. Our prediction could be tested directly by pulling a tip immerged in the film, such as an AFM tip, or a probe pulled using an optical tweezer for instance. As a consequence of this model, we expect the viscosity of a suspended film to be strongly anisotropic. For instance, the viscosity measured by shearing the film between two susbtrates (without interaction) should be much larger than that measured by pulling the probe as discussed in this paper. Such experiments could be performed in the two limiting cases of non-interacting films and strongly interacting films, and also in the cross-over regime of intermediate adsorption energy. However, testing our general relation quantitatively would require a precise knowledge of the interaction between the monomers and the substrate. Finally, our prediction of long ranged changes of viscoelastic properties should be of importance for explaining the reinforcement of filled materials such as filled elastomers landel ; edwards ; berriot and should help in tailoring their properties by adjusting the adsorption energy between the particles and the matrix.
References
- (1) Adam G. and Gibbs J.H., J.Chem.Phys, 43 (1965) 139
- (2) Ediger M.D., Angell C.A. and Nagel S.R., J.Phys.Chem, 100 (1996) 13200
- (3) Review articles in Science, 267 (1995) 1924
- (4) Forrest J.A., EPJ E, 8, (2002) 261
- (5) Keddie J.L., Jones R.A.L., and Cory R.A., Europhys. Lett., 27 (1994) 59
- (6) Forrest J.A., Dalnoki-Veress K., Stevens J.R. and Dutcher J.R., Phys. Rev. Lett., 77 (1996) 2002 Phys. Rev. Lett., 77 (1996) 4108
- (7) Kawana S. and Jones R.A.L., Phys. Rev. E., 63 (2001) 021501
- (8) Dalnoki-Veress K., Forrest J.A., Murray C., Gigault C., Dutcher J. R., Phys. Rev. E., 63 (2001) 031801
- (9) Mattsson J., Forrest J.A. and B rjesson, Phys. Rev. E., 62 (2000) 5187
- (10) Fukao K. and Miyamoto Y., Phys. Rev. E., 61 (2000) 1743
- (11) Wallace W.E., van Zanten, J.H. and Wu W.L., Phys.Rev.E., 52 (1995) R3329
- (12) van Zanten J.H, Wallace W.E. and Wu W.L., Phys. Rev. E., 53 (1996) R2053
- (13) Grohens Y., Brogly M., Labbe C., David M.-O. and Schultz J., Langmuir, 14 (1998) 2929
- (14) Carriere P., Grohens Y., Spevacek J. and Schultz J., Langmuir, 16 (2000) (5051)
- (15) Grohens Y., Hamon L., Reiter G., Soldera A. and Holl Y., EPJ E, 8 (2002) 217
- (16) Hartmann L., Gorbatschow W., Hauwede J. and Kremer F., Eur. Phys. J E, 8 (2002) 145
- (17) Fryer D.S., Peters E.J., Kim J.E., Tomaszewski J.E., de Pablo J.J., Nealey P.F., White C.C. and Wu W., Macromolecules, 34 (2001) 5627
- (18) Fryer D.S., Nealey P.F. and de Pablo J.J., Macromolecules, 33 (2000) 6439
- (19) Pham J.Q. and Green P.F., J. Chem. Phys., 116 (2002) 5801
- (20) Tsui O.K.C., Russell T.P. and Hawker C.J., Macromolecules, 34 (2002) 5535
- (21) Ge S., Pu Y., Zhang W., Rafailovich M., Sokolov J., Buenviaje C., Buckmaster R. and Overney R.M., Phys. Rev. Lett., 85 (2000) 2340
- (22) Tanaka K., Takahara A. and Kajiyama T., Macromolecules, 33 (2000) 7588
- (23) Hammerschmidt J.A., Gladfelter W.L. and Haugstad G., Macromolecules, 32 (1999) 3360
- (24) Schmidt-Rohr K. and Spiess H.W., Phys. Rev. Lett., 66 (1991) 3020
- (25) Tracht U., Wilhelm M., Heuer A., Feng H., Schmidt-Rohr K. and Spiess H.W., Phys. Rev. Lett., 81 (1998) 2727
- (26) Reinsberg S.A., Qiu X.H., Wilhelm M., Spiess H.W. and Ediger M.D., J. Chem. Phys., 114 (2001) 7299
- (27) Schiener B., B hmer R., Loidl A. and Chamberlin R.V., Science, 274 (1996) 752
- (28) Richert R., J. Chem. Phys., 113 (2000) 8404
- (29) Fujara F., Geil B., Sillescu H. and Fleischer G., Z.Phys.B., 88 (1992) 195
- (30) Chang I., Fujara F., Geil B., Heuberger G., Mangel T. and Sillescu H., J. Non-Cryst. Solids, 172-174 (1994) 248
- (31) Cicerone M.T., Blackburn F.R. and Ediger M.D., Macromolecules, 28 (1995) 8224
- (32) Wang C.-Y. and Ediger M.D., Macromolecules, 30 (1997) 4770
- (33) Cicerone M.T., Wagner P.A. and Ediger M.D., J. Phys. Chem.B, 101 (1997) 8727
- (34) Wang C.-Y. and Ediger M.D., J. Phys. Chem.B, 103 (1999) 4177
- (35) Wang C.-Y. and Ediger M.D., J. Chem. Phys., 112 (2000) 6933
- (36) Hwang Y., Inoue T., Wagner P.A. and Ediger M.D., J. Polym. Sci., Part B: Polymer Physics, 38 (2000) 68
- (37) Sillescu H., J. Non-Cryst. Solids, 243 (1999) 81
- (38) Ediger M.D., Annu. Rev. Chem. , 51 (2000) 99
- (39) Richert R., J. Phys.: Condens. Matter, 14 (2002) R703
- (40) Long D. and Lequeux F., EPJ E, 4 (2001) 371
- (41) Merabia S. and Long D., EPJ E, 9 (2002) 195
- (42) Moynihan C.T. and Wang J.-H., Mater. Rec. Soc. Symp. Proc., 455 (1997) 133
- (43) Ediger M.D., J. Non-Cryst. Solids, 235-237 (1998) 10
- (44) De Gennes P.-G., Eur.Phys. E, 2 (2000) 201
- (45) Sotta P. and Long D. submitted EPJ E (2002)
- (46) Stauffer D. and Aharony A., Introduction to percolation theory (Taylor and Francis, London) 1994
- (47) Nielsen L.E. and Landel R.F., Mechanical Properties of Polymers and Composites (Marcel Dekker, New York) 1994
- (48) Edwards D.C., J. Mater. Sci., 25 (1990) 4175
- (49) Berriot J., Mont s H., Lequeux F., Long D. and Sotta P., Macromolecules , 35 (2002) 9756
- (50) Ferry J.D., Viscoelastic properties of polymers (John Wiley and Sons, Inc.) 1980
- (51) Mark, J.E., Physical Properties of Polymers Handbook (American Institute of Physics) 1996
- (52) Herminghaus S., EPJ E, 8 (2002) 237
- (53) Long D., EPJ E, 8 (2002) 245
- (54) Israelachvili J.N. Intermolecular and Surface Forces (Academic Press, London) 1992
VIII Figures