Phonons in supercooled liquids: a possible explanation for the Boson Peak
GlassesAngell95 ; DeBenedetti01 are amorphous solids, in the sense that they display elastic behaviour. In crystals, elasticity is associated with phonons, quantized sound-wave excitations. Phonon-like excitations exist also in glasses at very high frequencies (THz), and they remarkably persist into the supercooled liquidSette98 . A universal feature of these amorphous systems is the Boson peak: the vibrational density of states has an excess over the Debye (squared frequency) law, seen as a peak in . We claim that this peak is the signature of a phase transition in the space of the stationary points of the energy, from a minima-dominated phase (with phonons) at low energy to a saddle-point dominated phaseAngelani00 ; Broderix00 ; Grigera02 (without phonons). Here, by studying the spectra of inherent structuresStillinger95 (local minima of the potential energy), we show that this is the case in a realistic glass model: the Boson peak moves to lower frequencies on approaching the phonon-saddle transition and its height diverges at the critical point. The numerical results agree with Euclidean Random Matrix TheoryMezard99 predictions on the existence of a sharp phase transitionJPHYS02 between an amorphous elastic phase and a phonon-free one.
Vibrational excitations of glasses in the THz region, and the related vibrational density of states (VDOS), play a crucial role in their thermodynamic properties Phillips . Recent results suggest that the VDOS is determined by the properties of the potential energy landscape Stillinger95 (PEL), a crucial tool to understand the slow dynamics of supercooled liquids DeBenedetti01 . Indeed, the VDOS and the dynamic structure factor can be qualitatively reproduced from the (harmonic) vibrational spectrum obtained from the diagonalization of the Hessian matrix of the potential energy evaluated at the minima (or inherent structures [IS]) of a Lennard-Jones system Ruocco00 . The same numerical procedure led to quantitative agreement with inelastic X-ray scattering experiments in amorphous silica (O. Pilla et al., preprint condmat/0209519). Here we will show that a Boson peak must be present in the VDOS as a consequence of the PEL geometry, and make quantitative predictions which can be checked fastly quenching supercooled liquids below their glass temperature.
The high-frequency (– THz) excitations have been experimentally shown to have linear dispersion relations Sette98 ; Masciovecchio96 ; Matic01 ; Masciovecchio97 ; Benassi96 ; Fioretto99 ; Pilla00 in the mesoscopic momentum region (– nm-1). Although clearly not plane waves, they are highly reminiscent of phonons because they propagate with the speed of sound and because the VDOS, , is Debye-like () at low enough frequency. These excitations have in fact been dubbed “high-frequency sound” and a coherent theoretical picture of their properties was obtained JPHYS02 ; Martin01 ; Grigera01 using Euclidean Random Matrix Theory Mezard99 (ERMT).
However, there is more to the low frequency VDOS of glasses than the Debye law. A characteristic feature is that the VDOS departs from the Debye form, displaying an excess of states, which has been named “Boson peak” (BP). As observed in many materials Sette98 ; Masciovecchio96 ; Matic01 ; Masciovecchio97 ; Benassi96 ; Fioretto99 ; Pilla00 , the BP is in a region of frequencies where the dispersion relation for phonons is still linear ( a few THz). Several non-equivalent ways of experimentally defining the BP have been introduced. One approach defines it as a peak in Raman-scattering data, another as a peak in the difference between the VDOS of the glass and the corresponding crystal. Other authors extract from their neutron scattering data and look for a peak in . This is the definition we adopt, since we believe it unveils universal properties of glasses.
The origin of the Boson peak can be understood if we consider the ensemble of generalized inherent structures (GIS): for each equilibrium configuration the associated GIS is the nearest stationary point of the Hamiltonian. If we start from an equilibrium configuration at low temperature, the GIS is a local minimum, and it coincides with the more frequently used IS (i.e. the nearest minimum of the Hamiltonian). On the contrary, if we start from high temperature, the GISs are saddle points. In the GIS ensemble there is a sharp phase transition separating these two regimes. It takes place in glass-forming liquids Angelani00 ; Broderix00 ; Grigera02 at the Mode Coupling temperature Goetze92 ; Kob95 (), above which liquid diffusion is no longer ruled by rare “activated” jumps between ISs but by the motion along the unstable directions of saddles. Phonons are present in the spectrum of the VDOS in the low temperature phase (IS dominated) but are absent in the saddle phase (see ref. Goetze00, for a different approach).
The key point, following both from analytic computations in soluble models Cavagna00 and simulations Angelani00 ; Broderix00 ; Grigera02 , is that the minima obtained starting from configurations below and the saddles obtained starting above join smoothly at . Thus we can study GIS as a single ensemble, parametrized by the initial temperature or the final energy. We expect that the GIS ensemble belong to a large universality class.
This transition from the phonon phase to the saddle phase is a quite general phenomenon that it is not restricted to glasses. It has been studied in the framework of the Euclidean Random Matrix Theory (ERMT) Mezard99 , showing JPHYS02 that close to this transition, a BP is present in the phonon phase, whose position shifts to lower frequencies on approaching the transition point, while its height grows without bound. The BP actually signals a crossover at frequency between a (phonon dominated) scaling of to an scaling () that is present at the phase transition point. More precisely, at frequencies small respect to the Debye frequency, the VDOS should satisfy the scaling law
| (1) |
where is the distance from the critical point and depends on the actual control parameter (pressure, temperature, etc.) and is such that for and constant for . This scaling law implies that
| (2) |
where . Under the resummation of a given class of diagrams, ERMT predicts JPHYS02 that , and . Of course the actual (universal) values of these critical exponents in three dimension may differ slightly from the values found in this approximation.
We now analyze numerically the existence of such a transition by studying the soft sphere binary mixture, a model of a fragile glass Bernu87 . We simulate this system with the Swap Monte Carlo algorithm GrigeraParisi01 , and compute the VDOS of the ISs obtained starting from equilibrium configurations at temperatures below . Except were stated, we used 2048 particles, and runs were followed until the energy of the IS, , reached a stationary value. The predictions above agree with the numerical data, taking ( being the energy of the ISs and the critical value).
Given the numerical results of Kob et al. Kob00 , one expects that depend only on , and thus that be the relevant control parameter. To check this, we compare the VDOS of two systems at different temperatures (one in equilibrium, the other not) but with the same . The equilibrated system has 2048 particles, while the other has 20000 and is in the regime where has not yet stabilized after a quench (Fig. 1b). As Fig. 1a shows for a representative case, the VDOS obtained at the same for the two systems coincides, confirming that is the control parameter. We can thus proceed to investigate the scaling laws (2).
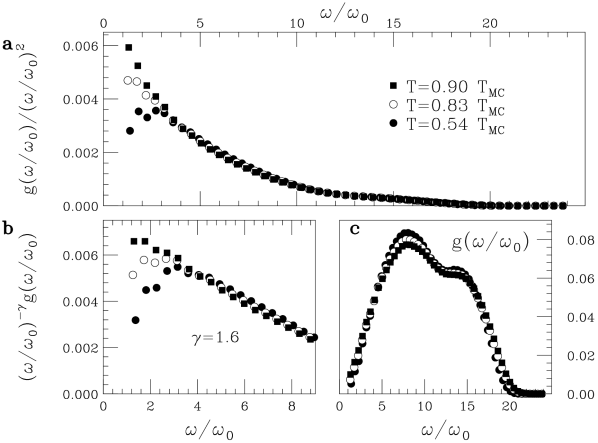
The VDOS at three representative temperatures is shown in Fig. 2. For temperatures up to , a Debye behaviour () is found for the lowest frequencies that can be resolved in a system of this size. In the plot (Fig. 2a), a peak is clearly identified, which is seen to grow in height and shift to lower frequency on rising the temperature. The peak shifts to frequencies below our resolution for , but we can identify a Debye region up to . Above this temperature the Debye region is not well defined, and it disappears completely for . At these temperatures, seems to diverge (at least within the frequency range that we can resolve). Experimentally, this behaviour may be difficult to observe due to the presence of the elastic peak, but B2O3 data Engberg99 seem to support this prediction. For frequencies immediately above , the VDOS scales as , with (Fig. 2b). Note that these changes of the VDOS with temperature go practically unnoticed if one plots directly (Fig. 2c). In particular, the BP is completely unrelated to the first maximum of , whose position is insensitive to temperature changes.
Since we know that decreases slowly with time after a quench Kob00 (see also Fig. 1b), the above results enable us to make predictions about the ageing of the VDOS, and in particular of the BP. With increasing time the system moves farther from the critical point, and thus the BP should decrease in height and shift to higher frequencies. Moreover, at a given frequency (below the asymptotic ) should decrease, since it will be of order at short times and of order at very long times. Similarly, one should expect a cooling rate dependence of the shape of the BP: the slower the cooling, the lower the asymptotic and thus a larger and less pronounced BP. An effect of this kind has been observed in As3S3 Mamedov98 , although here it is difficult to disentangle the physical effect from the chemical changes of the sample due to dissociation. To our knowledge, a clear-cut experimental observation of these effects has not been reported.
Using all the spectra for which the peak position can be clearly identified, we find that the relationship between and the energy of the IS is linear (Fig. 3a). The energy at which becomes zero, , is found from a linear fit as ( is the energy scale). As for the height of the peak, the points up to are compatible with a power-law divergence of the form (2) (Fig. 3b). Fixing at the value arising from the linear fit of vs. , a power-law fit yields an exponent , while if one fixes the exponent , then the critical value is obtained as . Thus the numerical data are compatible with the theoretically predicted scaling, although we have not been able to work close to the critical point, and thus cannot get a great accuracy on the critical exponents or the critical point.
The present discussion applies to experiments as long as one is in the regime where the inverse frequency is much larger than the structural relaxation time, when the harmonic approximation makes sense Horbach99 . Thus, while the BP observed in liquids can be understood by the present considerations, one should not expect to actually arrive close to the critical point in equilibrium measurements. Rather, one should generate a glass by hyperquenching (see e.g. talk by C. A. Angell in http://www.df.unipi.it/workshop/oral/OL6.pdf): for this we predict that the BP measured at low T should obey the scaling (2), the control parameter being the fictive temperature, which in our instantaneous quench is just the temperature at which the hyperquench starts, but in experiments involves also the cooling rate. In this way one should also alleviate the problem of the swamping by the quasielastic peak.
The significance of the value is twofold. First, it is the value of that corresponds, in equilibrium, to , the Mode-Coupling critical temperature (which we have independently determined as in ref. Kob95, , using a standard Monte Carlo without swap). Second, it coincides within errors with the threshold energy below which the ratio of the number of saddle points to the number of minima vanishes exponentially with the number of particles Grigera02 (our numerical accuracy on is similar to that of Grigera02, ). Thus we find a link between the onset of slow dynamics, the appearance of phonon-like excitations and a geometrical phase transition of the PEL in fragile glasses. At variance with previous PEL studies, the clear link between the PEL geometrical transition and high-frequency dynamics allows it to be studied experimentally by following the evolution of the BP.
In summary, we have studied numerically the VDOS of a fragile glass-former liquid undergoing its Mode-Coupling transition. We have found that in the ensemble of the stationary points near the equilibrium configurations (GIS) there is a transition from a mechanically unstable phase where saddles are present to a stable phase where phonon-like excitations appear. The scaling laws predicted by ERMT are compatible with the numerical results we have obtained for the soft sphere model. This approach is equivalent to other microscopic descriptions of the glass transition based on the geometry of the potential energy landscape (PEL) Angelani00 ; Broderix00 ; Grigera02 ; LaNave02 . But this point of view emphasizes quantities accessible to experiment, like the VDOS, and proposes an interpretation of an universal feature of glasses, the Boson peak. The BP appears in the phonon phase, and it is a signature of a cross-over from a phonon-dominated spectrum with a Debye scaling to an , spectrum, resulting from the hybridization of acoustic modes with high-energy modes that soften upon approaching the saddle-phonon transition JPHYS02 . The ERMT predictions (eqs. 1 and 2) could be checked experimentally in hyperquenching experiments, where the Boson peak should strongly depend on the fictive temperature. We expect that the saddle-phonon transition point of view will be able to bridge the realms of experiment and numerical studies of the PEL, allowing to test many geometrical ideas and to use the PEL insights in the detailed analysis of the experimental glass transition.
Acknowledgements
We thank O. Pilla, G. Ruocco and G. Viliani for helpful discussions. We are grateful to the RTN3 collaboration for CPU time in their cluster. VMM was supported in part by European Commission and OCYT (Spain).
References
- (1) Angell, C. A., Formation of glasses from liquids and biopolymers. Science 267, 1924–1935 (1995).
- (2) DeBenedetti, P. G., and Stillinger, F. H., Supercooled liquids and the glass transition. Nature 410, 259–267 (2001).
- (3) Sette F., Krisch M. H., Masciovecchio C., Ruocco G., and Monaco G., Dynamics of Glasses and Glass-Forming Liquids Studied by Inelastic X-ray Scattering. Science 280, 1550–1555 (1998).
- (4) Angelani, L., Di Leonardo, R., Ruocco, G., Scala, A., and Sciortino, F., Saddles in the Energy Landscape Probed by Supercooled Liquids. Phys. Rev. Lett. 85, 5356–5359 (2000).
- (5) Broderix, K., Bhattacharya, K. K., Cavagna, A., Zippelius, A., and Giardina, I., Energy Landscape of a Lennard-Jones Liquid: Statistics of Stationary Points. Phys. Rev. Lett. 85, 5360–5363 (2000).
- (6) Grigera, T. S., Cavagna, A., Giardina, I., and Parisi, G., Geometric Approach to the Dynamic Glass Transition. Phys. Rev. Lett. 88, 055502-1–055502-4 (2002).
- (7) Stillinger, F. H. A topographic view of supercooled liquids and glass formation. Science 267, 1935–1939 (1995).
- (8) Mèzard, M., Parisi, G., and Zee A., Spectra of euclidean random matrices. Nuc. Phys. B 559, 689–701 (1999).
- (9) Grigera, T. S., Martín-Mayor, V., Parisi, G., and Verrocchio, P., Vibrations in glasses and Euclidean random matrix theory. J. Phys.: Condens. Matter 14, 2167–2179 (2002).
- (10) Phillips, W. A., Buchenau, U., Nücher, N., Dianoux, A.-J., Petry, W., Dynamics of Glassy and Liquid Selenium Phys. Rev. Lett. 63, 2381–2384 (1989).
- (11) Ruocco, G. et al., Relaxation Processes in Harmonic Glasses?. Phys. Rev. Lett. 84, 5788–5791 (2000).
- (12) Masciovecchio, C. et al., Observation of large-momentum phononlike modes in glasses. Phys. Rev. Lett. 76, 3356–3359 (1996).
- (13) Matic, A. et al., Contrasting behaviour of acoustic modes in network and non-network glasses. Europhys. Lett. 54, 77–83 (2001).
- (14) Masciovecchio, C. et al., High-frequency propagating modes in vitreous silica at 295 K. Phys. Rev. B 55, 8049–8051 (1997).
- (15) Benassi, P. et al., Evidence of High Frequency Propagating Modes in Vitreous Silica. Phys. Rev. Lett. 77, 3835–3838 (1996).
- (16) Fioretto, D., et al., High-frequency dynamics of glass-forming polybutadiene. Phys. Rev. E 59, 4470–4475 (1999).
- (17) Pilla, O. et al., Nature of the Short Wavelength Excitations in Vitreous Silica: An X-Ray Brillouin Scattering Study. Phys. Rev. Lett. 85, 2136–2139 (2000).
- (18) Martín-Mayor, V., Mèzard, M., Parisi, G., and Verrocchio, P., The dynamical structure factor in topologically disordered systems. J. Chem. Phys. 114, 8068–8081 (2001).
- (19) Grigera, T. S., Martín-Mayor, V., Parisi, G., and Verrocchio, P., Vibrational Spectrum of Topologically Disordered Systems. Phys. Rev. Lett. 87, 085502-1–085502-4 (2001).
- (20) Engberg, D., et al., Origin of the Boson peak in a network glass B2O3, Phys. Rev. B 59, 4053–4057 (1999).
- (21) Götze, W. and Sjorgen, L., Relaxation processes in supercooled liquids. Rep. Prog. Phys. 55, 241–376 (1992).
- (22) Kob, W. and Andersen, H. C., Testing mode-coupling theory for a supercooled binary Lennard-Jones mixture I: The van Hove correlation function. Phys. Rev. E 51, 4626–6241 (1995).
- (23) Göetze W., and Mayr M., Evolution of vibrational excitations in glassy systems. Phys. Rev. E 61, 587–606 (2000)
- (24) Cavagna, A., Giardina, I., Parisi, G., Role of saddles in mean-field dynamics above the glass transition J. Phys. A: Math. Gen. 34, 5317–5326 (2001)
- (25) Bernu, B., Hansen, J.-P., Hiwatari, Y., and Pastore, G., Soft-sphere model for the glass transition in binary alloys: Pair structure and self-difussion. Phys. Rev. A 36, 4891–4903 (1987).
- (26) Grigera, T. S. and Parisi, G., Fast Monte Carlo algorithm for supercooled soft spheres. Phys. Rev. E 63, 045102-1–045102-4 (2001).
- (27) Kob, W., Sciortino, F., and Tartaglia, P., Aging as dynamics in configuration space. Europhys. Lett. 49, 590–596 (2000).
- (28) Mamedov, S., Kisliuk, A., and Quitmann, D., Effect of preparation conditions on the low frequency Raman spectrum of glassy As2S3. J. Mat. Sci. 33, 41–43 (1998).
- (29) Horbach, J., Kob, W., Binder, K., The specific heat of amorphous silica within the harmonic approximation, J. Phys. Chem. B 103, 4104-4108 (1999)
- (30) La Nave, E., Stanley, H. E., and Sciortino, F., Configuration Space Connectivity across the Fragile-to-Strong transition in Silica. Phys. Rev. Lett. 88, 035501-1–035501-4 (2002).
![[Uncaptioned image]](/html/cond-mat/0301103/assets/x1.png)