Anisotropy of the superconducting state properties and phase diagram of MgB2 by torque magnetometry on single crystals
Abstract
The angular and temperature dependence of the upper critical field in MgB2 was determined from torque magnetometry measurements on single crystals. The anisotropy was found to decrease with increasing temperature, in disagreement with the anisotropic Ginzburg-Landau theory, which predicts that the is temperature independent. This behaviour can be explained by the two band nature of superconductivity in MgB2. An analysis of measurements of the reversible torque in the mixed state yields a field dependent effective anisotropy , which can be at least partially explained by different anisotropies of the penetration depth and the upper critical field. It is shown that a peak effect in fields of about is a manifestation of an order-disorder phase transition of vortex matter. The - phase diagram of MgB2 for correlates with the intermediate strength of thermal fluctuations in MgB2, as compared to those in high and low superconductors.
1 Introduction
Superconducting MgB2 exhibits a number of rather peculiar properties, originating from the involvement of two sets of bands of different anisotropy and different coupling to the most relevant phonon mode [1, 2]. Among them are pronounced deviations of the upper critical field, , from predictions of the widely used anisotropic Ginzburg-Landau theory (AGLT).
Apart from two-band superconductivity, MgB2 provides a link between low and high superconductors on a phenomenological level, particularly concerning vortex physics. In both high and low superconductors, for example, a phase transition of vortex matter out of a quasi-ordered “Bragg glass” have been identified, with rather different positions in the - plane. Studying the intermediate MgB2 may help establishing a “universal vortex matter phase diagram”.
Here, we present a torque magnetometry study of the anisotropic upper critical field, equilibrium magnetization, and the vortex matter phase diagram of single crystalline MgB2 [3]. We will show direct evidence of a temperature dependence of the anisotropy, discuss strong indications of a difference between the anisotropies of the penetration depth and , and present the - phase diagram for .
Single crystals were grown with a cubic anvil high pressure technique, described in this issue [4]. Three crystals were used in this study, labeled A, B, and C. Sharp transitions to the superconducting state indicate a high quality of the crystals. An curve of crystal B with can be found in Ref. [5].
The torque , where is the magnetic moment of the sample, was recorded as a function of the angle between the applied field and the axis of the crystal in various fixed fields [6]. For measurements close to , in fields up to , a non-commercial magnetometer with very high sensitivity was used [7]. For part of these measurements, a vortex-shaking process was employed to speed up the relaxation of the vortex lattice [8]. Crystal A was measured in this system. Crystals B and C were measured in a wider range of temperatures down to , in a Quantum Design PPMS with torque option and a maximum field of . For crystals B and C, measurements at fixed angles were performed in addition to measurements in fixed .
2 Upper critical field and it’s anisotropy
Early measurements on polycrystalline or thin film MgB2 samples with various methods and single crystals by electrical transport yielded values of the anisotropy parameter of the upper critical field in a wide range of values of [9]. More recently, several papers reported a temperature dependence of the anisotropy, ranging between about at and close to [10, 11, 12, 13, 14, 15, 16, 17, 18]. In this section, we present direct evidence of a temperature dependence of the anisotropy and discuss details of it’s behaviour, comparing the torque data with numerical calculations [19].
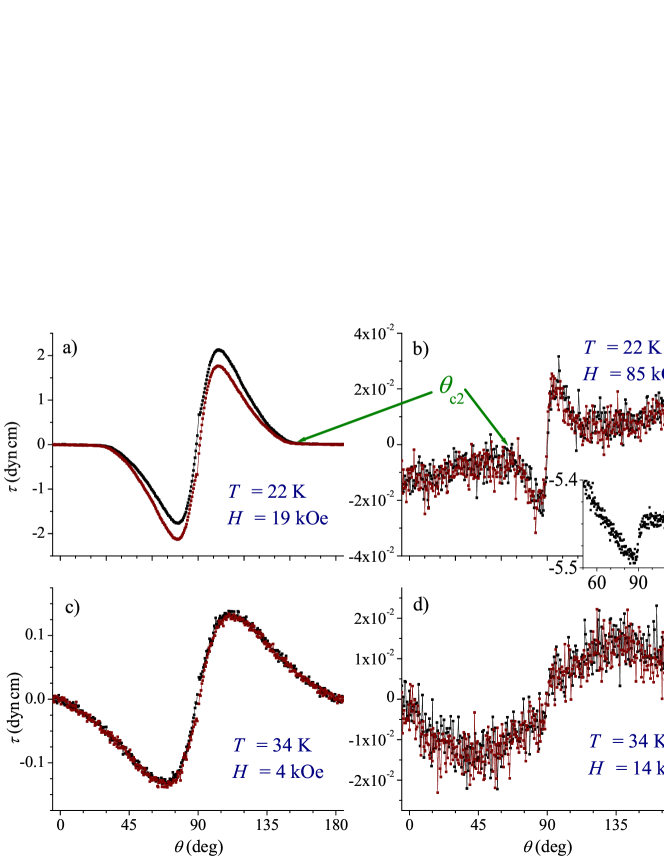
Four angular torque dependences are shown in Fig. 1. Panels a) and b) correspond to measurements at . For fields nearly parallel to the -axis, both curves are flat, apart from a small background visible in panel b). Only when is nearly parallel to the plane there is an appreciable torque signal. The curve can be interpreted in a straight-forward way: for parallel to the axis the sample is in the normal state, while for parallel to the plane it is in the superconducting state. The crossover angle between the normal and the superconducting state is the angle for which the fixed applied field is the upper critical field. From the existence of both superconducting and normal angular regions follows immediately that and . In panel c), on the other hand, the crystal is seen to be in the superconducting state for all values of the angle , and therefore . Finally, the data in panel d) show only a small background contribution form and angular regime of the deviation from a straight line are incompatible with a superconducting signal. Therefore, the crystal is here in the normal state for any , and we have .
From figure 1 we therefore have two limitations for the upper critical field anisotropy, hereafter called , without any detailed criterion, and without any model fits :
| (1) |
These relations show that the upper critical field anisotropy of MgB2 cannot be temperature independent. As an immediate implication, the anisotropic Ginzburg-Landau theory (AGLT) in it’s standard form does not hold for MgB2. The deviation is strong, within a change of temperature of about , changes, at least, by a fifth of it’s value.
Although it is clear that AGLT with it’s effective mass anisotropy model cannot describe the data measured at different temperatures consistently, the detail analysis of the dependence of we used is based on AGLT. We will show that as long as we stay at a fixed temperature, AGLT is able to describe remarkably well [20]. Although the location of , for example in Fig. 1a), seems clear at first sight, this clarity disappears, when examining the transition region in a scale necessary for the precise determination of (see Fig. 1 in Ref. [10]). For an strict analysis, it is necessary to take into account that the transtion at is rounded off by fluctuations.
In sufficiently high fields, , the so-called “lowest Landau level” (LLL) approximation was used successfully to describe the effects of fluctuations around [21, 22]. In the case of the cuprates, the value of , and thus of the regime of applicability of the LLL approximation, is a controversial issue (see, e.g., Ref. [23] for a theoretical discussion of the limits of the LLL approximation). However, in the case of MgB2, even using the theoretical criterion of Ref. [23], which led to the high estimation in the case of YBa2Cu3O7-δ, we obtain an upper limit of . We therefore used a LLL scaling analysis for the determination of or [10].
From the resulting curve, the anisotropy parameter is then extracted by an analysis with AGLT, which predicts the angular dependence of the upper critical field to be [24]
| (2) |
We note that in the rescaling of the torque according to the LLL fluctuations theory, the target parameter is used, which is obtained only later with Eq. (2). Therefore, scaling analysis and determination of with Eq. (2) had to be performed iteratively in order to self consistently find . However, the and points obtained with the scaling analysis depend not very strongly on the value of used in the scaling and the procedure converges rather fast.
Figure 2 shows the angular dependence of of crystal B and C. The curves shown in the figure are fits of Eq. (2) to the data, showing that the angular dependence of is well described by AGLT at both temperatures. On the other hand, the anisotropy parameter needed to describe the data with Eq. (2) is temperature dependent, as is best seen in the inset.
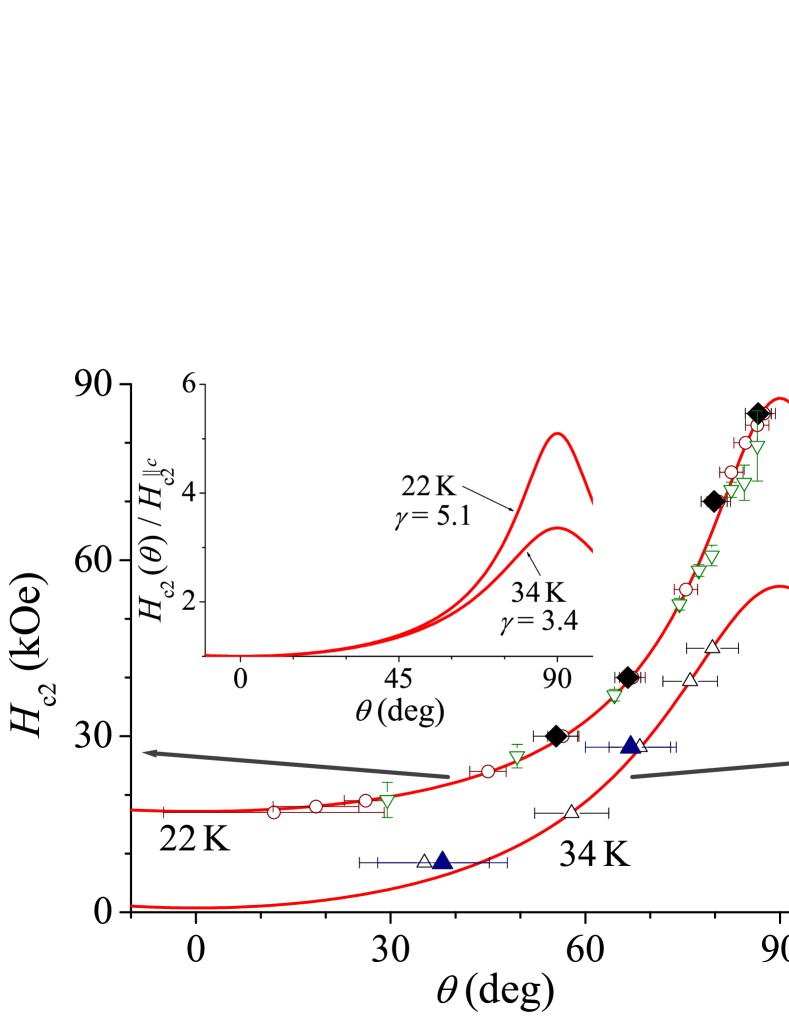
The irreversible properties of the two crystals (B and C) are different in a pronounced way (see Secs. 3 and 4), showing that they have a rather different defect structure. The good agreement both in value and angular dependence of of crystals B and C that is observable in Fig. 2 indicates that such differences in the defect structure do not influence the upper critical field much, at least in the region between and , and therefore cannot influence our conclusion of a dependent anisotropy.
Small, but systematic, deviations from the angular dependence of according to Eq. (2) were observed only at temperatures close to . It may indicate that we are approaching in this region and the values of and obtained from the LLL scaling analysis (see above) start to deviate from the mean field values. The good general approximation of by Eq. (2) is in agreement with recent calculations [19]. However, the calculations predict small deviations at low temperatures [25], rather than close to . Our experimental limitation of fields up to may prevent the observation of deviations from Eq. (2) at low temperatures.
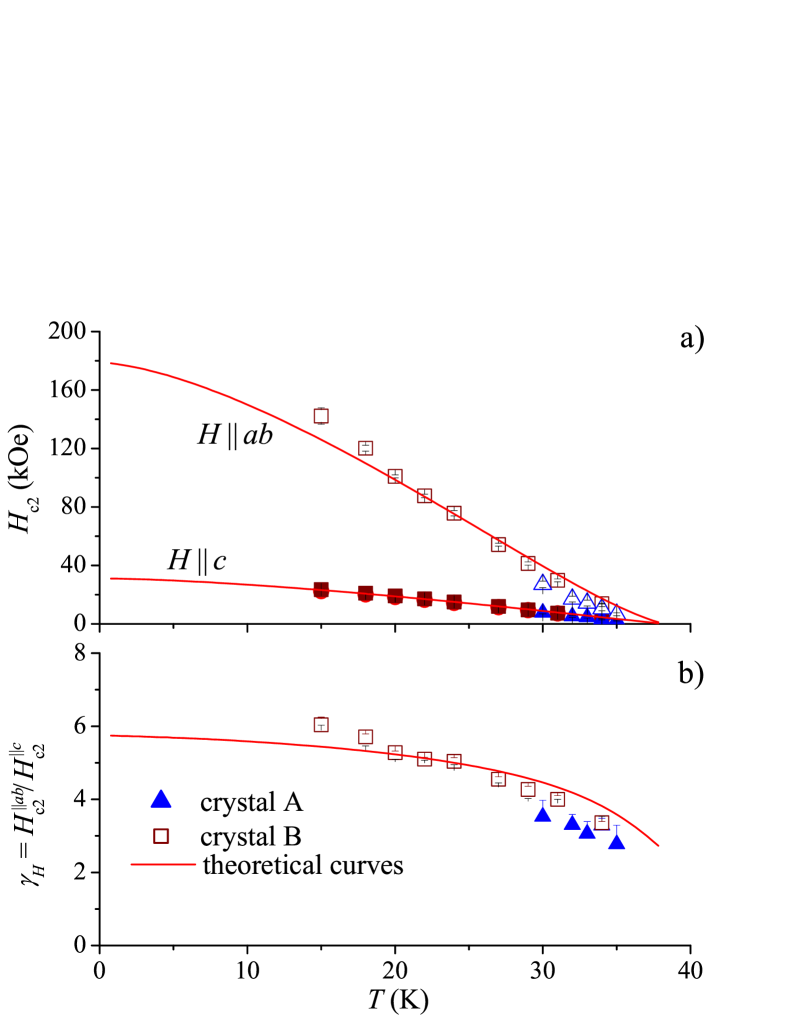
The upper critical fields parallel and perpendicular to the layers obtained with the scaling analysis and Eq. (2) are shown in Fig. 3a). Results obtained for two crystals measured in two magnetometers are depicted as different symbols. The dependence of is in agreement with (isotropic) calculations by Helfand et al. [26], with . On the other hand, exhibits a slight positive curvature near . These features are common to highly anisotropic (layered) superconductors. Although MgB2 as a whole is rather isotropic, superconductivity is dominant on the quasi-2D bands, which may well account for the different dependence of and . This may also be the origin of the positive curvature of observed in other measurements of bulk, thin film and single crystal MgB2 [9]. Due to the lack of low data and the dependence, only an estimation can be given.
The anisotropy data [Fig. 3b)] show that systematically decreases with increasing temperature, from at to at . From the experimental data shown in Fig. 3 we estimate , while at zero temperature, may become as large as .
Comparing our data with the data reported by other authors [11, 12, 13, 14, 15, 16, 17, 18], we note that electrical transport measurements [14, 15] yield too high values of [11, 13]. All bulk measurements (torque [10], magnetization [12, 13, 16, 18], thermal conductivity [11], and specific heat [13, 17]) agree well on the dependence and value. Concerning , and consequently , however, reported values differ from each other. Exchanging the samples between different groups could help clarifying, whether the discrepancies of values are mainly due to sample differences or due to differences in the experimental methods employed.
Very recently, , , and , have been calculated for MgB2 [19]. The Fermi surface was modeled as consisting of two separate sheets, approximated as simple spheroids, but with average characteristics taken from first principles calculations. The result of these calculations are compared with our experimental data in Fig. 3. Very good agreement is seen for the upper critical field perpendicular to the layers (). Qualitatively, calculations and experiment also agree well for the upper critical field parallel to the layers (). This shows that the essential source of the deviations of the upper critical field from AGLT predictions is captured with a simple effective two band model, while further details of the Fermi surface and superconducting gap are negligible. In Fig. 3, we see good quantitative agreement between experimental data and the theoretical curve between and .
The deviations at lower may, on the one hand, be due to a decreased the accuracy of our analysis because the field limitation of restricts the angular range where data could be obtained. This can lead to deviations larger than the estimated error bars, especially since the theoretical calculations indicate deviations of the dependence from the prediction of Eq. (2) at low [25]. On the other hand, at low temperatures depends on the shape of the Fermi surface in rather subtle manner, and the model Fermi surface used for the calculations [19] may be too simple for a quantitatively correct description at low . The deviations at higher may be due to the limitations of the LLL scaling approach in low fields, and or due to the influence of disorder, which is not accounted for in the calculations.
Close to , non-locality is not important, and consequently, AGLT is expected to hold even if this is not the case at lower . Despite of this, Fig. 3 clearly indicates that the variation of with temperature is the strongest close to . Therefore, in MgB2, AGLT seems to have a very limited range of applicability indeed.
3 Reversible and irreversible torque below
An alternative method to obtain the anisotropy parameter of a superconductor, used often and with success in the case of cuprates [8, 27, 28], consists of measuring the torque, as a function of angle, well below , and analyzing the data with a formula developed by Kogan [29]:
| (3) |
where , is the effective mass anisotropy, is the in-plane penetration depth, is the volume of the crystal, is the flux quantum, and is a constant of the order of unity depending on the vortex lattice structure. Equation (3) is valid in the limits of fields and not too close to . A further restriction is that Eq. (3) describes the reversible torque only. To obtain the true reversible torque, we employed a vortex-shaking process [8]. In the investigated field and temperature region, the shaked torque was found to be well reversible.
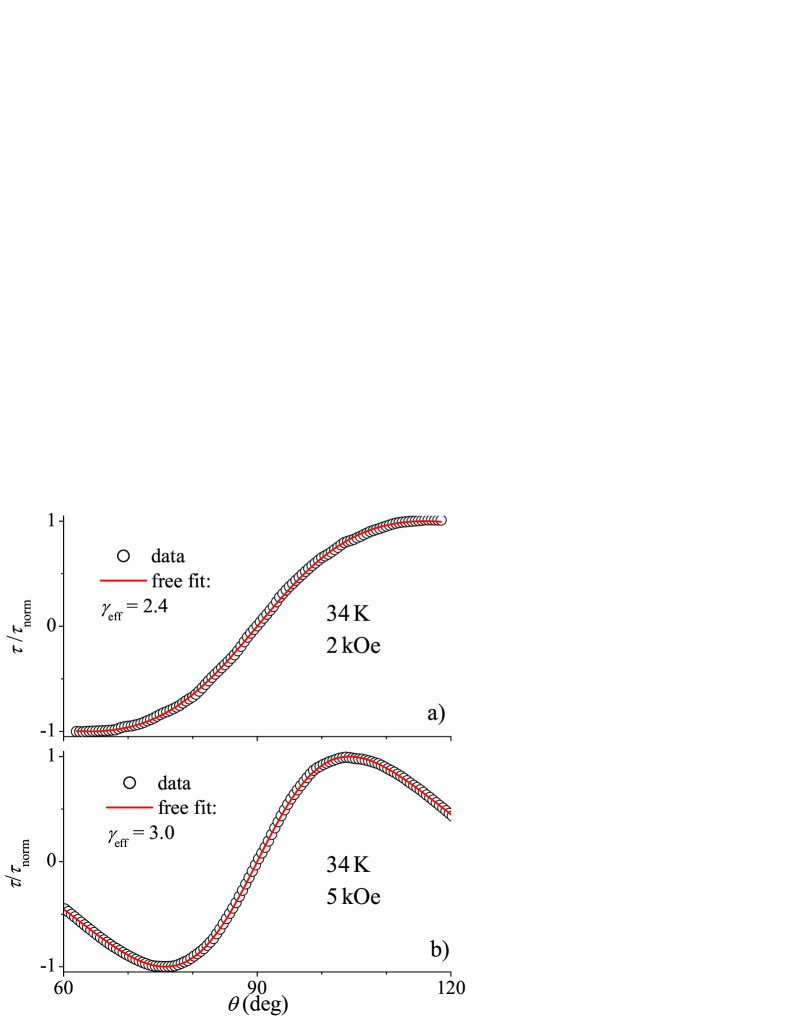
In Fig. 4, normalized torque vs angle curves, measured in different fields at , are compared. Increasing from [panel a)] to [panel b)] leads to an unexpectedly large shift of the maximum torque towards , which may indicate an increase of the anisotropy with increasing . This is confirmed by the analysis of the data with Eq. (3). The best agreements of the equation with the data are obtained for in and in (full curves in Fig. 4). Although descriptions with in or in are also possible without obvious discrepancies to the data, the corresponding qualities of the fit as expressed by the parameter are worse by more than an order of magnitude in both cases.
From the analysis of reversible torque data for crystal A measured in the range of fields and temperatures from to and from to [10], a few points are worth to be emphasized: 1.) is field dependent, increasing nearly linearly from in zero field to in . 2.) No clear dependence is visible between and . 3.) The effective anisotropy , as obtained from the analysis with Eq. (3) is different from the anisotropy .
Especially concerning point 3.), it is important to recognize that, also theoretically, the anisotropy is not necessarily the same as the anisotropy . When AGLT is not applicable, the anisotropies of the penetration depth, , and of the upper critical field, , differ in general. Calculations of of MgB2 [30, 31] indeed found values much lower than the upper critical field anisotropy values. There is also experimental support for a low [32].
In Eq. (3), appears twice, and in a first approximation [33], the appearance outside of the logarithm can be thought of as due to the anisotropy, while the appearance in the logarithm is linked to the anisotropy. A corresponding calculation with different (fixed) and yields [34] a field dependent (common) effective anisotropy similar to the experimental observations.
Field dependent point-contact spectroscopy [35] and specific heat [36] measurements indicate that the small gap disappears in fields of the order of , i.e., superconductivity in the (3D) Fermi sheets is rapidly suppressed by even low fields, whereas it persists in the (2D) sheets up to much higher fields. This should result in an increase of the effective (bulk) anisotropy with increasing . Further studies are needed for a complete understanding of the detailed interplay of the effects described above.
In the “unshaked” torque data of crystals A and B, a pronounced peak in the irreversible torque for field alignments close to , was observed (see, e.g., upper inset of Fig. 5 of Ref. [10]). It is tempting to ascribe this feature, also observed by other authors [37], to “intrinsic pinning”, in analogy to observations on strongly anisotropic cuprate superconductors. However, the observation of such “intrinsic pinning” in MgB2 is rather counter-intuitive, since the “intrinsic pinning” is mostly determined by the ratio of the -axis coherence length to the separation of the superconducting layers, which is much larger in MgB2 than in the case of cuprates in the region where “intrinsic pinning” is commonly observed by torque magnetometry (see, e.g., [28]). The apparent paradox is resolved by further measurements: torque measurements on crystal C with the same conditions show no sign of “intrinsic” pinning for [38, 34], indicating the extrinsic origin of the feature. The most likely cause of the peak in the irreversible torque for is a small amount of stacking faults. It may indicate the presence of some stacking faults in crystals A and B, while they would seem to be absent in crystal C [39].
4 Peak effect and vortex matter phase diagram
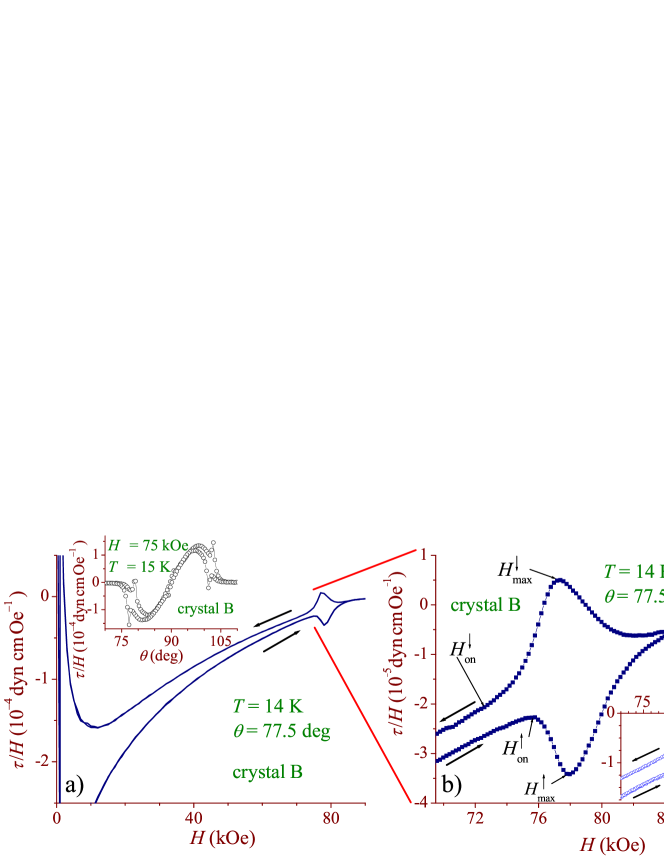
In low superconductors, such as NbSe2, the order-disorder transition is signified experimentally by a peak effect (PE) in the critical current density [40]. We observed such a PE by torque measurements on MgB2 single crystals B and C, both in and measurements, as can be seen in Fig. 5. In Sec. 3, we have noticed that crystals B and C behave quite differently for , which may be due to the presence of a small number of stacking faults in the former one. The presence of the PE in two crystals with such pronounced differences strongly indicates that the PE, or rather it’s underlying mechanism, is an intrinsic feature of MgB2. A study with a “minor hysteresis loop” technique on crystal B [5] revealed a history dependent critical current density in the PE region, compatible with and expected for the behaviour at the order-disorder transition.
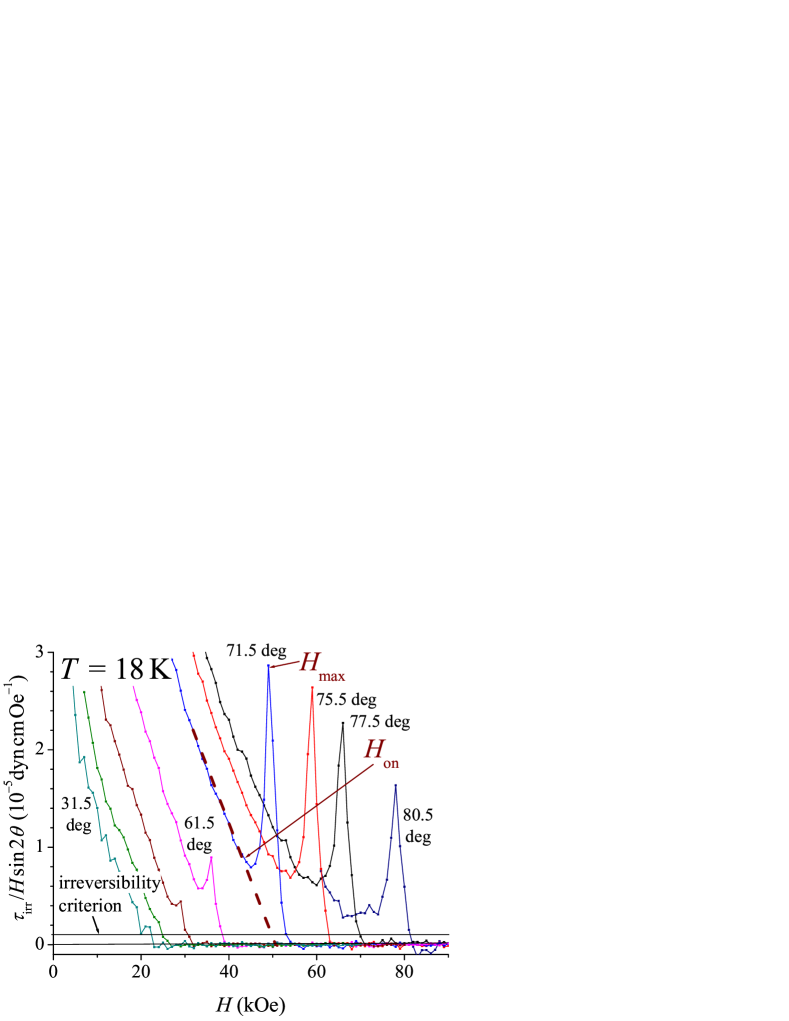
Figure 6 shows the irreversible part of the torque, scaled by , vs field, at for various angles. The scaling was chosen to minimize the angle and field dependence intrinsic to the torque. Since the peak is not visible at all temperatures and angles as well as in Fig. 5, onsets and maxima were determined from irreversible torque curves as those shown in Fig. 6. was defined as the field, where the irreversible torque starts to deviate from a straight line behaviour, as indicated in the figure for the curve measured at . , defined in this way, is close to as indicated in Fig. 5b). However, we note that with the determination of onsets and maxima from the irreversible torque, the fine details of the differences in the field increasing and decreasing branch of the hysteresis loops are lost.
It can be seen in Fig. 6 that the height of the peaks varies in a pronounced way with the angle . One possible explanation for this behaviour is an interaction of the peak effect with stacking faults [39]. Although the presence and the location of the peak effect are not affected by stacking faults, the extent of hysteresis may be. The difference of how pronounced the peaks of crystals B and C are [see Fig. 5b)] supports such a scenario. The location in higher fields of the peak effect in crystal C indicates that there is less point-like disorder present in this crystal than in crystal B. However, the smaller ratio in crystal C, compared to crystal B, is difficult to explain with only one sort of disorder. Individual strong pinning, e.g., by sparse stacking faults, should be much more efficient in the disordered phase than in the Bragg glass with it’s nearly perfect ordered lattice [41]. If the peak height observed in crystal B is affected by stacking faults, a more pronounced PE close to is natural, since the pinning efficiency of stacking faults, similar to twin boundary pinning, is strongly direction-dependent [42].
On the other hand, the peak height can be influenced by the natural angle dependence of the torque, despite the scaling made. This is because the is only an approximation, which is not appropriate for all angles , in a superconductor with pronounced anisotropy (see also Ref. [5]).
The angular dependence of the onsets and maxima of the PE tracks the one of , i.e., it follows Eq. (2) [5]. This indicates that the PE (or rather it’s underlying mechanism) is a feature for all directions of the applied field, and not just of the angular region where it is readily discernible. To directly check the situation for and , where torque measurements are not possible, SQUID and ac susceptibility [43, 44] measurements were performed.
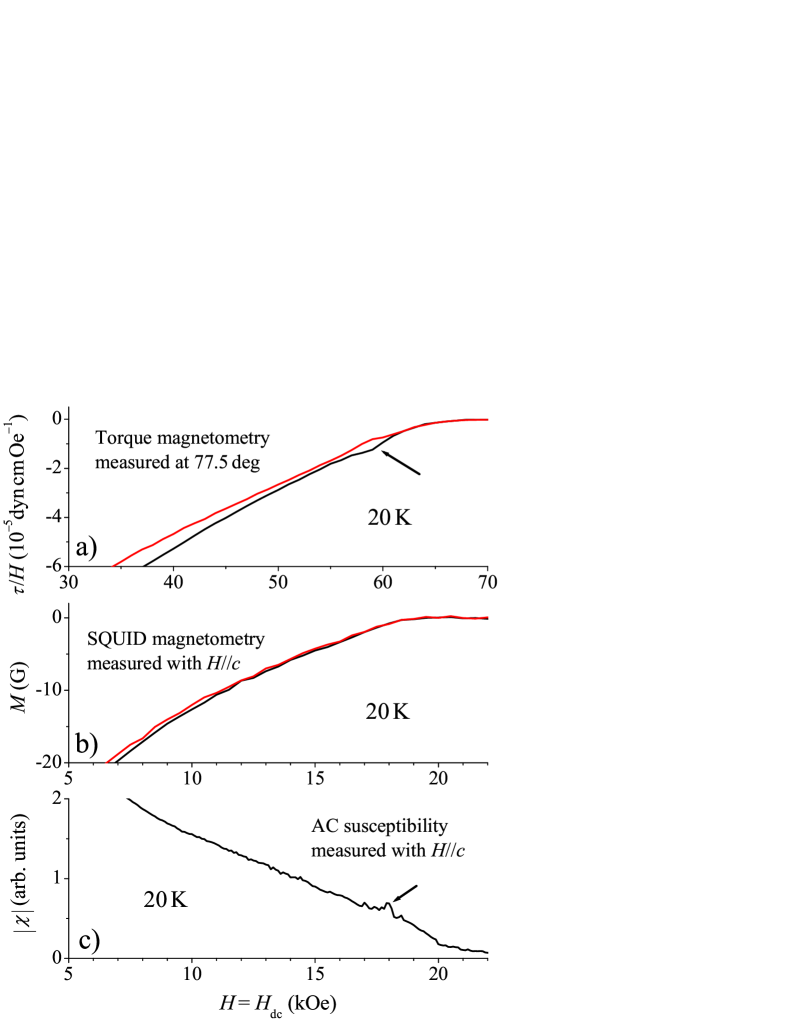
In Fig. 7, we compare measurement curves obtained on crystal B at , using different experimental techniques. Torque measurements performed at an angle of show [Fig. 7a)] a clearly discernible PE located in a field of about . Scaled with Eq. (2) to , this corresponds to to . As can be seen in Fig. 7b), there is no sign of a PE observable in SQUID data in this field region. Generally, no sign of a peak effect was observed by SQUID magnetometry at any temperature, for both field directions. This is likely due to insufficient sensitivity of the SQUID. In ac susceptibility data [Fig. 7c)], on the other hand, a PE is visible for in the appropriate field region. A report of the ac susceptibility results will be published elsewhere [44]. A PE in MgB2 was also reported recently by other authors, in the case of from transport data [13, 17] and ac susceptibility with a local Hall probe [17, 45], in the case of from transport data [17].
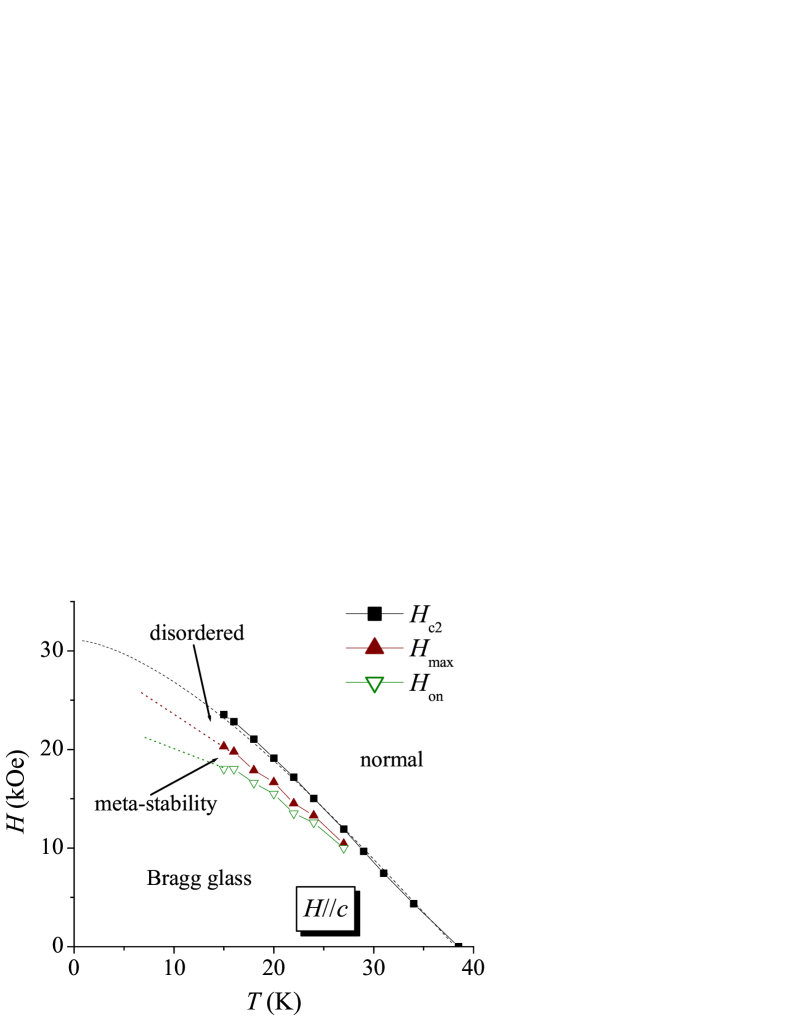
The phase diagram for obtained from torque magnetometry, based on both and measurements and the angular scaling of Eq. (2) is presented in Fig. 8. The magnitude of the peaks is reduced quickly by increasing the temperature, and above , the PE is no longer discernible in the torque data. This is due to the decreased sensitivity of the torque magnetometer in lower fields and due to thermal smearing of the effective pinning potential. In a recent report of low frequency ac susceptibility measurements [45], the peak effect was observed for at temperatures up to about , and interpreted in terms of the order-disorder transition as well. In Ref. [45], the transformation of the PE into a “step-like” ac susceptibility is reported for the temperature interval between and , and interpreted as a signature of thermal melting. In our case, no step-like feature in the reversible torque was observed in the continuation of the PE. It should be emphasized, that thermal melting so far below would be at odds [5] with theoretical expectations [46].
The equilibrium order-disorder transition, which corresponds to [5], is located in fields of about in crystal B and in about in crystal C. The peak effect observed in other crystals by transport was reported to be located even closer to [13, 17]. These differences are natural for a disorder-induced phase transition in crystals with varying degrees of disorder. Form and location of the PE observed in MgB2 resembles results obtained on NbSe2 single crystals with varying degrees of disorder [40], but are rather different from the order-disorder transition in cuprate superconductors [47].
5 Conclusions
In summary, studying the anisotropic superconducting state properties of MgB2 revealed a strong temperature dependence of the upper critical field anisotropy , and indicated a difference of the anisotropies of the penetration depth and the upper critical field. These findings, which imply a breakdown of the standard form of the widely used anisotropic Ginzburg-Landau theory in MgB2, can be explained by superconductivity in this compound involving two band systems of different dimensionality, in accordance with microscopic studies.
A pronounced peak effect in the magnetic hysteresis is a signature of an “order-disorder” transition of vortex matter, similar to transitions in both high cuprate and low superconductors. Despite the intermediate importance of thermal fluctuations in MgB2, the phase diagram resembles quite closely the one of the low superconductor NbSe2. On the other hand, chances of a proper identification of mainly thermally induced melting at higher temperatures are better in MgB2, due to the increased thermal fluctuations.
Acknowledgements
We thank V. G. Kogan and B. Batlogg for enlightening and stimulating discussions. This work was supported by the Swiss National Science Foundation, by the European Community (contract ICA1-CT-2000-70018), by the Polish State Committee for Scientific Research (5 P03B 12421), and by the Swiss federal office BBW (02.0362).
References
- [1] A. Y. Liu, I. I. Mazin, and J. Kortus, Phys. Rev. Lett. 87, 087005 (2001).
- [2] H. J. Choi, D. Roundy, H. Sun, M. L. Cohen, and S. G. Louie, Nature 418, 758 (2002).
- [3] An extended discussion of the results presented here can be found in M. Angst, PhD thesis, submitted to ETH Zürich.
- [4] J. Karpinski, S. M. Kazakov, J. Jun, M. Angst, R. Puzniak, A. Wisniewski, and P. Bordet, this issue.
- [5] M. Angst, R. Puzniak, A. Wisniewski, J. Jun, S. M. Kazakov, and J. Karpinski, cond-mat/0205293.
- [6] Note that there are two torque conventions used in the literature, leading to opposite signs of the torque shown, but to the same physical consequences. The convention used here (and in Refs. [5, 8, 10, 28, 34, 38]) is that the diamagnetism is expressed by a negative value of the magnetic moment. The other convention, used in Refs. [7, 27, 33, 37], is that the diamagnetism is expressed solely by the direction of the (positive) magnetic moment vector.
- [7] M. Willemin, C. Rossel, J. Brugger, M. H. Despont, H. Rothuizen, P. Vettiger, J. Hofer, and H. Keller, J. Appl. Phys. 83, 1163 (1998).
- [8] M. Willemin, C. Rossel, J. Hofer, H. Keller, A. Erb, and E. Walker, Phys. Rev. B 58, R5940 (1998).
- [9] C. Buzea and T. Yamashita, Supercond. Sci. Technol. 14, R115 (2001).
- [10] M. Angst, R. Puzniak, A. Wisniewski, J. Jun, S. M. Kazakov, J. Karpinski, J. Roos, and H. Keller, Phys. Rev. Lett. 88, 167004 (2002).
- [11] A. V. Sologubenko, J. Jun, S. M. Kazakov, J. Karpinski, and H. R. Ott, Phys. Rev. B 65, 180505(R) (2002).
- [12] S. L. Bud’ko and P. C. Canfield, Phys. Rev. B 65, 212501 (2002).
- [13] U. Welp, G. Karapetrov, W. K. Kwok, G. W. Crabtree, C. Marcenat, L. Paulius, T. Klein, J. Marcus, K. H. P. Kim, C. U. Jung, H.-S. Lee, B. Kang, and S.-I. Lee, cond-mat/0203337.
- [14] Y. Eltsev, S. Lee, K. Nakao, N. Chikumoto, S. Tajima, N. Koshizuka, and M. Murakami, Phys. Rev. B 65, 140501(R) (2002).
- [15] C. Ferdeghini, V. Braccini, M. R. Cimberle, D. Marre, P. Manfrinetti, V. Ferrando, M. Putti, and A. Palenzona, cond-mat/0203246.
- [16] M. Zehetmayer, M. Eisterer, J. Jun, S. M. Kazakov, J. Karpinski, A. Wisniewski, and H. W. Weber, Phys. Rev. B 66, 052505 (2002).
- [17] L. Lyard, P. Samuely, P. Szabo, C. Marcenat, T. Klein, K. H. P. Kim, C. U. Jung, H.-S. Lee, B. Kang, S. Choi, S.-I. Lee, L. Paulius, J. Marcus, S. Blanchard, A. G. M. Jansen, U. Welp, and W. K. Kwok, cond-mat/0206231.
- [18] Y. Machida, S. Sasaki, H. Fujii, M. Furuyama, I. Kakeya, and K. Kadowaki, cond-mat/0207658.
- [19] P. Miranović, K. Machida, and V. G. Kogan, cond-mat/0207146.
- [20] This justifies our AGLT based analysis a posteriori. An only small deviation of the dependence of from AGLT predictions (with a dependent anisotropy) was also found in numerical calculations [25].
- [21] P. A. Lee and S. R. Shenoy, Phys. Rev. Lett. 28, 1025 (1972).
- [22] U. Welp, S. Fleshler, W. K. Kwok, R. A. Klemm, V. M. Vinokur, J. Downey, B. Veal, and G. W. Crabtree, Phys. Rev. Lett. 67, 3180 (1991).
- [23] I. D. Lawrie, Phys. Rev. B 50, 9456 (1994).
- [24] D. R. Tilley, Proc. Phys. Soc. London 86, 289 (1965), ; 86, 678 (1965).
- [25] P. Miranović et al., unpublished.
- [26] E. Helfand and N. R. Werthamer, Phys. Rev. 147, 288 (1966).
- [27] D. E. Farrell, C. M. Williams, S. A. Wolf, N. P. Bansal, and V. G. Kogan, Phys. Rev. Lett. 61, 2805 (1988).
- [28] D. Zech, C. Rossel, L. Lesne, H. Keller, S. L. Lee, and J. Karpinski, Phys. Rev. B 54, 12535 (1996).
- [29] V. G. Kogan, Phys. Rev. B 38, 7049 (1988).
- [30] V. G. Kogan, Phys. Rev. B 66, 020509 (2002).
- [31] A. A. Golubov, A. Brinkman, O. V. Dolgov, J. Kortus, and O. Jepsen, Phys. Rev. B 66, 054524 (2002).
- [32] F. Manzano and A. Carrington, Phys. Rev. Lett. 88, 047002 (2002).
- [33] In a very recent study, Kogan [V. G. Kogan, cond-mat/0207688] performed detailed calculations of the torque density from the free energy of the London model with different anisotropies and . The obtained result is more complicated than the first approximation used in Ref. [34].
- [34] J. Karpinski, M. Angst, J. Jun, S. M. Kazakov, R. Puzniak, A. Wisniewski, J. Roos, H. Keller, A. Perucchi, L. Degiorgi, M. Eskildsen, P. Bordet, L. Vinnikov, and A. Mironov, cond-mat/0207263.
- [35] P. Szabó, P. Samuely, J. Kamarík, T. Klein, J. Marcus, D. Fruchart, S. Miraglia, C. Marcenat, and A. G. M. Jansen, Phys. Rev. Lett. 87, 137005 (2001).
- [36] F. Bouquet, Y. Wang, I. Sheikin, T. Plackowski, A. Junod, S. Lee, and S. Tajima, cond-mat/0207141.
- [37] K. Takahashi, T. Atsumi, N. Yamamoto, M. Xu, H. Kitazawa, and T. Ishida, Phys. Rev. B 66, 012501 (2002).
- [38] M. Angst, R. Puzniak, A. Wisniewski, J. Roos, H. Keller, and J. Karpinski, cond-mat/0206407.
- [39] X ray investigations of crystals B and C are in progress. Stacking faults have been observed in other samples of MgB2, see, e.g., Y. Zhu, L. Wu, V. Volkov, Q. Li, G. Gu, A. R. Moodenbaugh, M. Malac, M. Suenaga, and J. Tranquada, Physica C 356, 239 (2001).
- [40] See, e.g., S. S. Banerjee, N. G. Patil, S. Ramakrishnan, A. K. Grover, S. Bhattacharya, P. K. Mishra, G. Ravikumar, T. V. C. Rao, V. C. Sahni, M. J. Higgins, C. V. Tomy, G. Balakrishnan, and D. M. Paul, Phys. Rev. B 59, 6043 (1999).
- [41] In the Bragg glass, the strong elastic forces disfavour non-collective pinning. Similar ideas were discussed in the context of cuprate superconductors with twin boundaries. See A. I. Larkin, M. C. Marchetti, and V. M. Vinokur, Phys. Rev. Lett. 75, 2992 (1995).
- [42] Similar observations were made on a YBa2Cu3O7-δ crystal containing two twin boundaries. See W. K. Kwok, J. A. Fendrich, C. J. V. der Beek, and G. W. Crabtree, Phys. Rev. Lett. 73, 2614 (1994).
- [43] Ac susceptibility measurements were performed with a Quantum Design Physical Properties Measurement System with an excitation frequency of and amplitude .
- [44] R. Puzniak et al., in preparation.
- [45] M. Pissas, S. Lee, A. Yamamoto, and S. Tajima, Phys. Rev. Lett. 89, 097002 (2002).
- [46] G. P. Mikitik and E. H. Brandt, Phys. Rev. B 64, 184514 (2001).
- [47] See, e.g., M. Angst, S. M. Kazakov, J. Karpinski, A. Wisniewski, R. Puzniak, and M. Baran, Phys. Rev. B 65, 094518 (2002).