Electron-phonon interaction in n-doped cuprates: an Inelastic X-ray Scattering study
Abstract
Inelastic x-ray scattering (IXS) with very high (meV) energy resolution has become a valuable spectroscopic tool, complementing the well established coherent inelastic neutron scattering (INS) technique for phonon dispersion investigations. In the study of crystalline systems IXS is a viable alternative to INS, especially in cases where only small samples are available. Using IXS, we have measured the phonon dispersion of along the and in-plane directions. Compared to the undoped parent compound, the two highest longitudinal optical (LO) phonon branches are shifted to lower energies because of Coulomb-screening effects brought about by the doped charge carriers. An additional anomalous softening of the highest branch is observed around . This anomalous softening, akin to what has been observed in other compounds, provides evidence for a strong electron-phonon coupling in the electron-doped high-temperature superconductors.
1 Introduction
Inelastic neutron scattering (INS) measurements of phonon dispersions in the p-type superconductors [1, 2, 3, 4], oxygen-doped [5], and [2, 6, 7] show an anomalous softening of the highest longitudinal optical (LO) phonon branch with doping, especially along in these p-type cuprate superconductors. The atomic displacement assigned to this branch is the Cu-O bond-stretching (BS) mode[2, 8]. The interpretation of such an anomaly invokes a strong electron-phonon coupling[2, 3], but it is still a challenge to provide a quantitative model of this coupling (see Ref. [2, 3, 4, 9, 10]).
Similar anomalies also develop with doping in other perovskite oxides, such as [11] and [12], which are nearly cubic, and in [13], which is iso-structural to . In the case of , there is evidence that the strong electron-phonon coupling is responsible for both the anharmonic behaviour of the high-energy LO modes and the high superconducting transition temperature (30 K) of this material[12]. However, a microscopic model capable of explaining the electronic and lattice dynamical properties of is still lacking[14].
The effect of an anomalously strong electron-phonon coupling is still unclear. At this point, one may not even exclude the possibility that it may be pair-breaking for the d-wave superconducting order parameter[15]. Therefore, it is very important to analyse the phonon anomalies in as many cuprate families as possible, and to compare these anomalies with the electronic properties. In this context, the different character of electron and hole carriers is of central importance: Cu (O ) for n(p)-type cuprates[16]. This difference leads to very different electronic structures[17]. Since the phonon anomalies are related to a coupling between charge fluctuations and phonons, charge carriers with different character may induce quite different electron-phonon interactions. Therefore, it is imperative to extend studies of the electron-phonon coupling to the n-type cuprates.
X-ray and neutron scattering are complementary experimental tools[18]. An advantage of IXS over INS is the ability to work with very small samples due to the very small beam size and high brilliance obtainable at 3rd generation synchrotron sources. Moreover, the scattering volume for x-rays in the energy range of 10 to 20 keV is strongly limited by photoelectric absorption for . In the case of the cuprates, IXS probes a depth between 10 and 100 m, comparable with the lateral size of the x-ray beam obtained on the ID16 (or ID28) beam line at the ESRF. This allows experiments with scattering volumes as small as 10-4 mm3. Therefore, IXS is the only technique available for phonon dispersion measurements of small samples. This is relevant for the electron-doped superconductor in which the oxygen non-stoichiometry may vary throughout the sample as a consequence of the reduction procedure required to create the superconducting phase. The small scattering volume ensures that effects due to any composition gradient are minimised. A further advantage of the short photoelectric absorption length is the reduction of multiple scattering processes[18].
Another important difference between INS and IXS is that the magnetic cross section is negligible for x-rays, whereas it is comparable to the nuclear cross section for neutrons. Therefore, x-rays are essentially insensitive to magnetic excitations in the THz regime, which can be helpful for separating magnetic and lattice contributions. Indeed, in there are very strong crystal field excitations with a neutron cross section about ten times greater than that for phonons, in particular in the range from 4 to 8 THz[19].
Other important differences between IXS and INS are: a) The x-ray cross section is highly coherent. In particular, the entire elastic contribution comes from , where and are given by the instrumental resolution. Therefore only static or quasi-static structural and/or chemical disorder contributes to the quasi-elastic signal. For perfect, pure crystals no elastic signal is present far from the Bragg reflections; b) and are decoupled over a wide range of . Moreover, the frequency (energy) is essentially independent of the incident frequency (energy) . This allows access to high and/or high frequency transfers ( 20 THz) with good resolution in both and . Because of the highly collimated incident beam, high -resolution is easily obtained; c) the shape of the IXS instrumental energy resolution is not Gaussian as it is for a neutron triple-axis spectrometer, but Lorentzian. This strongly enhances the tails of both the elastic and inelastic signal, and tends to prohibit IXS from measuring phonons in the presence of a large elastic signal such as Bragg peaks or strong diffuse scattering. As a consequence, inelastic data are usually not available at the zone centre; d) in the case of high-energy optical branches in the cuprates, the relevant scattering is due to oxygen motion, while the relevant absorption cross section is due to neodymium. As a consequence, the signal from the high-energy optical branches, which is relatively low because of the terms of the dynamical structure factor and of the Bose term, is further depressed compared to the signal of the low-energy modes and the elastic signal, to which all the atoms contribute. The strongly enhanced tails of the elastic and low-energy inelastic signal (point c)) and Z contrast (point d)) above have posed great difficulties for IXS measurements of high-energy optical branches in transition metal oxides. We will show in the next section that we have been able to overcome these difficulties through a careful choice of thermodynamic and kinematic conditions.
2 Experiment and Results
The inelastic x-ray scattering experiment was carried out at the very-high-energy-resolution beam-line ID16 at the European Synchrotron Radiation Facility (ESRF). X-rays from an undulator source were monochromated using a Si (111) double-crystal monochromator, followed by a high-energy-resolution backscattering monochromator [20] operating at 15816 eV (Si (888) reflection order) and 17794 eV (Si (999) reflection order). A toroidal gold-coated mirror refocused the x-ray beam onto the sample, where a beam size of m2 full-width-half-maximum (FWHM) was obtained. The scattered photons were energy-analysed by a spherical silicon crystal analyser of 3 m radius, operating at the same Bragg reflection as the monochromator [21]. The total energy resolution was 1.6 THz (6.6 meV) FWHM for the Si (888) reflection and 1.1 THz (4.4 meV) FWHM for the Si (999) reflection. The momentum transfer was selected by rotating the 3 m spectrometer arm in the scattering plane perpendicular to the linear x-ray polarisation vector of the incident beam. For most of the scans, the momentum resolution was set to in both the horizontal and the vertical direction by an aperture of mm2 of the slits in front of the analyser. In order to achieve higher -resolution, for some selected scans we set the aperture to mm2 and mm2. Further experimental details are given elsewhere (see Ref. [20, 21] and references therein).
The samples are two single crystals grown by the travelling-solvent floating-zone method in 4 atm of at Stanford University: a crystal of the parent insulator and a crystal of the Ce-doped superconductor . The latter sample was oxygen-reduced after the growth and had a superconducting onset temperature of K. Further details are given elsewhere[22]. The samples are of very good crystalline quality. Initial characterisation work, performed on beam-line 7-2 at the Stanford Synchrotron Radiation Laboratory (SSRL), gave rocking curve widths of 0.02∘ (FWHM) around the direction.
The IXS experiment was performed in reflection geometry, and the probed scattering volume corresponded to about mm3. IXS scans were performed in the -224 THz range, in the , , and Brillouin zones.111All reciprocal lattice vectors are expressed in reciprocal lattice units. The samples were mounted on the cold finger of a closed-cycle helium cryostat, and cooled to 15 K. The low temperature and high momentum transfer were chosen so as to optimise the count rate on the high-frequency optical mode while limiting the loss of contrast due to the contribution from the tails of the intense low-frequency acoustic modes. The effect of lowering the temperature to 15 K and of the high momentum transfer is to enhance all the signals by the Debye–Waller factor, and to reduce the intensities of the low-energy (kT kTRT) phonons by the Bose factor. This is shown in Figs. 1 (a) and (b), which compare data obtained at 300 K and 15 K. We note that the main additional contribution at high energy transfers comes from the tail of the longitudinal acoustic (LA) mode (dashed line), which is strongly reduced at low temperature (see Fig. 1 (b)).
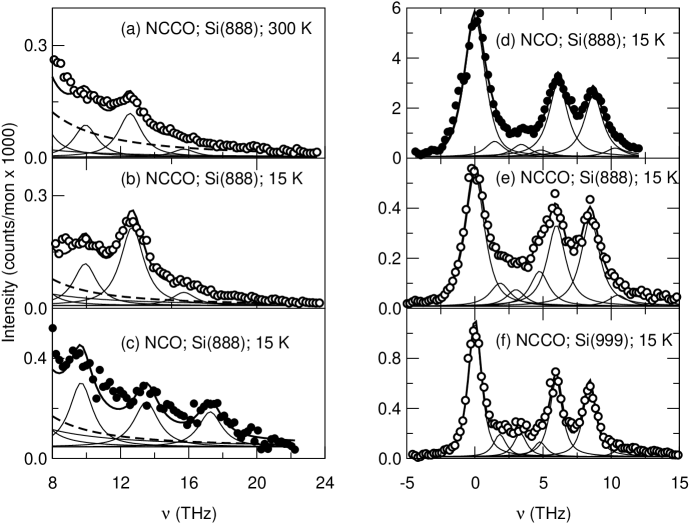
The two highest-energy modes for and at 15 K and at the reduced wave-vector are shown in Fig. 1 (b) and (c), respectively. We observe a shift towards lower energy from the parent antiferromagnetic insulator to the Ce-doped superconductor. The two highest LO branches are assigned to the Cu-O bond-stretching and O(2) vibration modes[2, 8], respectively. While this assignment is correct near the zone centre, its validity over the whole Brillouin zone is discussed in Sec. 3. However, for the sake of simplicity, we refer to the branches in this way in the text below.
In Fig. 1, we also show the low-energy acoustic and optical longitudinal modes at the zone-boundary (M point) in (d) and near the zone-boundary () in (e) and (f). In the doped specimen, measurements at the M-point were not possible because of the strong elastic signal at attributed to a secondary structural phase formed during the reduction procedure. Near the zone boundary, the strongest mode is expected to be the lowest-energy longitudinal optical mode. We observe the lowest optical mode near the zone-boundary around 6 THz in both undoped and doped . This observation is different from that previously reported for based on INS[1], where the same mode was found at lower frequency (about 4 THz). We note that in this frequency range, a very strong crystal field excitation is observed by INS[19]. In order to confirm our assignment we performed a scan with higher energy resolution, which is shown in Fig. 1 (f)222 Note that we observe three acoustic contributions (both longitudinal and transverse) at low frequency due to the finite Q-resolution of our experiment..
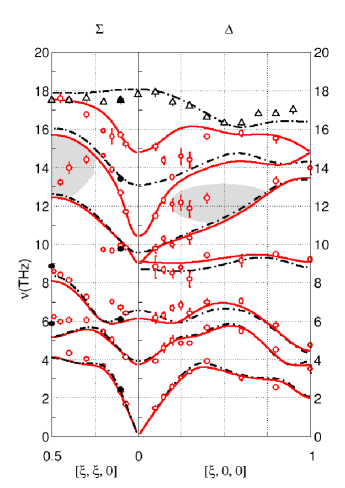
The frequencies of the peak positions extracted from these and many other scans along the main in-plane symmetry directions ( and ) are summarised in Fig. 2. The IXS results for () and () are shown together with the INS data for the highest Cu-O BS mode ()[1]. The lines are the results of a numerical calculation[22] based on a shell model, where the inter-atomic potentials are chosen following Ref. [23]. We simulated the phonon modes in the parent antiferromagnetic insulator by adding an unscreened Coulomb interaction (dot-dashed lines). The results reproduce very well the experimental dispersion of the undoped parent compound as measured by INS[1] and IXS. For the comparison with , following Ref. [23], we added a screened Coulomb interaction (solid lines) in order to simulate the effect of the free carriers introduced by doping[22] .
3 Discussion
The zone centre. — The shift at the zone centre of the high-energy phonon branches of with respect to is due to the closing of a large longitudinal optical - transverse optical (LO-TO) splitting (also known as Lyddane–Sachs–Teller splitting), which is very well reproduced by our numerical calculations. The corresponding and (or and ) branches in are separated by almost 3 THz at the zone centre, as observed by INS[1], while for undoped [23] the LO and TO branches are very close. Hence, there does not exist a similarly strong screening effect in for the high-energy in-plane LO modes[2]. The screening vector , which we found to be approximately , is comparable to the one estimated for [23].
Although our calculation with a screened Coulomb potential reproduces the closing of the LO-TO splitting, we still observe an anomalous additional softening of the highest LO branch near and above approximately which is not reproduced by our calculations (see Fig. 2).
(or ) line. — Along the line (; right side of Fig. 2), the highest LO branch softens in frequency by about 1.5 THz between and , which is a shift comparable to the anomalous shift observed in at = 0.25-0.3 [1, 3, 4]. Therefore, we believe that this anomalous softening is of the same nature as the one observed in p-type . For , the highest branch recovers rapidly. This behaviour is most likely due to an anti-crossing with the second highest branch which is mainly associated with vibrations of the O(2) atoms in the -direction. Therefore, within a standard anti-crossing framework, one should interpret the highest longitudinal intensities for and above as being mainly due to O(2) vibration. Within this scenario, the second-highest branch increases in frequency in the middle of the zone as in the un-doped compound. Thus, except for the fact that the LO-TO gap closes, this mode seems to be insensitive to doping. The LO bond-stretching mode just above is then found at rather low energies, 12 THz, with a flat dispersion, as has been reported for for [3] or [4], but can not be unambiguously followed to larger q-values. However, the measured intensities do not behave as expected for a simple anti-crossing picture (see Ref. [22]). In an anti-crossing scenario, one expects an exchange of character of the two branches, which would imply an exchange in the intensities. Instead, we observe an intensity that agrees with our calculation, which does not include any coupling between the modes, and hence does not allow for an anti-crossing. This appears to reflect the fact that we still lack a realistic model of the phonon anomaly. Furthermore, in the (,) region indicated by the shaded area, the dynamic structure factor is very weak and the mode of interest is closer to the tails of the low-energy modes. Therefore, we can not resolve broadening effects as in the hole-doped case[4, 6], or even band splitting[12, 13]. Consequently, with the present quality of IXS data, the position for the second-highest branch can only be defined as the centre-of-mass frequency in this (,) region.
(or ) line. — Along the line (or ; left side of Fig. 2), the softening of the highest LO branch between and is much less than that observed at . However, here we observe a softening of the second branch, down to 13 THz for . In the framework of the anti-crossing picture, this has to be interpreted as the softening of the Cu-O BS mode, but the same caution must be taken in the analysis of this lower-energy mode in the (Q,) region indicated by the shaded area as in the analysis of the mode along . However, we note that: i) due to the different symmetry of the orbitals involved in n- and p-type doping, it has been predicted that the bond-stretching mode would be particularly soft at the zone boundary[15], and ii) the second phase observed in the superconducting sample (see Sec. 2), with peaks at , may influence the dynamics near the zone boundary.
4 Conclusions
The present results on the in-plane longitudinal phonon dispersion in , when compared to undoped [1], show that the anomalous softening of the highest LO phonon mode previously observed in hole-doped compounds[1, 2, 3, 4, 5, 6] is also present in the electron-doped cuprates. This observation supports the hypothesis[1, 2, 3, 4, 5, 6] of an electron-phonon coupling origin of this feature.
These results furthermore demonstrate that high-energy resolution inelastic x-ray scattering has developed into an invaluable tool for the study of the lattice dynamics of complex transition metal oxides, allowing measurements on small single crystals which can not be studied by the traditional method of inelastic neutron scattering.
Acknowledgments
We acknowledge L. Paolasini and G. Monaco for useful discussions and H. Casalta for precious help during preliminary tests. The authors are grateful to D. Gambetti, C. Henriquet and R. Verbeni for technical help, to J.-L. Hodeau for help in the crystal orientation and J. -P. Vassalli for crystal cutting, and S. Larochelle and A. Mehta for assistance with the initial x-ray sample characterisation. The initial x-ray sample characterization was carried out at the Stanford Synchrotron Radiation Laboratory, a national user facility operated by Stanford University on behalf of the U.S. Department of Energy, Office of Basic Energy Sciences. P.K.M. and M.G. are supported by the U.S. Department of Energy under Contracts No. DE-FG03-99ER45773 and No. DE-AC03-76SF00515, by NSF CAREER Award No. DMR-9985067.
References
- [1] L. Pintschovius et al., Physica B174, 323 (1991).
- [2] L. Pintschovius and W. Reichardt, in Neutron Scattering in Layered Copper-Oxide Superconductors, ed. A. Furrer, Physics and Chemistry of Materials with Low-Dimensional Structures Vol. 20 (Kluwer Academic Publishers, Dordrecht, 1998) p. 165.
- [3] R.McQueeney et al., Phys. Rev. Lett. 82, 628 (1999).
- [4] L. Pintschovius and M. Braden, Phys. Rev. B60, R15039 (1999).
- [5] L. Pintschovius and M.Braden, J. Low Temp. Phys. 105, 813 (1996).
- [6] W. Reichardt, J. Low Temp. Phys. 105, 807 (1996).
- [7] Y. Petrov et al., cond-mat/0003414 (2000).
- [8] J.-G. Zhang et al., Phys. Rev. B43, 5389 (1991).
- [9] D. V. Fil et al., Phys. Rev. B45, 5633 (1992).
- [10] C.-Z. Wang et al., Phys. Rev. B59, R9278 (1999).
- [11] W. Reichardt and M. Braden Phisica B263-264, 416 (1999).
- [12] M. Braden et al., Europhys. Lett. 34, 531 (1996); M. Braden et al., cond-mat/0107498 (2001).
- [13] J.M. Tranquada et al., Phys. Rev. Lett. 88, 075505 (2002).
- [14] V. Meregalli and S. Y. Savrasov, Phys. Rev. B57, 14453 (1998).
- [15] P. W. Anderson, cond-mat/0201429 (2002).
- [16] Y. Tokura et al., Nature 337, 345 (1989).
- [17] N. P. Armitage et al., Phys. Rev. Lett. 87, 147003 (2001).
- [18] F. Sette et al., Physica Scripta T66, 48 (1996).
- [19] J. W. Lynn et al., Phys. Rev. Lett. 66, 919 (1991).
- [20] R. Verbeni et al., J. Synchrotron Radiation 3, 62 (1996).
- [21] C. Masciovecchio, et al., Nucl. Instr. and Meth. B111, 181 (1996).
- [22] M. d’Astuto et al. Phys. Rev. Lett. 88, 167002 (2002).
- [23] S. L. Chaplot et al., Phys. Rev. B52, 7230 (1995).