Angle-resolved photoemission spectroscopy of the cuprate superconductors111Reviews of Modern Physics, in press.
Abstract
The last decade witnessed significant progress in angle-resolved photoemission spectroscopy (ARPES) and its applications. Today, ARPES experiments with 2 meV energy resolution and angular resolution are a reality even for photoemission on solid systems. These technological advances and the improved sample quality have enabled ARPES to emerge as a leading tool in the investigation of the high- superconductors. This paper reviews the most recent ARPES results on the cuprate superconductors and their insulating parent and sister compounds, with the purpose of providing an updated summary of the extensive literature in this field. The low energy excitations are discussed with emphasis on some of the most relevant issues, such as the Fermi surface and remnant Fermi surface, the superconducting gap, the pseudogap and -wave-like dispersion, evidence of electronic inhomogeneity and nano-scale phase separation, the emergence of coherent quasiparticles through the superconducting transition, and many-body effects in the one-particle spectral function due to the interaction of the charge with magnetic and/or lattice degrees of freedom. Given the dynamic nature of the field, we chose to focus mainly on reviewing the experimental data, as on the experimental side a general consensus has been reached whereas interpretations and related theoretical models can vary significantly. The first part of the paper introduces photoemission spectroscopy in the context of strongly interacting systems, along with an update on the state-of-the-art instrumentation. The second part provides a brief overview of the scientific issues relevant to the investigation of the low energy electronic structure by ARPES. The rest of the paper is devoted to the review of experimental results from the cuprates and the discussion is organized along conceptual lines: normal-state electronic structure, interlayer interaction, superconducting gap, coherent superconducting peak, pseudogap, electron self energy and collective modes. Within each topic, ARPES data from the various copper oxides are presented.
I Introduction
The discovery of superconductivity at 30 K in the LaBaCuO ceramics by Bednorz and Müller (1986) has opened the era of high- superconductivity, changing the history of a phenomenon that had before been confined to very low temperatures [until 1986 the maximum value of was limited to the 23 K observed in Nb3Ge Gavaler (1973); Testardi et al. (1974)]. This unexpected result prompted intense activity in the field of ceramic oxides and has led to the synthesis of compounds with increasingly higher , all characterized by a layered crystal structure with one or more CuO2 planes per unit cell, and a quasi two-dimensional (2D) electronic structure. By 1987, a of approximately 90 K (i.e., higher than the boiling point of liquid nitrogen at 77 K) was already observed in YBa2Cu3O7-δ Wu et al. (1987). The record of 133.5 K (at atmospheric pressure) was later obtained in HgBa2Ca2Cu3O8+x Schilling et al. (1993).
One may wonder whether the impact of the discovery by Bednorz and Müller (1986) would have been somewhat overlooked if MgB2, with its recently ascertained 39 K , had already been discovered [Nagamatsu et al. (2001); for a review see: Day (2001)]. However, independent of the values of the observation of superconductivity in the ceramic copper oxides was in itself an unexpected and surprising result. In fact, ceramic materials are typically insulators, and this is also the case for the undoped copper oxides. However, when doped the latter can become poor metals in the normal state and high-temperature superconductors (HTSCs) upon reducing the temperature (see in Fig. 1 the phenomenological phase diagram of electron and hole-doped HTSCs, here represented by Nd2-xCexCuO4 and La2-xSrxCuO4 respectively).
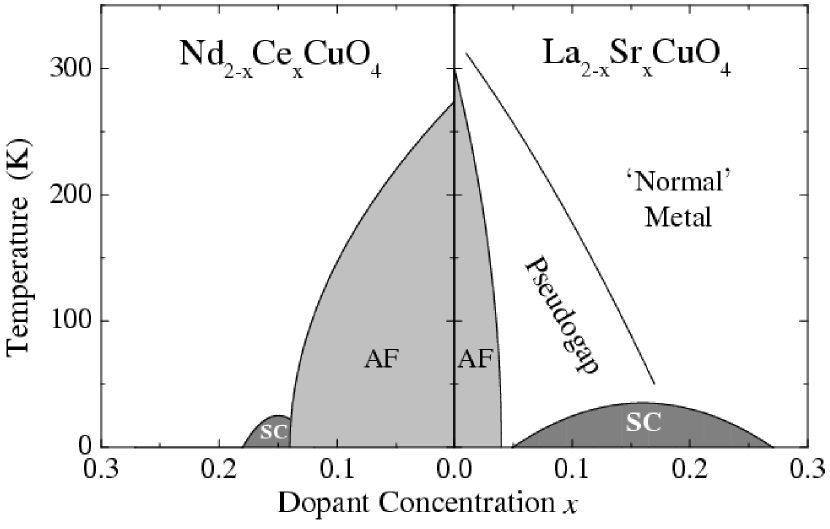
In addition, the detailed investigation of their phase diagram revealed that the macroscopic properties of the copper oxides are profoundly influenced by strong electron-electron correlations (i.e., large Coulomb repulsion ). Naively, this is not expected to favor the emergence of superconductivity for which electrons must be bound together to form Cooper pairs. Even though the approximate dependence of the resistivity observed in the overdoped metallic regime was taken as evidence for Fermi liquid (FL) behavior, the applicability of FL theory (which describes electronic excitations in terms of an interacting gas of renormalized quasiparticles, see Sec. II.3) to the ‘normal’ metallic state of HTSCs is questionable, because many properties do not follow canonical FL behavior Orenstein and Millis (2000). This breakdown of FL theory and of the single particle picture becomes most dramatic upon approaching the undoped line of the phase diagram ( in Fig. 1), where one finds the antiferromagnetic (AF) Mott insulator (see Sec. III).
Therefore, the cuprate HTSCs have attracted great interest not only for the application potential related to their high , but also for their scientific significance. This stems from the fact that the HTSCs highlight a major intellectual crisis in the quantum theory of solids which, in the form of one-electron band theory, has been very successful in describing good metals (like Cu) but has proven inadequate for strongly correlated electron systems. In turn, the Bardeen-Cooper-Schrieffer (BCS) theory [Bardeen et al. (1957); see also Schrieffer (1964)], which was developed for FL-like metals and has been so successful in describing conventional superconductors, does not seem to have the appropriate foundation for the description of high- superconductivity. In order to address the scope of the current approach in the quantum theory of solids and the validity of the proposed alternative models, a detailed comparison with experiments that probe the electronic properties and the nature of the elementary excitations is required.
In this context, angle-resolved photoemission spectroscopy (ARPES) plays a major role because it is the most direct method of studying the electronic structure of solids (see Sec. II). Its large impact on the development of many-body theories stems from the fact that this technique provides information on the single particle Green’s function, which can be calculated starting from a microscopic Hamiltonian. Driven by the demand, a significant improvement in instrumental resolution and detection efficiency has taken place over the last decade. Owing also to the continuously improved sample quality, the stage was set for ARPES to emerge as a leading experimental probe in the study of the HTSCs. Indeed, many of the ARPES results have broadly impacted the field Levi (1990, 1993, 1996); Mitton (1998, 1995), such as the observation of dispersive electronic features Takahashi et al. (1988); Olson et al. (1989), the discovery of the -wave superconducting gap Wells et al. (1992); Shen et al. (1993), and of the normal-state pseudogap Marshall et al. (1996); Loeser et al. (1996); Ding et al. (1996c).
In such a rapidly evolving field, one is always presented with a dilemma when deciding whether and how to write a review. On the one hand it may be premature to proceed with an extensive review, but on the other hand it is helpful for the broader community to have access to a summary of the current state of the subject. It is our intention to present a ‘snapshot’ of the investigation of the HTSCs by ARPES taken at the time of completion of this article. This will help the readers, especially those who are not photoemission experts, to sort through the extensive literature, learn about the outstanding problems, and become aware of the level of consensus. The downside is that some of the most recent results we will discuss may be outpaced by the rapid advance of the field. With this in mind, we limit the scope of our review to ARPES results only, without making detailed comparison with other techniques except when necessary. We will mainly focus on results reported after 1994, as on the previous period another extensive review paper is already available.222Shen and Dessau (1995). For more recent reviews see Randeria and Campuzano (1997); Lynch and Olson (1999); Tohyama and Maekawa (2000); Damascelli et al. (2001a); Golden et al. (2001); Johnson et al. (2001a); Kim (2001). In addition, because over the last two years we have witnessed a dramatic improvement of energy and especially momentum resolution with the introduction of the Scienta SES200 electron analyzer, more emphasis will be given to ARPES data obtained with this kind of spectrometer, whenever available. As this review paper will deal mostly with experimental results, we will refer only to those theoretical concepts and models which are explicitly relevant to the discussion of the ARPES data on the HTSCs. Furthermore, as the doping evolution is probably the best comparison between theory and experiment, we will discuss ARPES data on different HTSCs and on their insulating parent compounds focusing, in particular, on systematic changes in the electronic structure which may be relevant to the development of a comprehensive picture for the evolution from Mott insulator to overdoped superconductor.
II Angle-resolved photoemission spectroscopy
II.1 General description
Photoelectron spectroscopy is a general term which refers to all techniques based on the photoelectric effect originally observed by Hertz (1887). This was later explained as a manifestation of the quantum nature of light by Einstein (1905), who recognized that when light is incident on a sample an electron can absorb a photon and escape from the material with a maximum kinetic energy (where is the photon frequency and , the material work function, is a measure of the potential barrier at the surface that prevents the valence electrons from escaping, and is typically around 4-5 eV for metals). As a description of the spectroscopic techniques based on the detection of photoemitted electrons is beyond the scope of this review, we will only summarize those experimental and theoretical aspects which will be relevant to the discussion of the ARPES results presented in the course of the paper. For a more detailed description of ARPES and other photoelectron spectroscopies, we refer the reader to the extensive literature available on the subject.333A very detailed list of review articles and books dedicated to photoelectron spectroscopy on solids was recently given by Lynch and Olson (1999) in their book dealing with photoemission spectroscopy on high-temperature superconductors, and is here reproduced with some additions: Smith (1971); Eastman (1972); Carlson (1975); Feuerbacher and Willis (1976); Brundle and Baker (1977, 1978); Wertheim (1978); Cardona and Ley (1978); Ley and Cardona (1979); Mahan (1978); Feuerbacher et al. (1978); Nemoshkalenko and Aleshin (1979); Williams et al. (1980); Lindau and Spicer (1980); Inglesfield and Holland (1981); Wendin (1981); Leckey (1982); Plummer and Eberhardt (1982); Smith and Himpsel (1983); Margaritondo and Weaver (1983); Himpsel (1983); Courths and Hüfner (1984); Smith and Kevan (1991); Kevan (1992); Bachrach (1992); Shen and Dessau (1995); Hüfner (1995); Braun (1996); Grioni (2001).
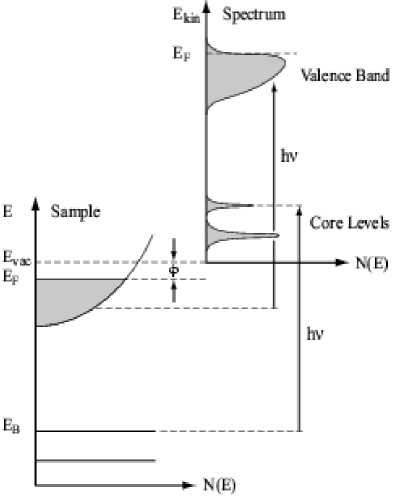
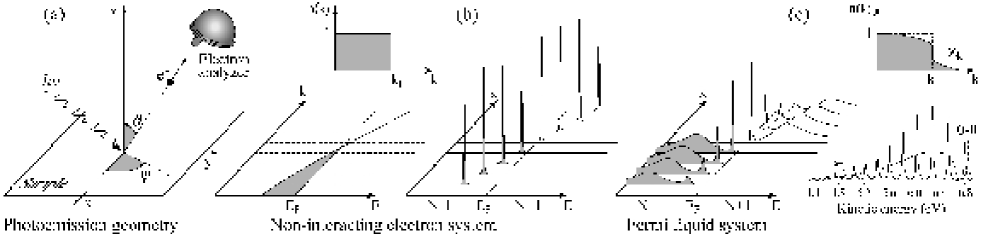
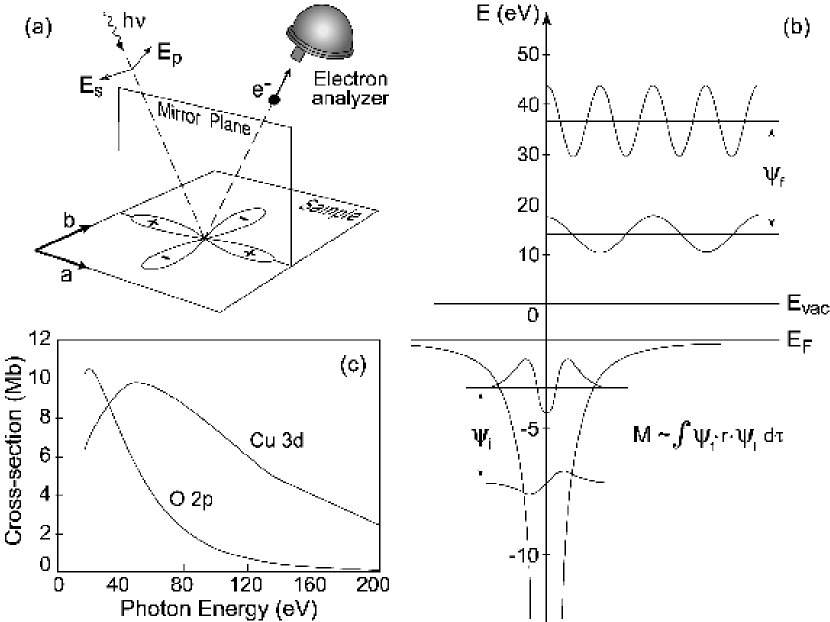
The energetics of the photoemission process and of the geometry of an ARPES experiment are sketched in Fig.2 and Fig.3a, respectively. A beam of monochromatized radiation supplied either by a gas-discharge lamp or by a synchrotron beamline is incident on a sample (which has to be a properly aligned single crystal, in order to perform momentum resolved measurements). As a result, electrons are emitted by the photoelectric effect and escape into the vacuum in all directions. By collecting the so-called photoelectrons with an electron energy analyzer characterized by a finite acceptance angle, one measures the kinetic energy of the photoelectrons for a given emission angle. This way, the photoelectron momentum is also completely determined: its modulus is given by and its components parallel and perpendicular to the sample surface are obtained from the polar () and azimuthal () emission angles.
Within the non-interacting electron picture and by taking advantage of total energy and momentum conservation laws (note that the photon momentum can be neglected at the low photon energies typically used in ARPES experiments), the kinetic energy and momentum of the photoelectron can be related to the binding energy and crystal-momentum inside the solid:
| (1) | |||||
| (2) |
Here is the component parallel to the surface of the electron crystal momentum in the extended zone scheme. Upon going to larger angles, one actually probes electrons with k lying in higher-order Brillouin zones. By subtracting the corresponding reciprocal lattice vector G, the reduced electron crystal momentum in the first Brillouin zone is obtained. Note that the perpendicular component of the wave vector is not conserved across the sample surface due to the lack of translational symmetry along the surface normal.
This implies that, in general, even experiments performed for all (i.e., by collecting photoelectrons at all possible angles) will not allow a complete determination of the total crystal wave vector [unless some a priori assumption is made for the dispersion of the electron final states involved in the photoemission process]. However, several specific experimental methods for absolute three dimensional band mapping have also been developed [see, e.g., Hüfner (1995); Strocov et al. (1997, 1998)].
A particular case in which the uncertainty in is less relevant is that of the low-dimensional systems characterized by an anisotropic electronic structure and, in particular, a negligible dispersion along the axis (i.e., along the surface normal, see Fig. 3a). The electronic dispersion is then almost exclusively determined by , as in the case of the 2D copper oxide superconductors which we will focus on throughout this paper [note, however, that possible complications arising from a finite three-dimensionality of the initial and/or final states involved in the photoemission process should always be carefully considered Lindroos et al. (2002)]. As a result, one can map out in detail the electronic dispersion relations simply by tracking, as a function of , the energy position of the peaks detected in the ARPES spectra for different take off angles (as in Fig. 3b, where both direct and inverse photoemission spectra for a single band dispersing through the Fermi energy are shown). Furthermore, as an additional bonus of the lack of dispersion, one can directly identify the width of the photoemission peaks with the lifetime of the photohole Smith et al. (1993), which contains information on the intrinsic correlation effects of the system and is formally described by the imaginary part of the electron self energy (see Sec. II.3). On the contrary, in 3D systems the linewidth contains contributions from both photohole and photoelectron lifetimes, with the latter reflecting final state scattering processes and thus the finite probing depth; as a consequence, isolating the intrinsic many-body effects becomes a much more complicated problem.
Before moving on to the discussion of some theoretical issues, it is worth pointing out that most of the ARPES experiments are performed at photon energies in the ultraviolet (in particular for eV). The main reason is that by working at lower photon energies it is possible to achieve higher energy and momentum resolution. This is easy to see for the case of the momentum resolution which, from Eq. 2 and neglecting the contribution due to the finite energy resolution, is given by:
| (3) |
where corresponds to the finite acceptance angle of the electron analyzer. From Eq. 3 it is clear that the momentum resolution will be better at lower photon energy (i.e., lower ), and for larger polar angles (note that one can effectively improve the momentum resolution by extending the measurements to momenta outside the first Brillouin zone). By working at low photon energies there are also some additional advantages: first, for a typical beamline it is easier to achieve high energy resolution (see Sec. II.5); second, one can completely disregard the photon momentum in Eq. 2, as for 100 eV photons the momentum is 3% (0.05 Å-1) of the typical Brillouin zone size of the cuprates ( Å-1), and at 21.2 eV (the HeI line typically used on ARPES systems equipped with a gas-discharge lamp) it is only 0.5% (0.008 Å-1). If on the contrary the photon momentum is not negligible, the photoemission process does not involve vertical transitions and must be explicitly taken into account in Eq. 2. For example, for 1487 eV photons (the Al Kα line commonly used in X-ray photoemission) Å-1 that corresponds to 50% of the zone size.
A major drawback of working at low photon energies is the extreme surface sensitivity. The mean free path for unscattered photoelectrons is characterized by a minimum of approximately 5 Å at 20-100 eV kinetic energies Seah and Dench (1979), which are typical values in ARPES experiments. This means that a considerable fraction of the total photoemission intensity will be representative of the topmost surface layer, especially on systems characterized by a large structural/electronic anisotropy and, in particular, by relatively large -axis lattice parameters, such as the cuprates. Therefore, in order to learn about the bulk electronic structure ARPES experiments have to be performed on atomically clean and well-ordered systems, which implies that fresh and flat surfaces have to be ‘prepared’ immediately prior to the experiment in ultra-high vacuum conditions (typically at pressures lower than 5 torr). So far, the best ARPES results on copper oxide superconductors were obtained on samples cleaved in situ, which however requires a natural cleavage plane for the material under investigation and explains why not all the cuprates are suitable for ARPES experiments.
II.2 Three-step model and sudden approximation
To develop a formal description of the photoemission process, one has to calculate the transition probability for an optical excitation between the -electron ground state and one of the possible final states . This can be approximated by Fermi’s golden rule:
| (4) |
where and are the initial and final-state energies of the -particle system ( is the binding energy of the photoelectron with kinetic energy and momentum ). The interaction with the photon is treated as a perturbation given by:
| (5) |
where p is the electronic momentum operator and A is the electromagnetic vector potential (note that the gauge was chosen for the scalar potential , and the quadratic term in was dropped because in the linear optical regime it is typically negligible with respect to the linear terms). In Eq. 5 we also made use of the commutator relation and dipole approximation [i.e., A constant over atomic dimensions and therefore , which holds in the ultraviolet]. Although this is a routinely used approximation, it should be noted that might become important at the surface where the electromagnetic fields may have a strong spatial dependence, giving rise to a significant intensity for indirect transitions. This surface photoemission contribution, which is proportional to () where is the medium dielectric function, can interfere with the bulk contribution resulting in asymmetric lineshapes for the bulk direct-transition peaks.444For more details on the surface photoemission effects see: Feuerbacher et al. (1978); Miller et al. (1996); Hansen et al. (1997b, a). At this point, a more rigorous approach is to proceed with the so-called one-step model in which photon absorption, electron removal, and electron detection are treated as a single coherent process.555See for example Mitchell (1934); Makinson (1949); Buckingham (1950); Mahan (1970); Schaich and Ashcroft (1971); Feibelman and Eastman (1974); Pendry (1976, 1975); Liebsch (1976, 1978); Lindroos and Bansil (1995, 1996); Bansil and Lindroos (1995, 1998, 1999). In this case bulk, surface, and vacuum have to be included in the Hamiltonian describing the crystal, which implies that not only bulk states have to be considered, but also surface and evanescent states, and surface resonances. However, due to the complexity of the one-step model, photoemission data are usually discussed within the three-step model that, although purely phenomenological, has proven to be rather successful Fan (1945); Berglund and Spicer (1964); Feibelman and Eastman (1974). Within this approach, the photoemission process is subdivided into three independent and sequential steps:
-
(i)
Optical excitation of the electron in the bulk.
-
(ii)
Travel of the excited electron to the surface.
-
(iii)
Escape of the photoelectron into vacuum.
The total photoemission intensity is then given by the product of three independent terms: the total probability for the optical transition, the scattering probability for the travelling electrons, and the transmission probability through the surface potential barrier. Step (i) contains all the information about the intrinsic electronic structure of the material and will be discussed in detail below. Step (ii) can be described in terms of an effective mean free path, proportional to the probability that the excited electron will reach the surface without scattering (i.e, with no change in energy and momentum). The inelastic scattering processes, which determine the surface sensitivity of photoemission (as discussed in the previous section), also give rise to a continuous background in the spectra which is usually ignored or subtracted. Step (iii) is described by a transmission probability through the surface, which depends on the energy of the excited electron and the material work function .
In evaluating step (i), and therefore the photoemission intensity in terms of the transition probability , it would be convenient to factorize the wavefunctions in Eq. 4 into photoelectron and -electron terms, as we have done for the corresponding energies. This however is far from trivial because during the photoemission process itself the system will relax. The problem simplifies within the sudden approximation, which is extensively used in many-body calculations of the photoemission spectra from interacting electron systems, and is in principle applicable only to high kinetic-energy electrons. In this limit, the photoemission process is assumed to be sudden, with no post-collisional interaction between the photoelectron and the system left behind (in other words, an electron is instantaneously removed and the effective potential of the system changes discontinuously at that instant). The final state can then be written as:
| (6) |
where is an antisymmetric operator that properly antisymmetrizes the -electron wavefunction so that the Pauli principle is satisfied, is the wavefunction of the photoelectron with momentum , and is the final state wavefunction of the -electron system left behind, which can be chosen as an excited state with eigenfunction and energy . The total transition probability is then given by the sum over all possible excited states . Note, however, that the sudden approximation is inappropriate for low kinetic energy photoelectrons, which may need longer than the system response time to escape into vacuum. In this case, the so-called adiabatic limit, one can no longer factorize in two independent parts and the detailed screening of photoelectron and photohole has to be taken into account Gadzuk and Šunjić (1975). It is important to mention that, however, there is evidence that the sudden approximation is justified for the cuprate HTSCs even at photon energies as low as 20 eV [Randeria et al. (1995); Sec. II.3].
For the initial state, let us first assume for simplicity that is a single Slater determinant (i.e., Hartree-Fock formalism), so that we can write it as the product of a one-electron orbital and an -particle term:
| (7) |
More generally, however, should be expressed as , where is the annihilation operator for an electron with momentum . This also shows that is not an eigenstate of the particle Hamiltonian, but is just what remains of the -particle wavefunction after having pulled out one electron. At this point, we can write the matrix elements in Eq. 4 as:
| (8) |
where is the one-electron dipole matrix element, and the second term is the -electron overlap integral. Here, we replaced with an eigenstate , as discussed above. The total photoemission intensity measured as a function of at a momentum , namely , is then proportional to:
| (9) |
where is the probability that the removal of an electron from state will leave the -particle system in the excited state . From here we see that, if for one particular , the corresponding will be unity and all the others zero; in this case, if also , the ARPES spectra will be given by a delta function at the Hartree-Fock orbital energy , as shown in Fig. 3b (i.e., non-interacting particle picture). In the strongly correlated systems, however, many of the will be different from zero because the removal of the photoelectron results in a strong change of the system effective potential and, in turn, will have an overlap with many of the eigenstates . Therefore, the ARPES spectra will not consist of single delta functions but will show a main line and several satellites according to the number of excited states created in the process (Fig. 3c).
This is very similar to the situation encountered in photoemission from molecular hydrogen Siegbahn et al. (1969) in which not simply a single peak but many lines separated by few tenths of eV from each other are observed (solid line in Fig. 3c, bottom right). These so-called ‘shake-up’ peaks correspond to the excitations of the different vibrational states of the H molecule. In the case of solid hydrogen (dashed line in Fig. 3c, bottom right), as discussed by Sawatzky (1989), the vibrational excitations would develop in a broad continuum while a sharp peak would be observed for the fundamental transition (from the ground state of the H2 to the one of the H molecule). Note that the fundamental line would also be the only one detected in the adiabatic limit, in which case the -particle system is left in its ground state.
II.3 One-particle spectral function
In the discussion of photoemission on solids, and in particular on the correlated electron systems in which many in Eq. 9 are different from zero, the most powerful and commonly used approach is based on the Green’s function formalism.666See for example: Abrikosov et al. (1965); Hedin and Lundqvist (1969); Fetter and Walecka (1971); Mahan (1981); Economou (1983); Rickayzen (1991). In this context, the propagation of a single electron in a many-body system is described by the time-ordered one-electron Green’s function , which can be interpreted as the probability amplitude that an electron added to the system in a Bloch state with momentum at a time zero will still be in the same state after a time . By taking the Fourier transform, can be expressed in energy-momentum representation resulting in , where and are the one-electron addition and removal Green’s function, respectively. At :
| (10) |
where the operator () creates (annihilates) an electron with energy , momentum , and spin in the -particle initial state , the summation runs over all possible -particle eigenstates with eigenvalues , and is a positive infinitesimal (note also that from here on we will take ). In the limit one can make use of the identity , where denotes the principle value, to obtain the one-particle spectral function , with:
| (11) |
and , which defines the retarded Green’s function. Note that and define the one-electron removal and addition spectra which one can probe with direct and inverse photoemission, respectively. This is evidenced, for the direct case, by the comparison between the expression for and Eq. 9 for the photoemission intensity (note that in the latter and the energetics of the photoemission process has been explicitly accounted for). Finite temperatures effect can be taken into account by extending the Green’s function formalism just introduced to [see, e.g., Mahan (1981)]. In the latter case, by invoking once again the sudden approximation the intensity measured in an ARPES experiment on a 2D single-band system can be conveniently written as:
| (12) |
where is the in-plane electron momentum, is the electron energy with respect to the Fermi level, and is proportional to the squared one-electron matrix element and therefore depends on the electron momentum, and on the energy and polarization of the incoming photon. We also introduced the Fermi function which accounts for the fact that direct photoemission probes only the occupied electronic states. Note that in Eq. 12 we neglected the presence of any extrinsic background and the broadening due to finite energy and momentum resolution, which however have to be carefully considered when performing a quantitative analysis of the ARPES spectra (Sec. II.4 and Eq. 21).
The corrections to the Green’s function originating from electron-electron correlations can be conveniently expressed in terms of the electron proper self energy . Its real and imaginary part contain all the information on the energy renormalization and lifetime, respectively, of an electron with band energy and momentum propagating in a many-body system. The Green’s and spectral functions expressed in terms of the self energy are then given by:
| (13) |
| (14) |
It is worth emphasizing that because is a linear response function to an external perturbation, the real and imaginary parts of its Fourier transform have to satisfy causality and, therefore, are related by Kramers-Kronig relations. This implies that if the full is available from photoemission and inverse photoemission, one can calculate and then obtain both the real and imaginary parts of the self energy directly from Eq. 13. However, due to the lack of high-quality inverse photoemission data, this analysis is usually performed only using ARPES spectra by taking advantage of certain approximations Norman et al. (1999). This will be discussed in more detail in Sec. VIII together with other practical methods used to estimate the self-energy corrections.
In general, the exact calculation of and, in turn, of is an extremely difficult task. In the following, as an example we will briefly consider the interacting FL case Landau (1956, 1957, 1959). Let us start from the trivial non-interacting case. The -particle eigenfunction is a single Slater determinant and we always end up in a single eigenstate when removing or adding an electron with momentum . Therefore, has only one pole for each , and consists of a single line at the band energy (as in Fig. 3b). In this case, the occupation numbers are good quantum numbers and for a metallic system the momentum distribution [i.e., the expectation value , quite generally independent of the spin for nonmagnetic systems], is characterized by a sudden drop from 1 to 0 at (Fig. 3b, top), which defines a sharp Fermi surface (FS). If we now switch on the electron-electron correlation adiabatically, (so that the system remains at equilibrium), any particle added into a Bloch state has a certain probability of being scattered out of it by a collision with another electron, leaving the system in an excited state in which additional electron-hole pairs have been created. The momentum distribution will now show a discontinuity smaller than 1 at and a finite occupation probability for even at (Fig. 3c, top). As long as shows a finite discontinuity at , we can describe the correlated Fermi sea in terms of well defined quasiparticles, i.e. electrons dressed with a manifold of excited states, which are characterized by a pole structure similar to the one of the non-interacting system but with renormalized energy and mass , and a finite lifetime . In other words, the properties of a FL are similar to those of a free electron gas with damped quasiparticles. As the bare-electron character of the quasiparticle or pole strength (also called coherence factor) is and the total spectral weight must be conserved (see Eq. 19), we can separate and into a coherent pole part and an incoherent smooth part without poles Pines and Nozires (1966):
| (15) |
| (16) |
where , , , and the self energy and its derivatives are evaluated at . It should be emphasized that the FL description is valid only in proximity to the FS and rests on the condition for small and . Furthermore, for a FL system in two or more dimensions Luttinger (1961); Pines and Nozires (1966), although additional logarithmic corrections should be included in the two-dimensional case Hodges et al. (1971). By comparing the electron removal and addition spectra for a FL of quasiparticles with those of a non-interacting electron system (in the lattice periodic potential), the effect of the self-energy correction becomes evident (see Fig. 3c and 3b, respectively). The quasiparticle peak has now a finite lifetime (due to ), and it sharpens up rapidly thus emerging from the broad incoherent component upon approaching the Fermi level, where the lifetime is infinite corresponding to a well defined quasiparticle [note that the coherent and incoherent part of represent the main line and satellite structure discussed in the previous section and shown in Fig. 3c, bottom right]. Furthermore, the peak position is shifted with respect to the bare band energy (due to ): as the quasiparticle mass is larger than the band mass because of the dressing (), the total dispersion (or bandwidth) will be smaller ().
Given that many of the normal state properties of the cuprate HTSCs do not follow the canonical FL behavior, it is worth illustrating the marginal Fermi liquid (MFL) model, which was specifically proposed as a phenomenological characterization of the HTSCs and will be referred to in Sec. VIII.2.2 Varma et al. (1989, 1990); Abrahams and Varma (2000). In particular, the motivation of the MFL description was to account for the anomalous response observed at optimal doping in, e.g., electrical resistivity, Raman scattering intensity, and nuclear spin relaxation rate. The MFL assumptions are as follows: (i) there are momentum independent excitations over most of the Brillouin zone that contribute to spin and charge polarizability ; (ii) the latter has a scale invariant form as a function of frequency and temperature, namely . To visualize the implications of this approach, we compare the MFL and FL self energy, neglecting for simplicity any momentum dependence:
| (17) |
| (18) |
Here , , is an ultraviolet cutoff, and is a coupling constant (which could in principle be momentum dependent). From Eq. 17 and 18 at we see that, while in a FL the quasiparticles are well defined because vanishes as for and is finite at , in a MFL is only marginally singular for , and there are no FL-like quasiparticles because vanishes as at the FS (in turn, for the corresponding Green’s and spectral functions are entirely incoherent). As for a MFL description of the HTSCs, note that from Eq. 18 one obtains a contribution linear in to the electrical resistivity (i.e., ), consistent with experiments at optimal doping. Furthermore, the MFL self energy has been used for the lineshape analysis of the ARPES spectra from Bi2Sr2CaCu2O8+δ [Bi2212; see Sec. VIII.2.2 and Abrahams and Varma (2000)]. As a last remark, it should be emphasized that the scale invariant low-energy excitation spectrum assumed in the MFL model is characteristic of fluctuations associated with a quantum critical point, as also discussed for the HTSCs at optimal doping Varma et al. (1989); Varma (1999).
Among the general properties of the spectral function there are also several sum rules. A fundamental one, which in discussing the FL model was implicitly used to state that and (where and refer to coherent and incoherent parts of the spectral function, respectively), is:
| (19) |
which reminds us that describes the probability of removing/adding an electron with momentum k and energy to a many-body system. However, as it also requires the knowledge of the electron addition part of the spectral function, it is not so useful in the analysis of ARPES data. A sum rule more relevant to this task is:
| (20) |
which solely relates the one-electron removal spectrum to the momentum distribution . When electronic correlations are important and the occupation numbers are no longer good quantum numbers, the discontinuity at is reduced (as discussed for the FL case) but a drop in is usually still observable even for strong correlations Nozières (1964).
Note, however, that great care is necessary in making use of Eq. 20 because the integral of Eq. 12 does not give simply but rather . Nevertheless, by tracking in momentum space the loci of steepest descent of the experimentally determined , i.e. the maxima in , it has been possible to identify not only the FS in Bi2212 [Campuzano et al. (1996); Sec. IV.3] but also the remnant-FS in the insulating parent compound Ca2CuO2Cl2 [Ronning et al. (1998); Sec. IV.1.2].777For a more extended discussion on the different methods typically used to experimentally determine the FS, see: Straub et al. (1997); Kipp et al. (1999); Rossnagel et al. (2001).
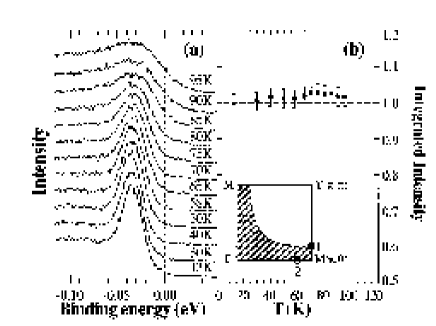
An approximate sum rule was proposed by Randeria et al. (1995) under the assumptions that at low energies , and does not have significant dependence on and (the dependence on or A in this case will appear to be irrelevant). It states that is independent of temperature (note that here necessarily, as for k near but not equal to , different dependence is expected for states below and above the chemical potential). This approximate sum rule was tested on temperature dependent ARPES spectra taken on Bi2212 at near (,0) which, as we will discuss in detail in Sec. VI.1, are characterized by a remarkable change in lineshape below the superconducting phase transition (Fig. 4a). Indeed, as shown in Fig. 4b, the integrated intensity of the ARPES spectra is temperature independent, which not only satisfies the sum rule but also suggests the validity of the sudden approximation for Bi2212 even at 19 eV photon energy (since it is on this approximation that Eq. 12 and the above analysis rest). It was also noted that, as the low energy spectral weight in all the quasi 2D copper oxides is mostly representative of the electronic states belonging to the CuO2 planes (Cu 3 and O 2), the validity of the sudden approximation at this relatively low photon energy and, in turn, of the interpretation of the ARPES spectra (Eq. 12), should be regarded as a general property of this class of compounds Randeria et al. (1995).
II.4 Matrix elements and finite resolution effects
As discussed in the previous section and summarized by Eq. 12, ARPES directly probes the one-particle spectral function . However, in extracting quantitative information from the experiment, not only the effect of the matrix element term has to be taken into account, but also the finite experimental resolution and the extrinsic continuous background due to the secondaries (those electrons which escape from the solid after having suffered inelastic scattering events and, therefore, with a reduced ). The latter two effects may be explicitly accounted for by considering a more realistic expression for the photocurrent :
| (21) |
which consists of the convolution of Eq. 12 with energy () and momentum () resolution functions [ is typically a Gaussian, may be more complicated], and of the background correction B.
Of the several possible forms for the background function B Hüfner (1995), two are more frequently used: (i) the step-edge background (with three parameters for height, energy position, and width of the step-edge), which reproduces the background observed all the way to in an unoccupied region of momentum space; (ii) the Shirley background , which allows one to extract from the measured photocurrent the contribution due to the unscattered electrons [here the only parameter is the constant ; Shirley (1972)].
Let us now very briefly illustrate the effect of the matrix element term , which is responsible for the dependence of the photoemission data on photon energy and experimental geometry, and may even result in complete suppression of the intensity Gobeli et al. (1964); Dietz et al. (1976); Hermanson (1977); Eberhardt and Himpsel (1980). By using the commutation relation , we can write , where is a unit vector along the polarization direction of the vector potential A. As in Fig 5a, let us consider photoemission from a orbital, with the detector located in the mirror plane (when the detector is out of the mirror plane, the problem is more complicated because of the lack of an overall well defined even/odd symmetry). In order to have non vanishing photoemission intensity, the whole integrand in the overlap integral must be an even function under reflection with respect to the mirror plane. Because odd parity final states would be zero everywhere on the mirror plane and therefore also at the detector, the final state wavefunction itself must be even. In particular, at the detector the photoelectron is described by an even parity plane-wave state with momentum in the mirror plane and fronts orthogonal to it Hermanson (1977). In turn, this implies that must be even. In the case depicted in Fig 5a where is also even, the photoemission process is symmetry allowed for A even or in-plane (i.e., depends only on in-plane coordinates and is therefore even under reflection with respect to the plane) and forbidden for A odd or normal to the mirror plane (i.e., is odd as it depends on normal-to-the-plane coordinates). Following the notations of Mesot et al. (2001b), for a generic initial state of either even or odd symmetry with respect to the mirror plane, the polarization conditions resulting in an overall even matrix element can be summarized as:
| (22) |
In order to discuss the photon energy dependence, from Eq. 5 and by considering a plane wave for the photoelectron at the detector, one may more conveniently write . The overlap integral, as sketched in Fig 5b, strongly depends on the details of the initial state wavefunction (peak position of the radial part and oscillating character of it), and on the wavelength of the outgoing plane wave. Upon increasing the photon energy, both and k increase, and changes in a non-necessarily monotonic fashion (see Fig 5c, for the Cu 3 and the O 2 atomic case). In fact, the photoionization cross section is usually characterized by one minimum in free atoms, the so-called Cooper minimum Cooper (1962), and a series of them in solids Molodtsov et al. (2000).
Before concluding this section, it has to be emphasized that the description of photoemission based on the sudden approximation and the three-step model, although artificial and oversimplified, allows an intuitive understanding of the process. However, for a quantitative analysis of the ARPES spectra, calculations based on the one-step model are generally required. In this case, surface discontinuity, multiple scattering, finite lifetime effects, and also matrix elements for initial and final state crystal wavefunctions are included and accounted for by first principle calculations, as we will discuss in Sec. IV.3 for the case of Bi2212 Bansil and Lindroos (1999).
II.5 State-of-the-art photoemission
In the early stages of the investigation of the HTSCs, ARPES proved to be very successful in detecting dispersive electronic features Takahashi et al. (1988); Olson et al. (1989, 1990), the -wave superconducting gap Shen et al. (1993), and the normal state pseudogap Marshall et al. (1996); Loeser et al. (1996); Ding et al. (1996c). Over the past decade, a great deal of effort has been invested in further improving this technique.
This resulted in an order of magnitude improvement in both energy and momentum resolution, thus ushering in a new era in electron spectroscopy and allowing a detailed comparison between theory and experiment. The reasons for this progress are twofold: the availability of dedicated photoemission beamlines on high-flux second and third generation synchrotron facilities [for a description of synchrotron radiation technology and applications see Koch et al. (1991)], and the development of the Scienta electron spectrometers Beamson et al. (1990); Martensson et al. (1994).
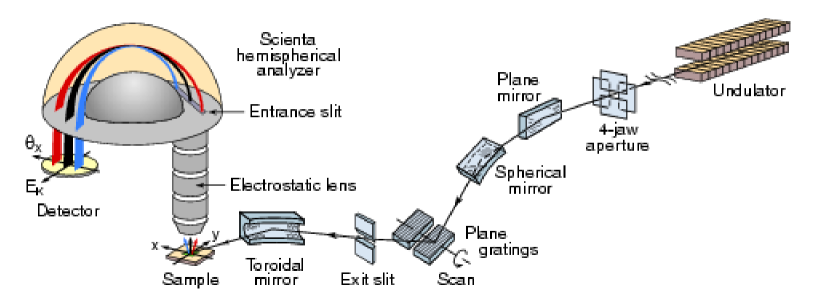
The configuration of a generic angle-resolved photoemission beamline is shown in Fig. 6.
A beam of white radiation is produced in a wiggler or an undulator (so-called ‘insertion devices’, these are the straight sections of the electron storage ring where radiation is produced), is monochromatized at the desired photon energy by a grating monochromator, and is focused on the sample. Alternatively, a gas-discharge lamp can be used as a radiation source (once properly monochromatized, to avoid complications due to the presence of different satellites and refocused to a small spot size, essential for high angular resolution). However, synchrotron radiation offers important advantages: it covers a wide spectral range (from the visible to the X-ray region) with an intense and highly polarized continuous spectrum, while a discharge lamp provides only a few unpolarized resonance lines at discrete energies. Photoemitted electrons are then collected by the analyzer, where kinetic energy and emission angle are determined (the whole system is in high vacuum at pressures lower than 5 torr).
A conventional hemispherical analyzer consists of a multi-element electrostatic input lens, a hemispherical deflector with entrance and exit slits, and an electron detector (i.e., a channeltron or a multi-channel detector). The heart of the analyzer is the deflector which consists of two concentric hemispheres (of radius and ). These are kept at a potential difference , so that only those electrons reaching the entrance slit with kinetic energy within a narrow range centered at will pass through this hemispherical capacitor, thus reaching the exit slit and then the detector. This way it is possible to measure the kinetic energy of the photoelectrons with an energy resolution given by , where , is the width of the entrance slit, and is the acceptance angle. The role of the electrostatic lens is that of decelerating and focusing the photoelectrons onto the entrance slit. By scanning the lens retarding potential one can effectively record the photoemission intensity versus the photoelectron kinetic energy. One of the innovative characteristics of the Scienta analyzer is the two-dimensional position-sensitive detector consisting of two micro-channel plates and a phosphor plate in series, followed by a CCD camera.

In this case, no exit slit is required: the electrons, spread apart along the axis of the detector (Fig. 6) as a function of their kinetic energy due to the travel through the hemispherical capacitor, are detected simultaneously [in other words, a range of electron energies is dispersed over one dimension of the detector and can be measured in parallel; scanning the lens voltage is in principle no longer necessary, at least for narrow energy windows (a few percent of )]. Furthermore, contrary to a conventional electron analyzer in which the momentum information is averaged over all the photoelectrons within the acceptance angle (typically ), the Scienta system can be operated in angle-resolved mode, which provides energy-momentum information not only at a single -point but along an extended cut in -space. In particular, the photoelectrons within an angular window of along the direction defined by the analyzer entrance slit are focused on different positions on the detector (Fig. 6). It is thus possible to measure multiple energy distribution curves simultaneously for different photoelectron angles, obtaining a 2D snapshot of energy versus momentum (Fig. 7).
The Scienta SES200 analyzer ( mm) typically allows energy and angular resolutions of approximately a few meV and , respectively (for the 21.2 eV photons of the HeI line, as one can obtain from Eq. 2, 0.2∘ corresponds to 1% of the cuprates’ Brillouin-zone edge ). Note, however, that in estimating the total energy resolution achievable on a beamline one has to take into account also of the monochromator, which can be adjusted with entrance and exit slits (the ultimate resolution a monochromator can deliver is given by its resolving power ; it can be as good as 1-2 meV for 20 eV photons but worsens upon increasing photon energy). To maximize the signal intensity at the desired total , monochromator and analyzer should be operated at comparable resolutions.
To date, one of the most impressive examples of high energy resolution for a photoemission experiment on a solid sample was reported by Yokoya et al. (2000), who performed photoemission measurements on the Ni borocarbides in a system equipped with a Scienta SES2002 electron analyzer (newer version of the SES200), and a Gammadata high-flux discharge lamp combined with a toroidal grating monochromator. With this system, capable of an energy resolution of 1.5 meV, Yokoya et al. (2000) measured angle-integrated photoemission spectra with 2.0 meV resolution on YNi2B2C and Y(Ni0.8Pt0.2)2B2C, which are characterized by a superconducting transition at 15.4 and 12.1 K, respectively (see Fig. 8). Due to the extremely high resolution, they successfully detected the opening of the small superconducting gap, as evidenced by the shift to high binding energies of the 6 K spectra leading-edge midpoint (which is instead located at at 20 K, as expected for a metal), and by the appearance of a peak below which directly reflects the piling up of the density of states due to the gap opening. By a detailed analysis, the authors could conclude in favor of an anisotropic -wave superconducting gap with and 1.5 meV in the pure and Pt-doped samples, respectively.
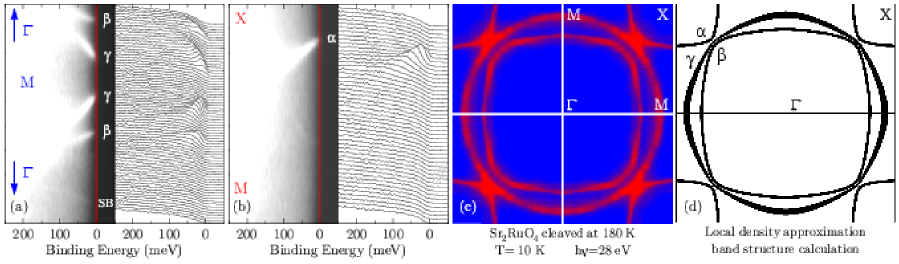
It has to be emphasized that, when angle resolved experiments are performed, one has to compromise the energy resolution to improve the angular resolution. Therefore, in angle resolved experiments, is typically set in the range of 5-20 meV. To illustrate the capability of state-of-the-art ARPES and how critical the improvement in angle resolution has been, the novel superconductor Sr2RuO4 is a particularly good example. This system is isostructural to the archetypal cuprate parent compound La2CuO4 (see Fig. 11), but RuO2 planes replace the CuO2 planes. Its low-energy electronic structure, as predicted by band-structure calculations is characterized by three bands crossing the chemical potential Singh (1995); Oguchi (1995). These define a complex FS comprised of two electron pockets and one hole pocket (Fig. 9d), which have been clearly observed in de Haas-van Alphen experiments Mackenzie et al. (1996); Bergemann et al. (2000). On the other hand, early photoemission measurements suggested a different topology Yokoya et al. (1996a, b); Lu et al. (1996), which generated a certain degree of controversy in the field Puchkov et al. (1998). This issue was conclusively resolved only by taking advantage of the high energy and momentum resolution of the ‘new generation’ of ARPES data: it was then recognized that a surface reconstruction Matzdorf et al. (2000) and, in turn, the detection of several direct and folded surface bands were responsible for the conflicting interpretations Damascelli et al. (2000, 2001b, 2001c); Shen et al. (2001a). Fig. 9a,b show high resolution ( meV, % of the zone edge) ARPES data taken at 10 K with 28 eV photons on a Sr2RuO4 single crystal cleaved at 180 K [for Sr2RuO4, as recently discovered, the high-temperature cleaving suppresses surface contributions to the photoemission signal and allows one to isolate the bulk electronic structure; Damascelli et al. (2000)]. Many well defined quasiparticle peaks disperse towards the Fermi energy and disappear upon crossing .

A Fermi energy intensity map (Fig. 9c) can then be obtained by integrating the spectra over a narrow energy window about ( meV). As the spectral function (multiplied by the Fermi function) reaches its maximum at when a band crosses the Fermi energy, the FS is identified by the local maxima of the intensity map. Following this method, the three sheets of FS are clearly resolved and are in excellent agreement with the theoretical calculations (Fig. 9d).
The improvement in synchrotron radiation technology results in the availability of high resolution beamlines operating at increasingly higher photon energies. The significance of this progress is well exemplified by the resonance photoemission experiments on Ce compounds performed by Sekiyama et al. (2000) on a high resolution soft X-ray (500-1500 eV) photoemission system [this consists of a Scienta SES200 spectrometer, combined with a varied line-spacing plane grating monochromator on a high brilliance beamline at the SPring-8 synchrotron facility Saitoh et al. (1998)]. Ce compounds are characterized by a very different degree of hybridization between the 4 electronic states and other valence bands; the strength of the hybridization is stronger the larger the Kondo temperature . However, although CeRu2Si2 and CeRu2 are characterized by very different (approximately 22 and 1000 K, respectively), earlier photoemission studies reported similar spectra for the Ce 4 electronic states.888Patthey et al. (1990); Weschke et al. (1991); Kaindl et al. (1992); Joyce et al. (1992); Duò et al. (1996); Garnier et al. (1997). By performing angle-integrated high resolution photoemission experiments at the 3-4 ( eV, meV) and 4-4 ( eV, meV) resonances (see Fig. 10), Sekiyama et al. (2000) observed that, while the spectra for the two compounds are indeed qualitatively similar at 120 eV photon energy, they are remarkably different at 880 eV. As the photoelectron mean free path increases from approximately 5 to almost 20 Å upon increasing the photon energy from 120 to 880 eV Seah and Dench (1979), it was concluded that the 4-4 spectra mainly reflect the surface 4 electronic states. These are different from those of the bulk and are not representative of the intrinsic electronic properties of the two compounds, which are more directly probed at 880 eV: the 3-4 spectra show a prominent structure corresponding to the tail of a Kondo peak in CeRu2Si2, and a broader feature reflecting the more itinerant character of the 4 electrons in CeRu2 Sekiyama et al. (2000).
At this point, it is worth emphasizing that while the examples discussed in this section underline certain shortcomings of photoemission and may raise some doubts concerning the general validity of the ARPES results, on the other hand they demonstrate that, by taking full advantage of the momentum and energy resolution as well as of the photon energy range now available, state-of-the-art ARPES is not only a reliable technique but is also a unique tool for momentum space microscopy.
III From Mott insulator to high- superconductor
In the following we summarize the basic characteristics of the crystal and electronic structures of the copper oxides.999For a more detailed description see: Pickett (1989); Dagotto (1994); Auerbach (1994); Fulde (1995); Rao and Raveau (1995); Markiewicz (1997, 1991); Imada et al. (1998); Tokura and Nagaosa (2000); Orenstein and Millis (2000); Sachdev (2000).

We will use, as an example, the archetypical cuprate superconductor La2-xSr2CuO4 (LSCO) and its parent compound La2CuO4 (see Fig. 1), whose undistorted high-temperature tetragonal (HTT) structure is sketched in Fig. 11. Upon lowering the temperature, several structural phase transitions occur, characterized by coherent rotations of the CuO6 octahedra [see, e.g., Kimura et al. (2000)]. However, no discernible effect has been found in photoemission and ARPES data are usually discussed within HTT notations. The corresponding three-dimensional Brillouin zone, which is most relevant to the study of the momentum-resolved electronic properties, is also sketched in Fig. 11. However, as the cuprate HTSCs have a quasi 2D electronic structure with weak dispersion along the axis, in the discussion of the ARPES data we will refer to the 2D projected zones as the one presented in Fig. 11 for LSCO or in Fig. 12 for other systems. As emphasized in Fig. 11, the most important structural element is represented by the CuO2 planes which form single (as in LSCO) or multi-layer blocks separated from each other by the so-called charge reservoir layers (La/Sr in Fig. 11). Depending on the number of CuO2 planes contained within the characteristic blocks ( is also the number of Cu ions per formula unit), the cuprates are classified into, e.g., single-layer [LSCO, Bi2Sr2CuO6+δ, Nd2-xCexCuO4, and (Sr,Ca)2CuO2Cl2], bilayer [Bi2Sr2CaCu2O8+δ and YBa2Cu3O7-δ], and trilayer materials [Bi2Sr2Ca2Cu3O10+δ], et cetera. This structural characteristic profoundly affects the superconducting properties: within each family of cuprates increases with , at least for Di Stasio et al. (1990); Tarascon et al. (1988). For instance, within the Bi-based cuprate HTSCs, a maximum of 34, 96, and 110 K is found for , 2, and 3, respectively Eisaki et al. (2002). By substituting different elements in the reservoir layers or by varying their oxygen content (other methods are also possible, depending on the system) one can dope charge carriers into the CuO2 planes. The latter are believed to be responsible for high-temperature superconductivity as the Cu-O bands are the lowest energy electronic states and therefore directly determine the macroscopic electronic properties. For LSCO this is clearly indicated by the local-density approximation (LDA) band structure calculations presented in Fig. 13b, where all the bands between and 8 eV binding energy appear to be of Cu 3 or O 2 character [a schematic picture of the origin of the Cu-O bands in the cuprates is given at the bottom of Fig. 11, where the effect of crystal field splitting and, in particular, Jahn-Teller Jahn and Teller (1937) distortion of the octahedron on the Cu and levels is also shown].

Analogous results are obtained for a square lattice with three orbitals (Cu , and O 2 and 2) at half filling (i.e., one electron per Cu orbital corresponding to in the phase diagram of Fig. 1), which emphasize the presence of one antibonding band at the Fermi level, and of nonbonding and bonding bands at higher binding energy [see Fig. 13a, and also Fig. 13c and Fig. 12 where the corresponding metallic density of states and the symmetry of the hybridized wavefunctions at (,) are shown].
The band structures of Fig. 13a,b imply metallic behavior and a FS with volume equal to half of the Brillouin zone. In particular, for the calculations of Fig. 13a in which only nearest neighbor hopping (Cu-O, ) was considered, a diamond-like FS is obtained (Fig. 11). A distortion of this FS takes place with the more realistic inclusion of also next-nearest neighbor hopping (O-O, ), which results in the FS given by the grey area in Fig. 11 Dickinson and Doniach (1993). These results seem to well correspond to the photoemission spectrum shown in Fig. 11, where a several eV broad valence band and a low-energy quasiparticle peak are observed (note that the meV region shown in the enlargement is the energy range that we will be mostly dealing with throughout this article).

However, the experimental spectrum of Fig. 11 was obtained on optimally doped LSCO ( point in Fig. 1), whereas on the basis of the band structure results of Fig. 13b metallic behavior is expected also for undoped La2CuO4 ( point in Fig. 1), which on the contrary is an AF insulator. This contradiction reflects the failure of the independent particle picture (assumed in band calculations like those of Fig. 13a,b) and suggests that the undoped parent compounds of the cuprate superconductors may belong to the class of the Mott-Hubbard insulators Mott (1949, 1956, 1974); Hubbard (1964a, b); Anderson (1959). These systems, because of the odd number of electrons per unit cell are erroneously predicted by band theory to be paramagnetic metals, with a partially filled d-band in the case of transition metal oxides such as, e.g., CoO. The reason for this failure lies in the on-site electron-electron repulsion , which is much larger than the bandwidth . As a consequence, the conduction band splits in upper and lower Hubbard bands and these compounds are rather good insulators with an optical gap of a few eV between the two Hubbard bands. Similarly in the case of the copper oxides, as the on-site electron-electron repulsion for the Cu 3 electrons is comparable to the bandwidth (which is the tight binding result for the square lattice), the antibonding band splits in upper and lower Hubbard bands and charge fluctuations are suppressed (Fig. 13d). It has to be emphasized, however, that in the cuprates the Cu-O charge-transfer energy is smaller than the on-site Coulomb repulsion (Fig. 13e), which characterizes these compounds more precisely as charge-transfer insulators Zaanen et al. (1985).
Therefore the cuprates should be described in terms of the three-band extended Hubbard model Varma et al. (1987b, a); Emery (1987), where Cu 3, as well as O 2 and 2 orbitals are explicitly considered. However, because of the finite hybridization between the correlated Cu and the non-interacting-like O orbitals, the first electron-removal states correspond to the O-derived Zhang-Rice singlet band Zhang and Rice (1988). It was then suggested that the cuprates may be considered equivalent to an effective single-band Mott-Hubbard system with the Zhang-Rice singlet band playing the role of the lower Hubbard band, and an in-plane Cu-derived band as the upper Hubbard band. These states are separated by an effective Mott gap of the order of (Fig. 13f). Note that although not universally agreed upon,101010Varma et al. (1987b, a); Emery (1987). It should be emphasized however that the existence and stability of Zhang-Rice singlets in the cuprates, and in turn the description in terms of an effective one-band Hubbard model, have recently received further support from spin-resolved photoemission studies on Bi2Sr2CaCu2O8+δ, which suggest the pure singlet character of the first ionization states Brookes et al. (2001); Tjeng et al. (2001). this line of thinking is widely used in the literature and supports the early proposal by Anderson (1987) that the essential physics of the cuprates would be captured by the one-band Hubbard model; this contains a single kinetic-energy term proportional to the nearest-neighbor hopping amplitude , in addition to the Hubbard term that favors electron localization and results in ‘frustration’ of the kinetic energy:
| (23) |
Here () creates (annihilates) an electron or hole on site with spin , identifies nearest-neighbor pairs, and is the number operator. In the strong coupling limit () at half filling (, i.e., one electron per Cu site in a 3 orbital), the AF state Anderson (1950) results from the fact that, when nearest-neighbor spins are antiparallel to each other, the electrons gain kinetic energy by undergoing virtual hopping to neighboring sites (because of the Pauli principle, hopping is forbidden for parallel spins). Note that by projecting out the doubly occupied states at large Dagotto (1994), the Hubbard Hamiltonian simplifies into the - Hamiltonian, which is more commonly used in studying the low-lying excitations of the 1/2-filled AF insulator:
| (24) |
where the operator excludes double occupancy, is the AF exchange coupling constant, and is the spin operator. At half filling, as charge excitations are gapped, we find at low-energy only spin excitations governed by the AF Heisenberg Hamiltonian (the constant term is usually neglected). Away from half filling, the - model describes the so called ‘doped AF’, i.e., a system of interacting spins and mobile holes. The latter acquire a ‘magnetic dressing’ because they are perturbing the correlations of the spin background that they move through.
As we will see in more detail in Sec. IV.1, the ARPES work on the undoped insulator provides a starting point to understand the doping evolution of the electronic structure of the cuprate HTSCs and emphasizes a fundamental problem in the theoretical description of the doped 2D AF: the Heisenberg model is so strongly perturbed by the addition of mobile holes that, above a certain doping level, some form of spin liquid may be a better ansatz than the long range ordered Néel state. This point is centrally important to high- superconductivity and the HTSCs, which are poor conductors in the normal state with a behavior fundamentally different from the FL paradigm and are often regarded as doped AFs Orenstein and Millis (2000). For this reason the BCS theory Bardeen et al. (1957), which was developed for FL-like metals and has been so successful in describing conventional superconductors, is generally considered not to have the appropriate foundation for the description of the HTSCs. A new approach may therefore be needed, and a necessary requirement for a theory aiming to capture the essential physics of high- superconductivity might be the inclusion of the essential physics of the doped AF: the competition between AF and Coulomb interactions (which induce localization), and zero point kinetic energy (which favors delocalization). Along this direction, the most radical models seem to be those based on: (i) the resonating valence bond (RVB) state and the related spin-charge separation picture,111111Anderson (1987); Affleck and Marston (1988); Maekawa et al. (1988); Suzumura et al. (1988); Kotliar and Liu (1988); Lee and Nagaosa (1992); Wen and Lee (1996); Ioffe and Millis (1996); Laughlin (1997); Balents et al. (1998, 1999, 2000); Anderson (2000); Lee (2000). (ii) stripes,121212Zaanen and Gunnarsson (1989); Emery and Kivelson (1993a); Emery et al. (1999); Salkola et al. (1996); Bianconi et al. (1996); Kivelson et al. (1998); Ichioka and Machida (1999); Tohyama et al. (1999); Zaanen (1999); White and Scalapino (2000); Markiewicz (2000); Fleck et al. (2000); Chernyshev et al. (2000); Zacher et al. (2000a); Han et al. (2000). and (iii) quantum criticality.131313Chakravarty et al. (1989); Varma et al. (1989); Varma (1997); Littlewood and Varma (1991); Sachdev and Ye (1992); Sokol and Pines (1993); Emery and Kivelson (1993b); Castellani et al. (1995); Chakravarty et al. (2001). Although very different, these theoretical approaches have one common denominator: superconductivity is not simply caused by the pairing of two quasiparticles, as in the BCS case, rather it is the process in which the quasiparticle itself forms. Furthermore, contrary to the standard theories of solids where any phase transition into a long-range ordered state is driven by the gain in potential energy, in cases (i) and (ii) the driving mechanism for the superconducting phase transition is identified with the gain in kinetic energy, a scenario which has recently received direct support from the experimental investigation of the optical conductivity of Bi2Sr2CaCu2O8+δ Molegraaf et al. (2002). In the stripe or RVB models the hopping of pairs of holes perturbs the AF spin background less than individual holes.

However, it is only when charge fluctuations become phase coherent that the frustration of the kinetic energy is released, and superconductivity sets in.
Upon further doping the system, AF correlations are reduced and a metallic state appears. Eventually (i.e., in the optimum and overdoped regime), the AF state is destroyed and a large LDA-like FS emerges, with a volume which scales as () counting electrons ( is the concentration of doped holes for p-type HTSCs), as expected within the FL approach. In this context, the first important question to answer concerns the way the low energy states emerge in the very underdoped regime (Fig. 14). For , two alternative scenarios have been proposed [see, e.g., Allen et al. (1990); Dagotto et al. (1991); van Veenendaal et al. (1994)]: first, the chemical potential is pinned inside the charge-transfer gap as ‘in-gap states’ are created (Fig. 14b); second, the chemical potential moves downwards into the top of the valence band and states are transferred from the upper to the lower Hubbard band because of correlations (Fig. 14c).
Another relevant question is how do the low-lying states evolve upon going from the underdoped to the overdoped regime, where FL-like behavior seems to recover? To better organize the discussion, let us present an overview of some relevant theoretical models. They can be classified as: (i) those that preserve the underlying crystalline symmetry, and (ii) those that break this symmetry (note that also the scenarios based on a dynamical breaking of symmetry should be taken into account because ARPES is sensitive to the latter, due to the relatively high excitation energy).

The first models to be mentioned among (i) are the FL and band structure perspectives Pines and Nozires (1966); Pickett (1989), which sever the connection to the undoped AF insulator by assuming that the screening in the doped metal is strong enough for the FL formalism to recover; in this case a well defined FS is expected (Fig. 15a), with a volume proportional to () in agreement with Luttinger’s theorem Luttinger (1960). An alternative scenario considers the breakdown of FL theory due to umklapp scattering Furukawa et al. (1998); Furukawa and Rice (1998); Honerkamp et al. (2001). As a result, in the underdoped region of the phase diagram the FS is truncated near the saddle points at (,0) and (0,), because of the opening of spin and charge gaps. This results in four disconnected arcs of FS centered at (/2,/2), as shown in Fig. 15b. In agreement with a generalized form of Luttinger’s theorem, the area defined by the four arcs and by the umklapp gapped FS (dashed lines in Fig. 15b) encloses the full electron density.
Among the broken-symmetry models, we find the RVB/flux-phase approach.141414Affleck and Marston (1988); Wen and Lee (1996); Chakravarty et al. (2001); Maekawa et al. (1988); Suzumura et al. (1988); Kotliar and Liu (1988). This predicts a FS given by four hole-pockets close to (/2,/2) with a volume proportional to , as in Fig. 15c, which continuously evolve into a large FS upon increasing the hole concentration. Note that this is very similar in spirit to the spin-density wave picture, which also assumes a dynamical breaking of symmetry Kampf and Schrieffer (1990b, a). Another model belonging to (ii) is the stripe picture, which yields a momentum-space distribution of low-lying excitations Salkola et al. (1996); Fleck et al. (2000); Markiewicz (2000).

These are represented by the black patches in Fig. 15d, where the results obtained for an equal number of vertical and horizontal domains of disordered stripes are qualitatively sketched (in this case the physics, together with the superposition of domains, conspires to give the appearance of a large LDA-like FS).
There is another meaningful way to differentiate the four models discussed above: those depicted in Fig. 15a, 15b, and 15c assume that the system is spatially homogeneous [as far as Fig. 15b is concerned, one could talk about phase separation between insulating spin-liquid and metallic regions, but only in momentum space Furukawa et al. (1998); Furukawa and Rice (1998); Honerkamp et al. (2001)]. In contrast, the model in Fig. 15d assumes that the system is spatially inhomogeneous: the formation of stripes is defined as the segregation of charge carriers into one-dimensional (1D) domain walls which separate AF spin domains in antiphase with each other Tranquada et al. (1995). In Fig. 15d, in particular, disordered stripes are considered Salkola et al. (1996).
Each of the above pictures seem to capture some of the experimental aspects. Throughout the paper, we will try to compare ARPES data from various systems with the results of these models, in the hope of identifying the scenario that has the best overlap with the experimental observations. This will also help us to answer the question of whether different materials would favor different scenarios, and to address the relevance of degrees of freedom other than the electronic ones (e.g., lattice degrees of freedom in the case of the stripe instability).
IV Normal-state electronic structure
IV.1 Sr2CuO2Cl2 and Ca2CuO2Cl2
The - model, briefly discussed in the previous section, is of particular relevance to the low-energy ARPES features detected on the cuprates. In fact, in ARPES experiments performed on the insulating parent compounds of the HTSCs, as a result of the photoemission process one photo-hole is injected in the CuO2 plane.

Therefore, this experiment is the practical realization of a ‘single hole’ in the AF insulator, and the comparison of ARPES data and calculations based on the - model is particularly meaningful (the latter are typically performed on small clusters and hence have difficulties treating charge ordering, which may arise at finite doping; see Sec. IV.2).
IV.1.1 Single hole in the AF insulator
ARPES spectra and the corresponding energy dispersion for insulating Sr2CuO2Cl2 (SCOC) along the nodal direction (0,0)-(,) are shown in Fig. 16a,b Wells et al. (1995). A more complete quasiparticle dispersion is presented in Fig. 17 (note that throughout the paper we will use terms like ‘quasiparticle’ in a loose sense for convenience, even though in most cases FL theory may not apply and well defined quasiparticle peaks cannot be identified in the ARPES spectra). Along (0,0)-(,) the dispersion is characterized by a bandwidth eV. This is in very good agreement with - model calculations Dagotto (1994), which show that, independent of the value of meV, the dressing of the hole moving in the AF background reduces the quasiparticle bandwidth from the square-lattice tight-binding value of eV [Kittel (1996); Fig. 16b] to 2.2 meV [ meV for SCOC as independently deduced from neutron scattering studies Greven et al. (1994)].
The ability of - model calculations to reproduce the experimentally observed energy-scale renormalization from to confirms the importance of many-body effects, and in particular of the coupling between quasiparticles and magnetic correlations, in the (undoped) cuprates. An additional proof of this statement is provided by the comparison between the experimentally determined dispersion for 1D and 2D systems with almost identical structures and Cu-O-Cu bond lengths (e.g., SrCuO2 and SCOC, respectively). The surprising aspect in the data presented in Fig. 18 is that the dispersion seen in 1D systems is about three times as large as the one of the 2D systems Kim et al. (1996, 1997); Kim (2001). This violates the non-interacting particle picture on a qualitative level, as band theory would predict the dispersion in 2D () to be twice that of 1D ().

This catastrophic failure of the independent-particle picture can be understood as a consequence of two factors: first, the quasiparticle dispersion in 2D is strongly renormalized by the magnetic interaction; second, in 1D spin-charge separation occurs, and this frees the holon motion from the magnetic interaction Lieb and Wu (1968).
On the other hand, the - model predicts a relatively flat dispersion Liu and Manousakis (1992); Dagotto et al. (1994) along the (,0)-(0,) direction (dashed line in Fig. 17), in contrast to the bandwidth eV observed by ARPES around (/2,/2) independent of the direction. Also the poorly defined lineshape and the spectral weight suppression observed at (,0), which indicate the lack of integrity of the quasiparticle at those momenta, cannot be reproduced within the simple - model calculations Kim et al. (1998, 2002). Better agreement between the experimental dispersion and the calculations (solid circles and solid line in Fig. 17) is obtained by adding second and third nearest-neighbor hopping ( and , respectively) to the - Hamiltonian.151515Nazarenko et al. (1995); Kyung and Ferrell (1996); Xiang and Wheatley (1996); Belinicher et al. (1996); Eder et al. (1997); Lee and Shih (1997); Lema and Aligia (1997); Leung et al. (1997); Sushkov et al. (1997); Kim et al. (1998); Tohyama et al. (2000); Tohyama and Maekawa (2000). In fact, as and describe hopping within the same magnetic sublattice, they do not alter the AF properties of the system at half filling; at the same time, they are not strongly renormalized by the AF correlations but contribute directly to the coherent motion of the hole and, therefore, have a substantial impact on the quasiparticle dispersion. Less can be said about the lineshape because the broadening is not predicted by the theory, which is a major limitation of this kind of approach. Most importantly, the inclusion of and accounts for the suppression of the quasiparticle peak at (,0), which may reflect a reduction of AF spin correlations: the additional hopping possibilities represented by and induce a spin-liquid state around the photo-hole with (,0) momentum Tohyama et al. (2000); Tohyama and Maekawa (2000). As a consequence, one may expect to find signatures of spin-charge separation in the ARPES data Anderson (1987). In this regard, it is interesting to note that the full quasiparticle dispersion observed for SCOC can be very well reproduced also by the spinon dispersion as proposed by Laughlin (1997) [the dotted line in Fig. 17 shows the result along (,0)-(0,)], who argued in favor of the decay of the photo-hole injected in the 2D AF CuO2 plane into a spinon-holon pair. This is also reminiscent of the flux phase physics,161616See for example: Maekawa et al. (1988); Suzumura et al. (1988); Kotliar and Liu (1988); Affleck and Marston (1988); Wen and Lee (1996); Chakravarty et al. (2001). an extension of the early RVB conjecture Anderson (1987). We stress here that spin-charge separation in 2D, if realized, would have a different impact on the dispersion, as suggested by the comparison with the 1D case in Fig. 18: in 2D the holon motion is much less coherent than in 1D.
IV.1.2 Remnant Fermi surface
We mentioned above that both the relatively isotropic dispersion at (/2,/2) and the suppression of quasiparticle weight at (,0) observed by ARPES on SCOC and Ca2CuO2Cl2 (CCOC), which is similar in many respects to SCOC Ronning et al. (1998); Ronning et al. (2002a), cannot be explained within the nearest-neighbor hopping - model. Better agreement with the experiment is obtained by including in the model longer range hopping terms. In this way, it is possible to reproduce also the doping dependence of the quasiparticle band structure and, in particular, of the (,0) ARPES spectra Eder et al. (1997). However, the - model, even in its more extended form, cannot completely account for the strong momentum dependence of the ARPES spectra from the undoped insulator Eskes and Eder (1996). In particular, although it predicts a decrease of intensity for the lowest energy peak upon crossing the AF zone boundary Eskes and Eder (1996); Bulut et al. (1994), this is not as sharp as experimentally observed in SCOC (see Fig. 16a) or CCOC. This limitation of the - model comes from having projected out the doubly occupied states originally contained in the Hubbard model: whereas the momentum occupation number is a strongly varying function of in the intermediate- Hubbard model at half filling, it is trivially equal to 1/2 in the - model which, therefore, cannot describe the anomalous distribution of spectral weight in the single particle spectral function. This effect is accounted for by the complete large U-limit of the Hubbard model, as shown on the basis of finite size cluster calculations by Eskes and Eder (1996), and was referred to by the same authors as a pseudo-FS.

A detailed experimental characterization of the -dependence of the ARPES spectral weight for the undoped insulator has been presented by Ronning et al. (1998), on the basis of the mapping obtained by integrating the ARPES spectra from CCOC over an energy window larger than the bandwidth. From the location of the steepest drops in (see Sec. II.3) a remnant-FS was defined for CCOC, which closely follows the AF Brillouin zone boundary (Fig. 19). Note that matrix element effects also influence the -dependence of the intensity and alter the profile of the remnant-FS Haffner et al. (2000, 2001). However, the drop observed at the AF Brillouin zone boundary both in the experiment and in the numerical results appears to be a robust feature, despite some uncertainties which indeed seem to be caused by matrix element effects Ronning et al. (2002a); Dürr et al. (2001); Golden et al. (2001). One has to realize that the remnant-FS is not a real FS (the system has a Mott gap), but identifies the same locus of rapid intensity drop referred to as a pseudo-FS by Eskes and Eder (1996). It underscores the fact that the system was driven into the insulating state by strong electronic correlations. In addition, it does not even correspond to an isoenergetic contour in the quasiparticle dispersion (Fig. 19), similarly to the FS determined in the underdoped regime (Sec. VII). The relevance of this approach is that, once a remnant-FS has been determined, it is also possible to identify a ‘gap’ along its contour (in addition to the Mott gap), and try to compare it to the high energy pseudogap of the underdoped systems (see Sec. VII).
IV.1.3 Superconducting Ca2-xNaxCuO2Cl2
Although these materials are very difficult to dope up to the onset of superconductivity, recently doping dependent data from the (Sr/Ca)2CuO2Cl2 family have become available. Following earlier success on polycrystalline samples Hiroi et al. (1994, 1996), Kohsaka et al. (2001), by a flux method under a pressure of 4 GPa, have succeeded in growing superconducting single crystals of Ca2-xNaxCuO2Cl2 (with maximum K at ). This achievement has opened very exciting new opportunities in the systematic investigation of the cuprates: the oxychlorides together with the LSCO family represent the only materials in which the doping range corresponding to the metal-insulator transition can be accessed. Furthermore, since the best ARPES data from the insulator have been obtained on this family of compounds, this makes the direct comparison between data from the metal and the insulator more informative.

Fig. 20 shows the energy distribution curves measured at 10 K with 25.5 eV photons on 10% Na-doped CCOC ( K), along the high symmetry directions. In going from (0,0) to (,), a broad feature disperses up to the Fermi level as indicated by the clear Fermi edge seen in the spectra near (Fig. 20b). After the band has crossed , one can still follow a feature dispersing backwards (see tick-marks) in a fashion very similar to what is expected for the magnetic shadow bands due to spin fluctuations diverging at the AF zone boundary.171717Kampf and Schrieffer (1990b); Dagotto (1994); Haas et al. (1995); Preuss et al. (1995); Chubukov (1995); Wen and Lee (1996) In the same figure, the constant-energy or momentum distribution curves are also plotted (Fig. 20d). It appears that these cannot be fitted to a single Lorentzian but two Lorentzian peaks are needed. This is probably the most convincing case for the presence of shadow bands as in this system complications due to structural distortions are not present and, therefore, the origin of the effect is likely magnetic. Fig. 20e compares the dispersion of insulating CCOC and of the Na-doped superconductor: although in the insulator the top of the valence band is located eV below the chemical potential, there is a striking similarity in the dispersion of the two compounds. This suggests that upon doping the system the chemical potential shifts from inside the gap of the insulator to the top of the valence band near (/2,/2), which is also supported by the similarities between the (,0) ARPES spectra from Na-free and doped CCOC Ronning et al. (2002b). Note also that, while according to band theory the dispersive feature in Fig. 20a should reach in going from (,0) to (,), an unambiguous Fermi crossing is not seen and near (,0) the band is meV below , a point that will be discussed in greater details in Sec. VII.5 (pseudogap).
The results from Na-doped CCOC are consistent with a shift of the chemical potential (as in Fig. 14c) and are very suggestive of the two scenarios depicted in Fig. 15b or Fig. 15c, as emphasized in particular by the contour map of the low-lying excitations presented in Fig. 21b. The task of conclusively distinguishing between the scenarios of Fig. 15b and Fig. 15c is rather difficult. The key point is whether or not a shadow FS is detected (marked by the dash lines in Fig. 15c), whose presence is however not clear in the contour map of Fig. 21b. This can either mean that the shadow FS is not present or simply too weak to be detected [the data in Fig. 20b-d show the presence of a shadow band that disperses away from the Fermi level when passing (/2,/2), but this is not clear at ].
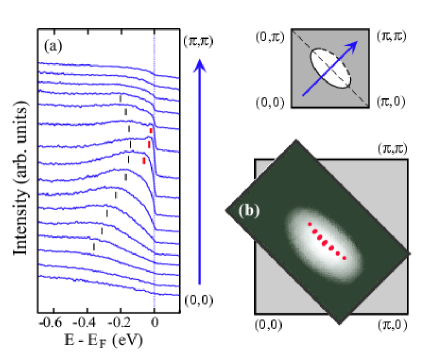
Even more difficult would be, at this stage, to distinguish between the scenario of Fig. 15c in which the FS pockets are not exactly centered at (/2,/2), and the simplest antiferromagnetic/spin-density wave picture [see, e.g., Fulde (1995)], in which the excitation spectrum is symmetric with respect to the AF zone boundary (as in Brillouin zone sketch shown in Fig. 21).
A more detailed analysis of the ARPES spectra along the nodal direction reveals additional information Kohsaka et al. (2001). As shown in Fig. 21 the energy distribution curves near the Fermi energy actually consist of two components: a broader component at higher binding energy that appears to disperse backwards past (/2,/2) defining the shadow band, and a sharp (although weak) component that crosses the Fermi level (its -space location is indicated by the red dots in Fig. 21b). Note that the sharper low-energy peak is not directly related to superconductivity as it is seen in the 20 K data of Fig. 21 ( K) and, as a matter of fact, was still present at temperature as high as 75 K Ronning et al. (2002b). On the one hand, these two components may be thought of as the coherent and incoherent parts of the spectral function, as discussed in Sec. II.3. On the other hand, these results may also indicate that the doping evolution cannot be fully accounted for in terms of a rigid shift of the chemical potential.
IV.1.4 Summary
It must be stressed that so far only 10% Na-doped samples were studied Kohsaka et al. (2001). Whether the relatively simple behavior (i.e., ‘rigid-band’ like) seen for Na-doped CCOC remains true at lower dopings (near the metal-insulator transition boundary) is still an open question, and is of particular relevance to those theories which lead to -wave superconductivity starting from a rigid band picture [see, e.g., Dagotto et al. (1995)]. As we will see in the next section, at first glance the physical picture emerging from LSCO is quite different and is more consistent with the scenario in which at low doping levels new states are created inside the gap (Fig. 14b). This could be naturally understood if the system becomes inhomogeneous at intermediate dopings: in fact two electronic components are observed in LSCO in the underdoped region (5-10%), and only one in the overdoped regime. However, without data from the very underdoped regime one may also interpret the LSCO doping evolution in terms of a quasi-rigid band shift with some modifications near the (,0) region. Therefore, until more data on Na-CCOC are available, one cannot conclude whether or not the difference with LSCO is of qualitative or quantitative nature.
IV.2 La2-xSrxCuO4
In order to study the doping evolution of the low-energy electronic properties over the full doping range the most suitable system is La2-xSrxCuO4 (LSCO). The hole concentration in the CuO2 plane can be controlled and determined by the Sr content , from the undoped insulator () to the heavily overdoped metal (). In addition, LSCO has a simple crystal structure with a single CuO2 layer (Fig. 11), and none of the complications due to superstructure which are found in Bi2212 (Sec. IV.3). Another interesting aspect is the suppression of at which, together with the incommensurate AF long-range order observed by inelastic neutron scattering Suzuki et al. (1998), has been discussed as evidence for fluctuating stripes in LSCO [similar AF order accompanied by charge ordering was interpreted as a realization of ‘static stripes’ in La1.48Nd0.4Sr0.12CuO4 Tranquada et al. (1995)].
IV.2.1 Metal-insulator transition
We start our discussion with data from overdoped LSCO Yoshida et al. (2001). Because many-body effects such as charge ordering are expected to be weak in the overdoped regime, the results from this sample can be used to test the overall reliability of the ARPES data from LSCO. Fig. 22 presents ARPES spectra from two Brillouin zones taken with 55.5 eV photons under different polarization conditions (while in geometry II the electric field was fixed and almost parallel to the sample surface, in geometry I it had only a small in-plane component which increases at larger momenta). It appears that the spectra from this overdoped sample are very sharp, contrary to the typical data from underdoped LSCO that we will discuss later.
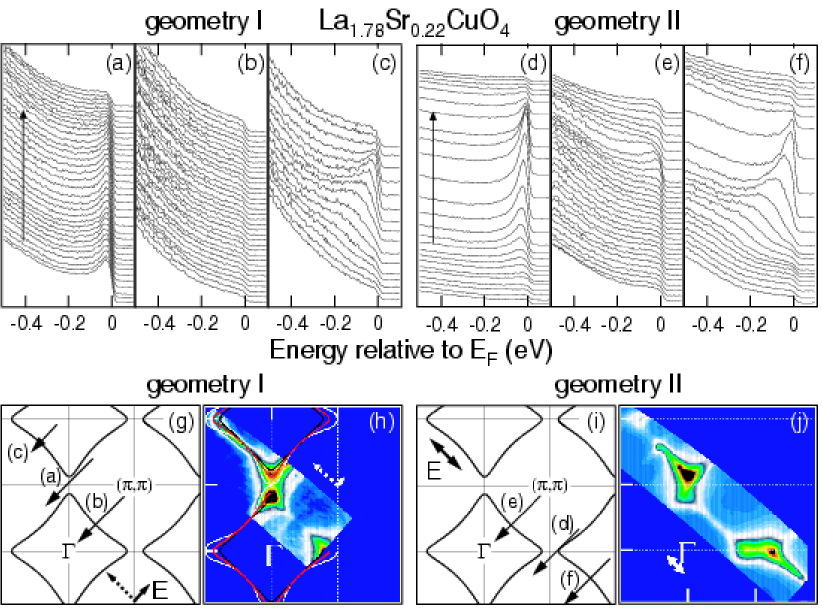
Indeed the sharpness of the spectra from the second zone is comparable to that observed in Bi2212, at similar doping. Fig. 22h and 22j present the spectral intensity integrated over a 30 meV energy window at . In general, the intensity map derived from high resolution data gives a good evaluation of the FS, provided that matrix element effects are carefully considered (see Sec. II.3 and II.5). Yoshida et al. (2001) have attempted to account for the photoionization cross section effects for LSCO by varying the experimental geometry and by performing simulations of the spectral weight distribution, which qualitatively reproduce some of the variation observed in different geometries. From the comparison (Fig. 22h) between the experimental intensity maps and the FSs obtained from a tight-binding fit to the data and from LDA calculations Xu et al. (1987), Yoshida et al. (2001) concluded that the FS of overdoped LSCO consists of an electron pocket centered at (0,0), in agreement with band-structure calculations. These results, namely the observation of sharp spectral features and an LDA-like FS, as well as the fact that low energy electron diffraction investigations do not detect any evidence of surface reconstruction, give strong credence to the ARPES data from the LSCO system. Since the quality of the LSCO single crystals improves upon decreasing doping , these data suggest that the broad spectral features observed in underdoped LSCO are of intrinsic nature.
Let us then move to the low doping region, near the metal-insulator transition boundary. Fig. 23 presents ARPES spectra at (,0) and (/2,/2) as a function of doping Ino et al. (2000). The data were recorded under identical experimental geometry so that the photoionization matrix elements are the same. For the insulating samples (), the data are characterized by a high binding energy feature [ eV at (,), and eV at (,0)], and are consistent with what we have discussed in Sec. IV.1 for insulating SCOC Wells et al. (1995); Kim et al. (1998), albeit the features are now broader. The remarkable result is that for two features can be identified in the ARPES spectra at the (,0) point (some additional weight at low energy is already observable for ): in addition to the high-energy one, reminiscent of the Zhang-Rice singlet band of the AF insulator, a second shoulder is observable close to . Upon further doping the system with holes, a systematic transfer of spectral weight from the high to the low-energy feature takes place, and a well-defined quasiparticle peak develops near optimal doping.

On the other hand, the results obtained at (,) are very different: first of all, the data show an overall suppression of weight as compared to (,0) [the spectra plotted in Fig. 23 for (,) have been multiplied by a factor of 2]; second, in the nodal region [i.e., along (0,0)-(,)], a quasiparticle peak is observable only for . As we will discuss later, with different experimental geometries more spectral weight is detected near in the nodal region, but the overall trend of the doping dependence of the electronic structure is robust.
The dispersion of the LSCO spectral features for different doping levels is summarized in Fig. 24, which presents the second derivative with respect to the binding energy of the ARPES spectra Ino et al. (2000). Upon increasing doping, we can observe the building of near- weight first at (,0), and then at (/2,/2). One can clearly observe the presence of the flat-band saddle point extensively discussed in the literature. Furthermore, the second derivative emphasizes the presence of the high-energy feature in the heavily underdoped samples (coexisting with the low-energy one, at least for ). This has a 200 meV lower energy at (/2,/2) than at (,0), in qualitative agreement with what is observed in the undoped insulator SCOC Wells et al. (1995).
The ARPES results from LSCO, and in particular the presence of two electronic components, suggest that the effects of doping on the electronic structure of the correlated insulator cannot be accounted for by a simple shift of the Fermi level in a rigid band model Ino et al. (2000). This is in agreement with another observation by Ino et al. (1997): from the analysis of direct and inverse angle-integrated photoemission spectra, it was concluded that the chemical potential is pinned inside the charge-transfer gap for , and starts shifting downwards significantly only for . The above results seem to indicate that, in the case of LSCO, in-gap states are created upon doping the insulator (Fig. 14b).
IV.2.2 Nano-scale phase separation
Ino et al. (2000) suggested that the ARPES results from LSCO may be understood within the stripe picture, which is a particular form of nano-scale phase separation. This would explain the pinning of the chemical potential for (i.e., the so called 1/8 doping) as a consequence of the segregation of doped holes into metallic domain walls, which gives rise to the appearance of in-gap states. Furthermore, the suppression of nodal intensity at would be consistent with the vertical and horizontal orientation of the metallic stripes (orthogonal domains are expected for this nano-scale phase separation). Here the conjecture is that charge fluctuations would be suppressed along directions crossing the stripes, and is supported by finite-size cluster calculations Tohyama et al. (1999). The increase of weight for in the nodal region may indicate that above this doping level the holes overflow from the saturated stripes into the CuO2 planes.
Concerning the relevancy of the stripe scenario to the ARPES data from the HTSCs, more insights could come from the investigation of Nd-LSCO, a model compound for which the evidence of spin and charge stripe-ordering is the strongest Tranquada et al. (1995). High resolution ARPES data from La1.28Nd0.6Sr0.12CuO4 were reported by Zhou et al. (1999). Remarkably, the low-energy spectral weight is mostly concentrated in narrow and straight regions along the (0,0)-(,0) and (0,0)-(0,) directions and is confined between lines crossing the axes at .
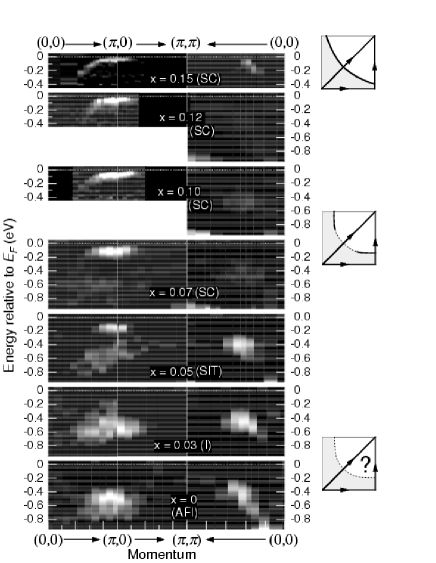
These straight patches of high intensity are suggestive of almost perfectly nested 1D FS segments. Zhou et al. (1999) interpreted these results as a signature of a 1D electronic structure related to the presence of static 1/4-filled charge stripes which, as indicated by neutron and x-ray experiments Tranquada et al. (1995), at 1/8 doping are separated by AF regions resulting in a pattern with periodicity 4 (and characterized by macroscopic orthogonal domains). This interpretation would also explain the origin of the two components seen in the ARPES spectra from LSCO near the metal-insulator transition boundary (Fig. 23): the signal from the AF insulating regions would be pushed to high binding energies because of the Mott gap, while the charge stripes would be responsible for the component near . In this sense, the stripe interpretation is rather appealing Markiewicz (2000).

On the other hand, there are some aspects which cannot be satisfactorily explained within the idealized stripe picture. For example, in both LSCO (Fig. 24) and Nd-LSCO Zhou et al. (1999), the quasiparticle bands along the (0,0)-(,0) and (0,0)-(0,) directions are characterized by a considerably fast dispersion. This is counter to what one would expect for an ideal 1D system even in presence of orthogonal domains, as the electronic dispersion should be observed only within and perpendicularly to each of the two superimposed 1D FSs [for more on this point see Zhou et al. (1999)]. Furthermore, also possible artifacts due to matrix element effects have to be cautiously considered when interpreting the ARPES data and especially modulations of the integrated spectral weight (Sec. II.3 and II.4).
In order to gain more insight into these issues, in particular in relation to the straight segments of FS observed in Nd-LSCO and to the suppression of the nodal state, Zhou et al. (2001) extended the measurements to the second zone, and used different polarizations and orientations of the incoming electric field. Fig. 25 presents data from 15% doped LSCO and Nd-LSCO recorded in the same geometry as the data of Fig. 22j from 22% doped LSCO. These results confirm the presence of the flat bands in extended regions around (,0) and (0,). On the other hand, in the second zone appreciable spectral weight at the Fermi level is detected in the nodal region, which appears to become more intense upon increasing the Sr concentration in both Nd-LSCO and LSCO, and is stronger in Nd-free LSCO for a given Sr content (Fig. 25). This nodal weight was not found in the earlier study of 12% doped Nd-LSCO Zhou et al. (1999), and is not expected in calculations considering only rigid stripes Ichioka and Machida (1999); Markiewicz (2000).
Possible descriptions of these results within the stripe context are summarized in Fig. 25c-h where the low-lying spectral weight from LSCO (c) and Nd-LSCO (d) is compared to the results of model calculations. First, the experimental FS composed of straight patches at (,0) and (0,) connected by ‘nodal segments’ (as emphasized in the sketch of Fig. 25e) closely resembles the one arising from disorder or fluctuation of the stripes Salkola et al. (1996), which was sketched in Fig. 15d and is here exactly reproduced in Fig. 25f. Alternatively, the experimental FS may result from the coexistence of site-centered (Fig. 25g) and bond-centered (Fig. 25h) stripes Zacher et al. (2000a). Both scenarios, as well as more recent calculations performed for various inhomogeneous models for the cuprates Eroles et al. (2001), suggest that the stripe picture catches the essence of the low-lying physics for the LSCO system. This is also indicated by dynamical mean-field theory results, which are characterized by a near- 1D dispersive band and a high-energy incoherent feature in the very underdoped regime Fleck et al. (2000), as well as by numerical studies of the spin-fermion model, which indicate that both stripe-induced midgap states and valence band states contribute to the FS Moraghebi et al. (2001), consistent with the two electronic components detected by ARPES on LSCO.
IV.2.3 From hole to electronlike FS
It was noted that the presence of a sharp structure in momentum space such as a FS-like feature does not necessarily imply well defined one-electron states and, in particular, is not incompatible with the stripe scenario Orgad et al. (2001).

For instance in a non FL system like the 1D electron gas, in which the energy distribution curves are typically completely incoherent, the near- momentum distribution curves (as defined in Fig. 7) might be very sharp because of more stringent kinematic constraints. Anyway, given that the striped system does exhibit a FS-like feature (Fig. 25), it is still meaningful to investigate its evolution as a function of doping. In doing so, one must bear in mind that the FS concept is here referred to in a loose manner: it identifies the momentum-space location where a very broad feature (and not a well defined peak in energy) crosses , after having defined some kind of band dispersion.
ARPES spectra for underdoped () and overdoped () LSCO are shown in Fig. 26 Ino et al. (1999). Although the spectral features from the underdoped samples tend to be broad, which as discussed may be related to charge inhomogeneity, some clear Fermi crossings are observable in part of the Brillouin zone especially in overdoped samples. For , along the direction (0,0)-(,0)-(2,0) at 29 eV photon energy (Fig. 26a), a broad quasiparticle peak emerges from the background, disperses towards without crossing it, and then pulls back in the second Brillouin zone. Similar results are obtained at 22.4 eV (Fig. 26b), the only difference being a decrease of intensity in the first Brillouin zone due to matrix element effects specific to this photon energy Ino et al. (1999). Along (,0)-(,) the quasiparticle peak, with maximum binding energy at (,0), disperses almost up to , loses intensity, and disappears (Fig. 26d). The leading-edge midpoint never reaches because of the superconducting gap ( meV) opened along the FS at this temperature (as clearly shown in Fig. 66). Following Campuzano et al. (1996), the underlying FS crossing is thus identified by the locus of the minimum gap and is located at (,0.2). Along the nodal direction no clear peak can be identified (Fig. 26c), as discussed above. However, having detected a band below at (,0), Ino et al. (1999) concluded that for the FS of LSCO is holelike in character and centered at (,). By comparing the spectra from heavily overdoped and underdoped LSCO (Fig. 26e and 26a), we see a striking difference: for the quasiparticle peak along this cut has almost disappeared at (,0). The decrease of intensity, together with a leading-edge midpoint located above , provides evidence for the quasiparticle peak crossing just before (,0). The FS thus determined for heavily overdoped LSCO is electronlike and centered at (0,0), in agreement with what discussed in relation to Fig. 22. Careful investigations by Ino et al. (2002) indicated that the FS changes from holelike to electronlike for -0.2 as the saddle point moves from below to above , consistent with LDA calculations.
IV.2.4 Summary
In summary, what has emerged from the study of the LSCO system is a very complex and intriguing picture, characterized by some contrasting aspects: neither a simple stripe model, nor any of the other models proposed in Fig. 15 can provide a satisfactory explanation for the complete body of available data. As we have discussed, the stripe picture, when disorder/fluctuations and realistic charge disproportionation are considered, has the advantage of qualitatively explaining the data over the entire doping range, including the presence of two electronic components, the straight FS segments, and the lack of a chemical potential shift in the very underdoped regime. On the other hand, on a more quantitative level, there are still many open questions. In particular, in order to gain more reliable insights, the role of matrix element effects on the ARPES data should be investigated in more detail. In fact, ab initio calculations of matrix elements are still unavailable for LSCO, and tight binding fits do not reproduce the results to a satisfactory degree.
As a last remark, it should be mentioned that the very underdoped regime was very recently studied by Yoshida et al. (2002). The two-component electronic structure discussed above was observed also for these samples, hinting again at a tendency towards nano-scale phase separation. However, the low-energy component (i.e., from the hole-rich region) defines a FS arc reminiscent of an LDA FS being gapped in the (,0) region. Despite this seemingly more conventional behavior, one should not abandon a many-body description for LSCO because a simple band picture cannot explain the basic observation of a two-component low-energy electronic structure.
IV.3 Bi2Sr2CaCu2O8+δ
In proceeding with the comparative study of the cuprate superconductors, let us now turn our attention to Bi2Sr2CaCu2O8+δ (Bi2212) which is the HTSC most intensively investigated by ARPES thanks to the availability of large high-quality single crystals and to the presence of a natural cleavage plane between the BiO layers, and especially to the richness of information that can be obtained by ARPES both in the normal and superconducting state. Due to sample quality issues most of the Bi2212 experiments were carried out near optimal doping, and there is very limited or almost no information on the electronic structure near the metal-insulator transition boundary. Here we concentrate on cases with a doping of 10% or higher. Therefore, we cannot answer the questions of whether the two-component electronic structure observed in LSCO for 5-7% doping is also present in the Bi2212 case, or how the metallic state emerges in the latter system. Core level spectroscopy results, however, suggest a behavior intermediate between the one seen on LSCO and the simple linear shift of the chemical potential Harima et al. (2002).
IV.3.1 Fermi surface topology
In the following we will illustrate the normal state electronic properties of Bi2212 focusing in particular on the FS topology, a topic which has been plagued by an intense controversy since the very beginning of its investigation. The main reason for this can be identified in the complexity of the electronic structure in the (,0) region of momentum space, which is where the quasiparticle dispersion as determined by ARPES is weakly momentum dependent giving rise to the so called flat bands Abrikosov et al. (1993); Gofron et al. (1993); Dessau et al. (1993). The complications arise from the detection of several additional features besides those related to the primary electronic structure. Firstly, shadow bands, which give rise to a replica of the main FS shifted by the wave vector (,) in the 2D Brillouin zone [Aebi et al. (1994); see Fig. 27, 28, and 30]. These correspond to the backfolding of the main electronic structure with respect to the mirror planes perpendicular to - or - (in the following we will make use of the momentum space notations defined for Bi2212 in Fig. 12). After the early explanation by Aebi et al. (1994) in terms of short-range and dynamic AF correlations resulting in a R45∘ superstructure Kampf and Schrieffer (1990b), several alternatives have been proposed.181818Chakravarty et al. (1995); Singh and Pickett (1995); Ding et al. (1996a); Salkola et al. (1996); Haas et al. (1995); Kordyuk et al. (2002); see also Lynch and Olson (1999), pg. 248.

These include a structural origin reflecting the presence of two inequivalent Cu sites per CuO2 plane in the face-centered orthorhombic unit cell Singh and Pickett (1995); Ding et al. (1996a), but a possible although not yet well-defined link to superconductivity has also been proposed: Kordyuk et al. (2002) observed that the intensity of the shadow bands shows a correlation with , as a function of doping. However, no conclusive picture has been reached so far.
The second additional feature are the umklapp bands, which are commonly referred to as originating from the diffraction of the photoelectrons off the superstructure present in the BiO layers, but should rather be considered as a modification of the intrinsic in-plane electronic structure due to the incommensurate distortion of the approximate tetragonal symmetry Osterwalder et al. (1995); Aebi et al. (1995); Schwaller et al. (1995); Ding et al. (1996a). This distortion is characterized by a periodicity of 27 Å along the axis and results in a unit cell approximately five times larger along this direction Withers et al. (1988); Yamamoto et al. (1990). This gives rise to two umklapp replicas of the FS shifted by as shown in Fig. 28a, 29, and 30, and even to higher order ones shifted by and labelled UB2 in Fig. 30a Osterwalder et al. (1995); Fretwell et al. (2000).
The last complications come from the so-called bilayer band splitting, namely the splitting of the CuO2 plane derived electronic structure in bonding (BB) and antibonding (AB) bands due to the presence of CuO2 bilayer blocks in the unit cell of Bi2212. On the basis of symmetry arguments the splitting is expected to be maximum at (,0), while it vanishes along the (0,0)-(,) direction Andersen et al. (1995); Chakravarty et al. (1993). As a result, around (,0) two main bands, two shadow bands, and four umklapp bands cross the Fermi level.

Fig. 27 reproduces the FS data and analysis by Aebi et al. (1994) for near optimally doped Bi2212. Panel (a) shows a plot of the spectral weight integrated within an energy window of 10 meV near the Fermi level (data were taken with an energy resolution of 30-40 meV). This is the first time that a detailed momentum-space map has been carried out on cuprate superconductors. The authors concluded that the FS is a hole like piece, as indicated by the thick lines in Fig. 27b. The complications in the intensity map stem from the superposition of shadow FSs that are offset from the main FS by (,), as shown in Fig. 27c and discussed above.
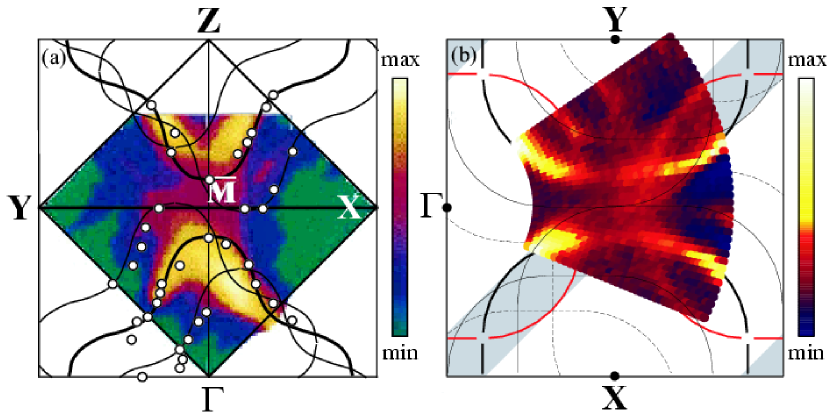
Aebi et al. (1994) also concluded that there are no BiO FS pockets, which had been predicted on the basis of band structure calculations as shown in Fig. 27d Massidda et al. (1988). As a matter of fact, one additional problem with Bi2212 is that there are no reliable band calculations: all theoretical results predict a BiO FS that has not been convincingly observed Shen and Dessau (1995). The work by Aebi et al. (1994) also represents the beginning of a very different approach in the field: instead of analyzing the data in terms of energy scans at fixed momenta or energy distribution curves (EDCs) as usually done, Aebi et al. (1994) for the first time made use of momentum scans at fixed energy or angular distribution curves [nowadays more commonly referred to as momentum distribution curves (MDCs) after Valla et al. (1999b) who used this approach to extract self-energy corrections from the ARPES data; see Fig. 7 and Sec. VIII]. In a series of papers, Aebi, Osterwalder, and coworkers used this approach to identify the superstructure periodicity, and the intensity and dispersion of main and shadow bands Aebi et al. (1994); Osterwalder et al. (1995); Schwaller et al. (1995).
The results by Aebi et al. (1994) are different from the early work by Dessau et al. (1993), which indicated another main FS crossing in the (,0) region: the detection of two pieces of FS, one electronlike and the other holelike, was interpreted as a signature of bonding-antibonding splitting in a bilayer system due to the presence of two CuO2 planes per unit cell Dessau et al. (1993). Subsequently, in a set of two papers Ding et al. (1996a); Ding et al. (1997) argued against the bilayer splitting [a result which was taken as key supporting evidence for the inter-layer tunnelling mechanism for high temperature superconductivity Anderson (1995, 1997, 1998)], and in favor of a FS characterized by a simple holelike barrel.
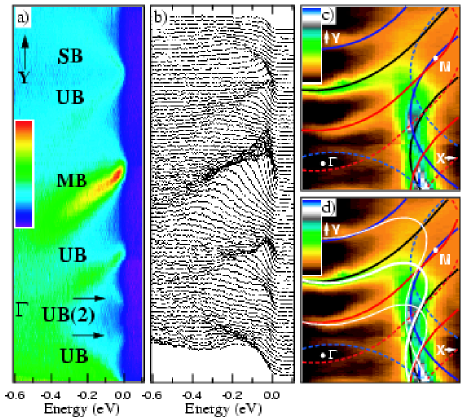
They attributed the additional FS crossing identified by Dessau et al. (1993) along the (0,0)-(,0) line to complications arising from the presence of a superstructure in the BiO layers (i.e., umklapp bands), as shown in Fig. 28. In particular, main and umklapp bands were identified in the complicated (,0) region on the basis of their different polarization dependence. In contrast with the case of LSCO where a crossover from a hole to electronlike FS is observed near optimal doping Ino et al. (1999, 2002), Ding et al. (1997) suggested that a single holelike sheet of FS is characteristic of all the studied doping levels. In addition, no shadow band was detected for the underdoped sample ( K), which was taken as evidence to rule out the FS pocket idea presented in Fig. 15c, and also the explanations in terms of AF correlations for the shadow bands observed near optimal doping by Aebi et al. (1994). However, the ARPES spectra from the K underdoped Bi2212 sample are characterized by a very broad lineshape indicating strong many-body effects on the spectral function which, as a consequence, is completely incoherent. The FS extracted from those data should be cautiously considered, in particular as far as the lack of bilayer splitting and of the FS pockets (or shadow band) is concerned.
After the initial debate, an agreement has been reached concerning the absence of the BiO pockets predicted for Bi2212 by band structure calculations. Furthermore, the general consensus was in favor of a holelike FS centered at (,) from under to overdoped samples ( between 15 and 67 K), with a volume consistent with the electron density in accordance with the Luttinger’s theorem Luttinger (1960). Recently, however, other reports questioned this simple picture arguing that this may not be a complete characterization of the low-lying excitations in Bi2212 Feng et al. (1999); Chuang et al. (1999); Gromko et al. (2000); Bogdanov et al. (2001). These studies revealed a pronounced photon energy dependence of the low-energy spectral weight in the (,0) region and suggested an electronlike FS centered at the -point as shown in Fig. 29a Chuang et al. (1999); Gromko et al. (2000); or alternatively two co-existing electronic components resulting in electron and holelike FSs Feng et al. (1999), similar to what originally proposed by Dessau et al. (1993). These suggestions were opposed by other groups which claimed that only a universal holelike FS is supported by the ARPES data once the effects of the photon energy dependence of the matrix elements in the (,0) region are taken into account Mesot et al. (2001b); Fretwell et al. (2000); Borisenko et al. (2000, 2001). As a matter of fact, first-principles simulations of the ARPES spectra performed within the one-step model, for an idealized tetragonal Bi2212 structure (i.e, no superstructure modulation), indicate a strong non-trivial dependence of the low-energy ARPES intensity on photoelectron momentum, and energy/polarization of the incident photons Bansil and Lindroos (1999). Therefore, photoemission matrix elements may largely dominate the momentum dependence of the ARPES intensity and should be taken into account, especially when attempting to estimate the momentum distribution function from the integrated photoemission intensity (see also Sec. II.3).
Owing to the superior momentum resolution, the complexity of the ARPES results from Bi2212 is beautifully shown by the new generation of photoemission data (Fig. 29b and 30). In particular along - all the features characterizing the ARPES spectra from Bi2212 can be unambiguously identified in the energy distribution curves, as it is along this direction that the different bands are more clearly separated (see Fig. 30a,b, where the dispersive bands are labelled as indicated in the caption).

However, because of the superposition of several contributions and especially because of matrix element effects, not even the most detailed intensity maps are very clear around (,0), as shown in Fig. 29, and in particular in Fig. 30c,d where holelike and electronlike scenarios are compared with respect to the same set of data. In turn, any interpretation necessarily rests on the extrapolation of results obtained away from this region.
Very recently it became evident that one of the key ingredients in the debate upon the FS topology of Bi2212 is actually the unresolved bilayer splitting of the in-plane electronic structure. In this regard, as it will be discussed in greater detail in the next section, an essential piece of information comes from ARPES data obtained with improved angular resolution in the very overdoped regime: two FS sheets are resolved, which originate from the bonding-antibonding splitting of the in-plane electronic structure caused by the interaction between the layers Feng et al. (2001); Chuang et al. (2001a). In this context, the cleanest experimental results have been obtained on very overdoped Pb-Bi2212 ( K), in which Pb substitutes into the BiO planes suppressing the superstructure and in turn the intensity of the umklapp bands Bogdanov et al. (2001). As shown in Fig. 31, where the ARPES data are compared to the theoretical simulations by Bansil and Lindroos (1999) for the same experimental geometry, two different sheets of Fermi surface are clearly resolved. With respect to the point, the outer sheet is the bonding FS while the inner piece is the antibonding one. The bonding pocket is holelike, similar to what was reported many times before for Bi2212. The antibonding FS, on the other hand, has its van Hove singularity near (,0) and is thus very close to the holelike/electronlike boundary. Therefore, the experiments indicating a single holelike or electronlike FS in Bi2212 might simply be more sensitive to the bonding or antibonding sheet, respectively, as a consequence of sample doping and/or experimental conditions (such as the polarization and the energy of the incident photons).
IV.3.2 Bilayer band splitting
Independently of the controversy on the FS of Bi2212, whether the electronic structure of the cuprates can be influenced by the interaction between the CuO2 planes has been an issue of interest for a long time, as one of the proposed mechanisms for high-temperature superconductivity is via interlayer pair tunnelling Chakravarty et al. (1993); Anderson (1997).
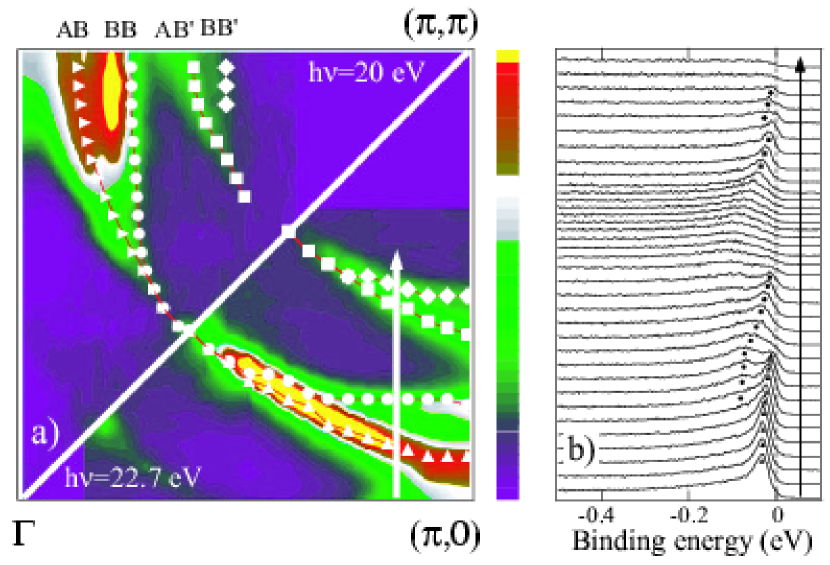
Within this model, interlayer hopping is suppressed because of correlations and only electron pairs can tunnel between the planes: coherent pair-tunnelling will drive the system into the superconducting state via the lowering of kinetic energy perpendicular to the planes. As discussed above, an early ARPES study on Bi2212 claimed the absence of bilayer splitting Ding et al. (1996a). This report attracted much interest as it provided a crucial support for the interlayer tunnelling model, although with hindsight the momentum resolution was not sufficient to conclusively address this issue. Recently, new ARPES data suggested that the bilayer splitting can be detected for overdoped Bi2212 with the improved angular resolution of the Scienta spectrometer Feng et al. (2001); Chuang et al. (2001a). Below, we will discuss this issue in more detail. As for the interlayer tunnelling model, it has to be mentioned that strong evidence against it was reported on the basis of direct imaging of magnetic flux vortices by scanning SQUID microscopy Moler et al. (1998), and by optical measurements on Tl2Ba2CuO6+δ Tsvetkov et al. (1998). On the other hand, a subsequent optical study provided direct evidence for the lowering of the kinetic energy parallel to the planes across the superconducting transition, supporting the view that superconductivity in the cuprates is indeed unconventional Molegraaf et al. (2002).
Fig. 32a presents the normal-state data from a K overdoped Bi2212 sample Feng et al. (2001). Two FSs are observed for the main electronic structure (BB and AB) as well as its superstructure replica (BB’ and AB’). These FSs correspond to four well resolved quasiparticle peaks (Fig. 32b), whose dispersion can be clearly followed in the ARPES spectra taken along the -space cut indicated by the arrow in Fig. 32a. As expected on the basis of symmetry arguments Andersen et al. (1995); Chakravarty et al. (1993) no splitting has been detected along the nodal direction (even with the best achievable angular resolution of about ); the splitting increases upon approaching (,0) where it exhibits the largest value of about 88 meV. The different photon energy dependence of BB and AB bands, evidenced by the relative intensity change in the two FS mappings presented in Fig. 32a (top-left and bottom-right), is consistent with the different symmetry of the two bands along the -axis (odd and even for AB and BB, respectively). Analogous conclusions were independently obtained by Chuang et al. (2001a) from the analysis in terms of momentum distribution curves of similar ARPES data [see Fig. 33, where BB and AB bands can be observed both in the image plot of the ARPES intensity near (,0) and in the corresponding MDCs]. All together, the different studies indicate a normal state bilayer splitting of the order of 70-100 meV in overdoped Bi2212 Feng et al. (2001); Chuang et al. (2001a); Bogdanov et al. (2001).
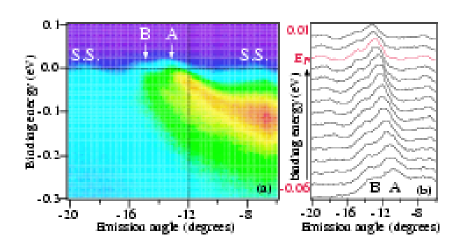
As shown in Fig. 34c where the magnitude of the normal state bilayer splitting along the AB FS is plotted, the observed energy splitting agrees well with the functional form predicted on the basis of bilayer LDA calculations Andersen et al. (1995). However, the experimental value of 88 meV () is much smaller than the 300 meV () predicted by the bilayer LDA calculations. It is actually in better agreement with bilayer Hubbard model calculations Liechtenstein et al. (1996), which predicted an energy splitting of similar momentum dependence and with a maximum value of about 40 meV. This smaller value reflects the reduced hopping and is a direct consequence of the on-site Coulomb repulsion explicitly included in the model. The fact that the splitting is underestimated as compared to the experiment suggests that a smaller value of should be used for this system.

Feng et al. (2001) also investigated the effect of the superconducting transition on the ARPES spectra at (,0), where the bilayer splitting is stronger. The data measured above and below are presented in Fig. 34a and 34b, respectively. Note that the peak-dip-hump structure in Fig. 34a is totally unrelated to superconductivity (Sec. VI), as the data were taken well above ; instead it corresponds to the BB and AB split bands (indicated by circles and triangles, respectively). In the superconducting state (Fig. 34b), the two bands reach the same minimum binding energy (16 meV), indicating the opening of a superconducting gap with similar amplitude for both FSs (Sec. V). Furthermore, while no change was seen for the AB band at high-binding energy (see black circles in Fig. 34a,b), a double peak structure was detected close to at certain momenta (see crosses and bars in Fig. 34b). The appearance of a second sharp peak near below presumably corresponds to the sharpening of a structure that could not be resolved in the normal state. A possible origin of this effect may be the coupling between the BB state and a low-energy collective mode (either phononic or electronic in nature), which would result in the transfer of spectral weight to the characteristic energy of the mode (see Sec. VIII).
At this point the obvious question is why has a clear bilayer splitting never been observed before by ARPES, despite the intense effort? Obviously this achievement would have not been possible without the recent improvements in energy and momentum resolution. However, in this case the major breakthrough can probably be identified in the recent progress in high pressure annealing techniques. This allowed the synthesis of heavily overdoped single crystals of Bi2212, which appear to exhibit much better defined quasiparticle peaks, suggesting a more FL-like behavior.
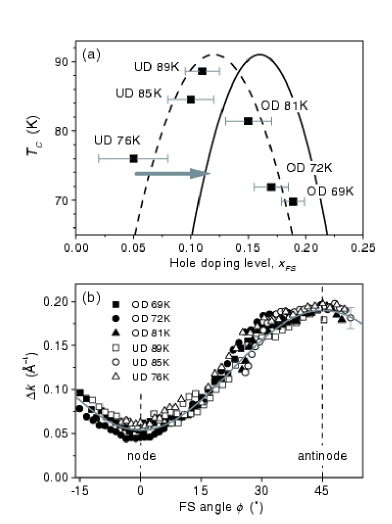
One could then speculate that the absence of two well-defined features in the spectra of less overdoped samples does not necessarily indicate the complete absence of bilayer splitting effects, which may be hidden in the breadth of the lineshapes. Indeed, this speculation is supported by many recent ARPES results Feng et al. (2002b); Chuang et al. (2001b); Kordyuk et al. (2001, 2002). For example, using the HeI line as the excitation energy, Kordyuk et al. (2002) could only observe one large holelike FS centered at . However, as shown in Fig. 35a the experimentally determined FS volume would correspond to a doping level which is 5-7% off the expected value (see gray arrow in Fig. 35a). This apparent violation of Luttinger’s theorem Luttinger (1960) can be understood by considering that the second sheet of FS resulting from bilayer splitting might have escaped detection do to matrix elements.

This is further corroborated by the results reported for the evolution of the MDC width along the FS. As shown in Fig. 35b, the angular dependence of the width does not change with doping and is thus unlikely to be due to many-body effects; in addition, its functional form is proportional to , which is in agreement with a bilayer splitting of the form , as determined in the overdoped regime Feng et al. (2001); Chuang et al. (2001a).
Evidence for bilayer splitting at under and optimal doping is also provided by systematic ARPES investigations performed as a function of doping and photon energy Feng et al. (2002b); Chuang et al. (2001b); Kordyuk et al. (2001, 2002); Gromko et al. (2002b). As shown in Fig. 36a, the BB and AB bands clearly resolved in overdoped Bi2212 with 22 eV photons become indistinguishable upon underdoping the system. However, in spectra taken with different photon energy at a given doping the centroid is found at different positions; it moves from close to to higher binding energies upon changing the photon energy from 47 to 22 eV (Fig. 36a). This behavior indicates the presence of two different components in the spectra, with opposite photon energy dependence as expected for BB and AB bands, which have opposite symmetry along the -axis with respect to the midpoint between the two CuO2 planes Chuang et al. (2001b); Feng et al. (2002b). Additional signatures of bilayer splitting can be observed by comparing spectra from Bi2212 and Bi2201 at similar doping levels (Fig. 36b). While in the nodal region the spectra have very similar lineshapes (not shown), the situation is much more complicated close to (,0). Note that in Fig. 36b, while the (,0) spectrum from overdoped Bi2212 (OD63) shows both BB and AB peaks, the one at (,0.2) reduces to only the BB peak because the AB band is already above . As a consequence, the spectra from Bi2212 and Bi2201 match almost perfectly at (,0.2) but not at (,0). In this context, the mismatch between optimally doped Bi2212 and Bi2201 spectra at (,0) and, in particular, the additional spectral weight at high energy observed in Bi2212 can be naturally attributed to the presence of the BB band. On the basis of these results, it was concluded that the broad lineshape observed in the normal state for under and optimally doped Bi2212 at (,0) has significant contributions from bilayer splitting effects Chuang et al. (2001b); Feng et al. (2002b). It was also proposed that BB and AB bands may become directly detectable in the superconducting state due to the sharpening of the peaks Kordyuk et al. (2001); Gromko et al. (2002b), which provides a possible explanation for the so-called peak-dip-hump structure typically detected only below at those doping levels (see Sec. VI and VIII.3.3).
IV.3.3 Summary
Despite the controversy over the FS, many of the ARPES results from Bi2212 are still reliable and the same holds for the qualitative descriptions that were developed on their basis. This is particularly true with regard to doping dependent studies performed under identical experimental conditions. For example, the magnitude and symmetry of the superconducting gap (Sec. V) and of the normal state excitation gap or pseudogap (Sec. VII), are relatively insensitive to the details of the FS topology.
Due to the limited doping range investigated, the ARPES results from Bi2212 are insufficient to conclude in favor of any of the four scenarios summarized in Fig. 15. While the FS of optimally doped Bi2212 resembles the one reported in Fig. 15a and 15d (let us here neglect the issue of bilayer splitting), in the underdoped region, due to the opening of the pseudogap along the underlying FS (Sec. VII), the data are reminiscent of the models depicted in Fig. 15b and 15c. The distinction between Fig. 15a and 15d has to be determined on the basis of the behavior near (,0), while between the models described in Fig. 15b and 15c it lies in the detection of the shadow FS given by the dashed line in Fig. 15c. Although it has been argued that the case of Fig. 15c does not apply to Bi2212 Ding et al. (1997), in contrast to an earlier report Aebi et al. (1994), no consensus has yet been reached.
IV.4 Bi2Sr2CuO6+δ
The investigation of the low-energy electronic structure should be an easier task for the single-layer system Bi2Sr2CuO6+δ (Bi2201) than for Bi2212. First, the ARPES spectra are free from possible complications arising from bilayer splitting. Second, Bi2201 has a lower which allows measurements at lower temperature (i.e., less thermal broadening), without complications due to the opening of the superconducting gap. Furthermore, as in the case of Bi2212, also in Bi2201 the partial substitution of Bi with Pb introduces additional disorder in the BiO planes which, in turn, suppresses the superstructural modulation and the intensity of the umklapp bands.
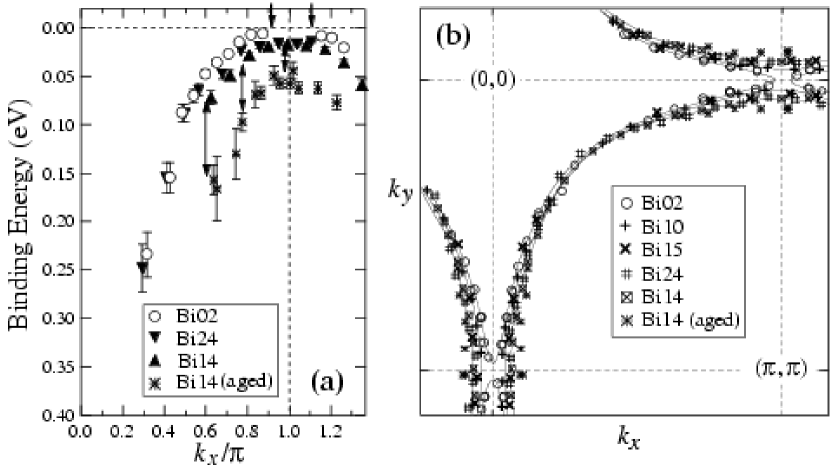
All these characteristics would make Bi2201 an ideal candidate to study the evolution of the FS topology with doping, providing a valuable comparison for the more complex case of Bi2212. On the other hand, similarly to the Bi2212 case, no data are available in the extremely underdoped regime and, therefore, the ARPES investigation of Bi2201 does not provide any more detailed information about the metal-insulator transition.
Recently, two independent investigations of the low energy electronic structure of Pb-doped Bi2201 for various dopings were reported by Takeuchi et al. (2001) and by Sato et al. (2001a, c). The ARPES spectra are characterized by a well defined quasiparticle band whose dispersion can be easily followed and is reported for different doping levels in Fig. 37a, while panel b presents the FS determined by various methods: by symmetrizing the spectra with respect to Norman et al. (1998b), and by dividing out the Fermi distribution broadened by the experimental resolution Greber et al. (1997). In underdoped and optimally doped samples the FS is characterized by a single hole barrel centered at (,), in good agreement with the expectation (Fig. 37b).
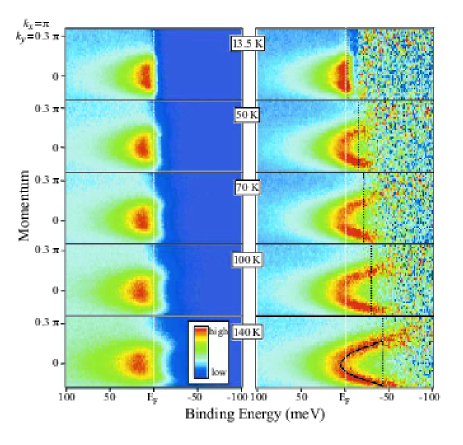
Upon increasing doping, the FS volume also increases (counting holes). In the overdoped regime and, in particular, for the overdoped Pb-Bi2201 sample characterized by K, the quasiparticle band crosses before (,0) as shown in Fig. 37a, defining an electronlike FS centered at (0,0), in agreement with the rigid band picture (Fig. 37b). The results reported by Takeuchi et al. (2001) represents the first direct observation of a continuous doping evolution of the FS topology of Bi2201 from holelike to electronlike, similar to that seen for LSCO.
This topological crossover was not observed by Sato et al. (2001a, c), possibly due to a slightly lower doping level of the samples (instead in the underdoped and optimally doped regime, the results from the two different groups are essentially the same). To determine whether the saddle point at (,0) is above or below , Sato et al. (2001c) performed a detailed temperature dependence study. The left panels of Fig. 38 present data which indicate the presence of spectral weight below the Fermi level. From the bare data it is hard, however, to judge whether the quasiparticle band is indeed below or the intensity corresponds to the broadened tail of a band located just above . This issue can be addressed in a more conclusive way by dividing the spectra by the Fermi-Dirac distribution function at each temperature. The results are presented in the right panels of Fig. 38 and show the actual dispersion in a much clearer fashion. It is now obvious that the saddle point is located approximately 5 meV below (which indicates that the difference between the results reported by the two groups is very subtle). As a more general remark, it should be emphasized that this kind of analysis appears to be a better method than the simple tracking of the ARPES intensity in determining the position of a quasiparticle band very close to the Fermi energy, especially in borderline cases such as in proximity to a topological transition.
IV.5 Bi2Sr2Ca2Cu3O10+δ
Very recently, the first ARPES studies of the trilayer cuprate superconductors Bi2Sr2Ca2Cu3O10+δ (Bi2223) have been carried out by several groups Feng et al. (2002a); Sato et al. (2001d); Müller et al. (2002). As shown in Fig. 39 where normal-state data from nearly-optimally doped Bi2223 are presented, dispersive quasiparticle peaks were detected by ARPES (including the umklapp features due to the superstructure of the BiO layers, already discussed for Bi2212 and Bi22201). The FS obtained by integrating the ARPES spectra in a meV energy window at is a large holelike pocket centered at the (,) point (see Fig. 39d). At present, no clear evidence of additional sheets of FS due to interlayer coupling was reported, contrary to what is theoretically predicted. In particular, one would expect the FS to be comprised of bonding (BB), nonbonding (NB), and antibonding (AB) sheets [see, e.g., Mori et al. (2001)]. Whether or not the three FS sheets would have the same topology depends on the details of the system (such as, e.g., the doping level). In particular one could expect the BB and NB FSs to be holelike in character, while the AB could be electronlike.
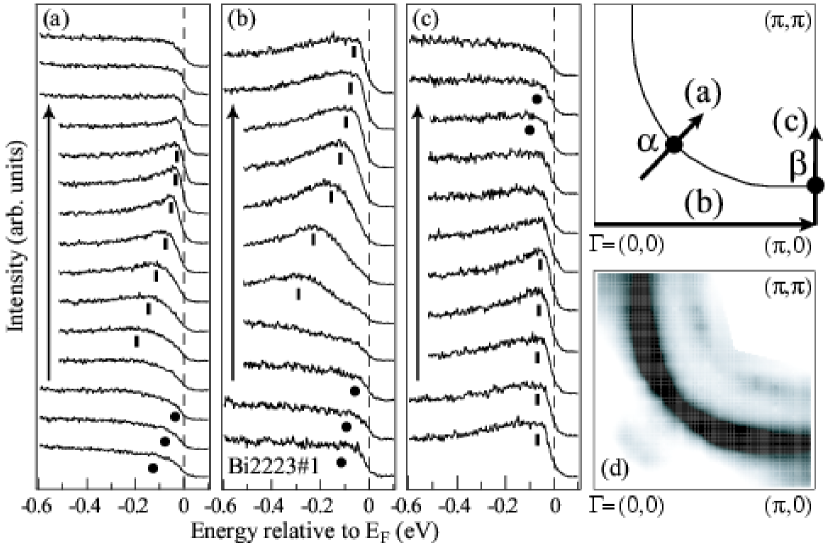
However, because of the short escape depth of the outgoing photoelectrons, the photoemission intensity is expected to be dominated by the signal from the outer CuO2 plane and, in turn, from the NB sheet of FS (the NB wavefunction has the highest probability density on the outer CuO2 plane because, contrary to the BB and AB ones, it is the antisymmetric combination of the wavefunctions of only the two outer planes within a trilayer block). This could be the reason why a single holelike FS was observed by ARPES for Bi2223 (Fig. 39d). The above speculation, however, needs to be tested by more extensive experiments.
IV.6 YBa2Cu3O7-δ
The Y-based copper oxides are probably the most important family of high- superconductors. In fact YBa2Cu3O7-δ (Y123) was the first compound for which superconductivity with K (i.e., the liquid nitrogen boiling point) was discovered Wu et al. (1987). Furthermore, it is on the Y-based cuprates that some of the most important experiments have been preformed. One specific feature of Y123 is that, contrary to the other cuprate HTSCs, the reservoir layers in these materials contain CuO chains aligned along the - direction (see Fig. 12 or 40 for the Brillouin zone notations). Because of the presence of the CuO chain layer Y123 possesses an orthorhombic crystal structure Jorgensen et al. (1987), which according to band calculations should result in a significant anisotropy of the in-plane electronic structure Andersen et al. (1995). Compared to other compounds, in recent years relatively little photoemission work has been done on Y123, in particular as far as the doping evolution of the electronic structure is concerned [Liu et al. (1995); see also Shen and Dessau (1995); Lynch and Olson (1999)]. This is partly due to the natural twinning of the Y123 crystals (i.e., domains orthogonal to each other with respect to the CuO chain orientation are present), and to generic sample quality issues which are responsible for the poor quality of the cleaved surface Edwards et al. (1992); Schabel et al. (1998a). However, the most serious problem in performing photoemission experiments on Y123 is represented by the presence of a very narrow and intense surface state peak located 10 meV below at both and Schabel et al. (1998a). This feature, which was initially interpreted as an extended van Hove singularity analogous to the one observed in the Bi-based superconductors Gofron et al. (1994), dominates over the low-energy bulk signal hindering the investigation of the intrinsic electronic structure.
More detailed studies of untwinned samples were carried out only near optimal doping. The most important results are the identification of the surface state, dispersion, and the superconducting gap Schabel et al. (1997); Schabel et al. (1998b, a).
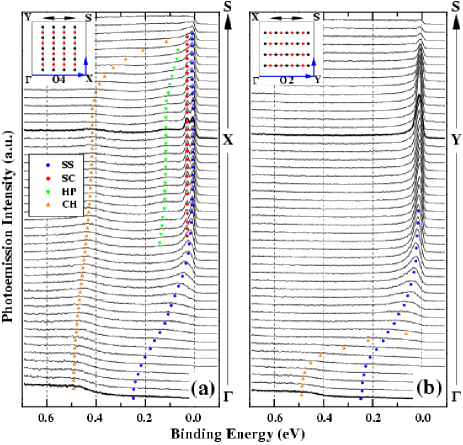
The establishment of the surface state nature of the intense peak just below [originally proposed on the basis of the dependence of its intensity on photon energy/polarization, as well as on oxygen, Co, and Pr doping Schabel et al. (1998a)] is crucial in order to understand the data, and in particular to extract information on the superconducting state (Sec. V.5).
Recently, Lu et al. (2001) reported significant progress in the investigation of Y123 by ARPES, made possible by the improvement in sample quality Liang et al. (1998) and instrumental resolution.
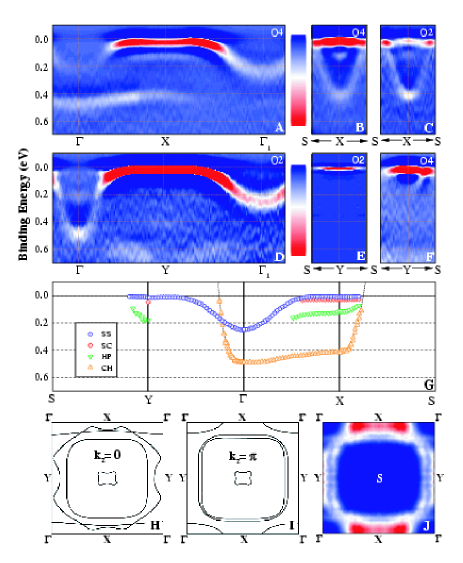
Fig. 40 presents the energy distribution curves from Y123 along the high symmetry directions in the Brillouin zone, for polarization perpendicular (Fig. 40a) and parallel (Fig. 40b) to the CuO chains direction. Fig. 41a-f present the intensity plots of the second derivative with respect to the binding energy of the ARPES spectra, which allow one to follow the dispersion of the broader and weaker electronic bands. Lu et al. (2001) identified the four dispersive features summarized in Fig. 41g: surface state (SS), superconducting peak (SC), hump (HP), and chain state (CH). As one can see in Fig. 40, the surface state at and is the most pronounced feature in the spectra. It has to be emphasized that while the surface state nature of this peak has received strong support from its high sensitivity to surface degradation at elevated temperatures Lu et al. (2001), the precise origin of this state is not well understood at present: on the one hand, the scenario of a chain-related surface state proposed by Schabel et al. (1998a) appears to be consistent with recent scanning tunnelling microscopy data Derro et al. (2002); on the other hand, this assignment is difficult to reconcile with the 2D dispersion of this feature along -X and -Y (blue symbols in Fig. 41g). The broad feature at 400 meV below at the X point (yellow symbols in Fig. 41g) was assigned by Lu et al. (2001) to a bulk chain-derived state, rather than to a bonding state as previously suggested Schabel et al. (1998a). This interpretation is based on the quasi 1D character of this feature (i.e, much larger dispersion along the chain direction than perpendicular to it), and the good agreement with band structure calculations Andersen et al. (1995). Two more features are clearly detected at the point and are marked with red and green symbols in Fig. 40a and 41g. These are related to the electronic structure of the CuO2 planes and will be further discussed in Sec. V.5.
In summary, the ARPES results from Y123 reveal bulk bands originating from the CuO chains and the CuO2 planes, and a surface state band. As shown in Fig. 41h-j, the FS estimated from the near- integrated intensity is consistent with the band-structure results Andersen et al. (1991, 1994): a large holelike FS centered at is observed, along with a 1D FS related to the bulk CuO chains (obviously this can only be an approximate comparison as the experimental data were taken in the superconducting state and the intensity at and is significantly affected by the presence of the surface state). This results in two FS crossings along -, one being due to the chain and the other to the plane electronic bands. Lastly, it has to be stressed that because of the reassignment of the 400 meV dispersive peak to a bulk chain state rather than a CuO2 plane state, at present there is no consensus for bilayer splitting in Y123 contrary to what had been previously suggested by Schabel et al. (1998a). Also, no evidence of shadow bands is seen in Y123, which possibly supports a structural rather than a magnetic origin for these additional features in Bi2212.
IV.7 Nd2-xCexCuO4
After having discussed the ARPES results from many hole-doped (or p-type) systems, in this final section of our overview of the doping evolution of the normal-state electronic structure of the cuprates we will focus on the electron-doped (or n-type) superconductor Nd2-xCexCuO4 (NCCO). As shown in Fig. 1a, the undoped material is an AF insulator. Upon the substitution of Ce for Nd, the AF ordering temperature drops precipitously approaching , and superconductivity occurs between for oxygen reduced samples. Note that there is only an approximate symmetry in the temperature/doping phase diagram about the zero doping line between p-type and n-type systems, as the AF phase is much more robust in the electron doped material and persists to much higher doping levels. At the same time, superconductivity occurs in a much narrower doping range. The relevance of a comparative study of n and p-type cuprate HTSCs is that of a verification of the symmetry, or lack thereof, between doping the AF insulator with electrons or holes. This issue has important theoretical implications as most models which are thought to capture the essence of high- superconductivity implicitly assume electron-hole symmetry.
After the early investigations by King et al. (1993) and Anderson et al. (1993), high energy and momentum resolution ARPES data on superconducting NCCO (, K) were reported only very recently Armitage et al. (2000); Armitage et al. (2001a, b); Armitage et al. (2002); Sato et al. (2001b).

Fig. 42 presents the ARPES spectra (a,b) and the corresponding image plots (b,c) reported by Sato et al. (2001b). The results are analogous to those obtained by Armitage et al. (2001b). Along the (0,0)-(,) direction, NCCO shows a dispersion which is ubiquitous among the cuprates, with a quasiparticle peak dispersing quickly towards and crossing it at about (/2,/2). Similarly, a peak disperses and crosses also along (,0)-(,), in agreement with the expected holelike FS (see insets of Fig. 42a-b). However, while in the p-type cuprates at (,0) the quasiparticle peak forms a flat band just below , in NCCO the flat band is located at 300 meV below .
Studies of the doping evolution of the electronic structure were recently carried out by Armitage et al. (2002). As a starting point, these authors have identified a charge-transfer band feature in the undoped insulator Nd2CeO4, which has the same dispersion as that found in the parent compounds of the p-type HTSCs (such as Ca2CuO2Cl2; Sec. IV.1). This indicates that the electronic structure of the CuO2 plane in these two compounds is the same, although one can be doped with electrons and the other with holes. More interestingly, the charge-transfer band in Nd2CeO4 is at about 1.2 eV below , which is comparable to the charge-transfer gap energy if the chemical potential is pinned close to the conduction band minimum. Data for different dopings are presented in Fig. 43, which shows the ARPES spectra from along the FS contour expected from band structure calculations. At low doping (4%), the spectra are gapped near (/2,/2) over an energy scale of about 200 meV and exhibit a broad maximum around 300 meV (Fig. 43a). Moving towards (,0), the 300 meV feature remains more or less at the same energy, and additional spectral weight develops near . Upon increasing the doping level, the ARPES features become sharper and the one at (/2,/2) moves closer to . At optimal doping, (15%) the spectra are characterized by a sharp quasiparticle peak at both at (,0) and (/2,/2), but not in the region in between where the lineshape is still very broad (Fig. 43c). The momentum dependence of the spectral weight (integrated from to meV) is displayed for the different doping levels in Fig. 44.

At 4% the low-energy weight is concentrated in a small pocket around (,0), with a volume approximately consistent with the nominal doping level . Upon increasing doping, one can observe both the modification of the pockets and the emergence of low-lying spectral weight around (/2,/2); eventually (15%), the intensity evolves into a large holelike FS centered at (,) with a volume given by . In the lower panels of Fig. 44 one can follow the evolution of the overall electronic structure across the (charge-transfer) insulator to metal transition. In the insulator the valence band maximum is found at (/2,/2). At 4% doping, spectral weight develops inside the gap (blue) in addition to the low-energy feature (red) which gives rise to the (,0) pockets discussed above; one can still observed some remanent of the charge-transfer band of the insulator. At higher doping values the latter disappears and the incoherent spectral weight evolves into dispersive quasiparticle bands which define the large holelike FS centered at (,).
It should be emphasized that although 15% doped NCCO appears to have a large FS with a volume given by counting electrons, in agreement with Luttinger’s theorem Luttinger (1960), the data still present some unexpected features. What catches one’s eye in Fig. 44c are the distinct regions of reduced intensity along the FS contour near (0.65,0.3) and (0.3,0.65), in which the ARPES spectra are extremely broad even at (Fig. 43c). This behavior appears to be an intrinsic property of the spectral function of NCCO, as evidenced by the comparison of data obtained for different photon energies and experimental geometries Armitage et al. (2001b).
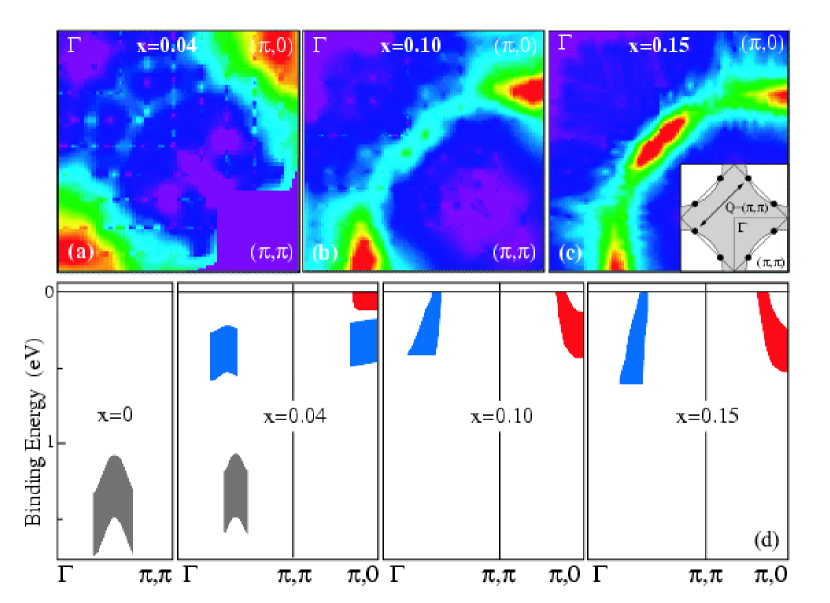
Although some effects due to the energy and polarization dependence of the photoemission matrix elements are present, the overall systematics does not change. As noted by Armitage et al. (2001b), the regions of suppressed weight correspond to the intersections between the Luttinger FS and the AF Brillouin zone boundaries (see inset of Fig. 44c). These regions, connected by a scattering vector, are referred to in the literature as hot spots Pines (1997); Schmalian et al. (1998); Kampf and Schrieffer (1990a, b). The scattering experienced by the charge carriers has been proposed to be the origin of the pseudogap observed in the underdoped p-type HTSCs near (,0). What is seen in NCCO is reminiscent of that behavior (Sec. VII), although in the present case the effects are detected at (0.65,0.3). This could merely be a consequence of the different FS volume and, in turn, of the intersections between FS and AF zone being pushed away from (,0) for NCCO. In this view, magnetic fluctuations would be a natural source of scattering. More generally, however, any umklapp scattering would result in a breakdown of FL theory and in a segmented FS, as in Fig. 15b Furukawa et al. (1998); Furukawa and Rice (1998); Honerkamp et al. (2001).
It should be stressed that the doping dependence of the ARPES data from NCCO suggests the absence of particle-hole symmetry in the quasiparticle dispersion of the cuprates. In fact, the lowest energy states in p-type materials are located at (/2,/2), while they appear at (,0) in the n-type systems. This constitutes the first direct evidence for the Mott gap not being a direct gap. This is consistent with calculations performed within the --- model (successfully used to describe the undoped insulator data; Sec. IV.1), in which the breaking of particle-hole symmetry results from the inclusion of the term. In particular, the asymmetry seen by ARPES between undoped and 4% doped NCCO is well reproduced by a mean field solution of the --- model Kusko et al. (2002). Of course, the dynamic aspects of the data (e.g., the development of spectral weight inside the gap) cannot be obtained within a mean-field approach; rather, the transfer of spectral weight upon doping is generally found in cluster model calculations.
IV.8 Discussion
The most complete ARPES investigations of the doping evolution of the normal state electronic structure have been performed on LSCO, which can be studied over a wide doping range. The results from this system have been extensively interpreted in the stripe scenario, which provides a possible explanation for many of the experimentally observed features: (i) the two-component electronic structure seen in the very underdoped regime that is suggestive of the creation of new electronic states inside the Mott gap; (ii) the lack of chemical potential shift in the underdoped regime; (iii) the straight FS segments observed under certain experimental geometries that are indicative of 1D electronic behavior. However, there are aspects of the data that are difficult to reconcile with a naive stripe picture. One such aspect is the Fermi-arc feature observed in ARPES experiments at very low doping levels, defined by the lowest-energy feature of the two-component electronic structure Yoshida et al. (2002). Furthermore, as doping is increased, LSCO becomes more of a band-like system with an LDA-like FS, and the signatures of stripes weaken; near optimal doping, the distinction between the pictures reported in Fig. 15a and 15d would become blurred.
For the Bi-based cuprates, on the other hand, there are no extensive reliable data in the underdoped regime and, in particular, near the metal-insulator transition boundary. To date, those features which have been discussed as possible signatures of a charge ordered state in extremely underdoped LSCO have not been observed in other systems. In the case of Bi2212, long straight segments of FS have been observed for the bonding band along the direction (0,0)-(,0). This was already noted in the early low resolution data Feng et al. (1999), but it is more clearly displayed by the recent data taken with improved momentum resolution Kordyuk et al. (2002). The presence of nested FS segments could give rise to a charge-density wave instability. This scenario is however different from the stripe interpretation of somewhat similar features observed in LSCO. In the latter case the straight FS segments would be the result and not the cause of the formation of quasi-1D stripes. Furthermore, it has to be emphasized that the persistence of the partial FS nesting well into the overdoped regime in Bi2212 makes a connection with a simple stripe instability less realistic Kordyuk et al. (2002). On the other hand, why the FS nesting does not lead to a charge-density wave instability is an interesting problem. In this regard, the presence of the antibonding sheet of FS might have an important role, which may be worthwhile studying.
At this stage of the research on the HTSCs and their undoped parent compounds, it does not seem possible to firmly conclude in favor of one particular comprehensive theoretical model, in spite of the considerable progress made in recent years. This situation is emphasized by the longstanding puzzle concerning a fundamental question, i.e., how does the doping of a Mott insulator take place (Fig. 14). On the one hand, contrary to the early report by Allen et al. (1990), very recent angle-integrated photoemission results from NCCO Steeneken (2001); Harima et al. (2001) favor a scenario based on the shift of the chemical potential, which is also consistent with the ARPES data from NCCO. Actually, this would be in agreement with --- model calculations, which reproduce the substantial deformation of the quasiparticle band structure upon doping, and suggest a unifying point of view for both the undoped insulator and the HTSC Eder et al. (1997); Kusko et al. (2002). The chemical-potential shift scenario is supported also by the data available on Na-CCOC, which show a quasiparticle dispersion strikingly similar to the one of undoped CCOC. On the other hand, the lack of chemical potential shift observed in LSCO in the underdoped regime and the detection of multiple electronic components support the formation of in-gap states upon doping the systems and, consequently, the need for a completely new approach. Further scrutiny is required to establish if the evolution from Mott insulator to HTSC is truly accounted for by one of the existing models or whether a different approach, maybe beyond a purely electronic description, is required (e.g., in which other factors, such as the underlying structural distortions, are explicitly included).
V Superconducting gap
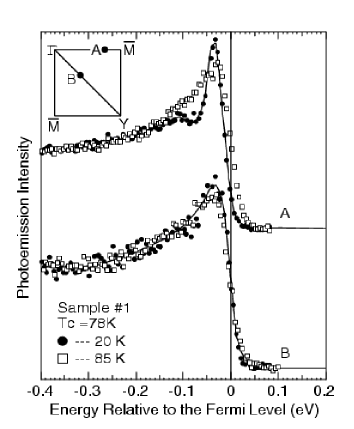
The ability of ARPES to detect spectral changes across the superconducting phase transition is a remarkable testimony to the improvement in resolution over recent years, and is the key to the success of this technique in the study of the cuprate HTSCs. The most important results obtained in the superconducting state are the detection of: (i) the anisotropic -wave gap along the normal-state FS, which contributed to the debate on the pairing mechanism [for a recent review on the pairing symmetry in cuprate HTSCs see Tsuei and Kirtley (2000a)]; (ii) the dramatic changes in the spectral lineshape near (,0). In the current section, we will review point (i) for several systems while we will come back to (ii) later, within the discussion of the superconducting peak (Sec. VI.1) and of the self-energy corrections (Sec. VIII).
V.1 Bi2Sr2CaCu2O8+δ
Fig. 45 shows the early ARPES data from an overdoped Bi2212 sample at two different momenta in the Brillouin zone Shen et al. (1993). In the nodal region (B), the spectra taken above and below are very similar indicating a small or vanishing gap. Near the (,0) point (A), on the other hand, normal and superconducting-state spectra are clearly very different: in addition to the obvious lineshape evolution, note also the shift of the leading edge, which reflects the opening of a sizable energy gap. These results strongly suggest that the superconducting gap is anisotropic and, in particular, consistent with a -wave order parameter Scalapino (1995).
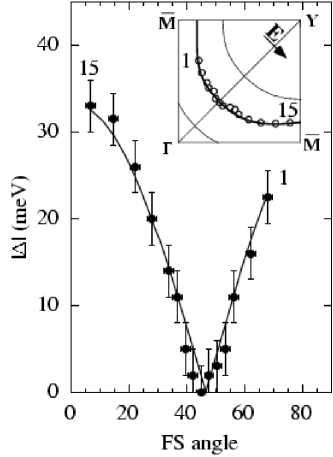
Together with the microwave penetration depth results Hardy et al. (1993), this direct evidence for the gap anisotropy played a major role in the early debate on the pairing symmetry Levi (1993).
Initially the magnitude of the gap was quantified simply on the basis of the position of the leading-edge midpoint of the ARPES spectra, which has since become a standard procedure Tinkham (1996). In particular, one could either follow the leading-edge shift of the spectra measured on the superconducting material above and below , or compare at the same temperature below the position of leading edges for the superconductor and a polycrystalline noble metal like Pt or Au (a caveat here is that the comparison between the nontrivial lineshape measured on a HTSC single crystal and the structureless Fermi edge from a polycrystalline metal may be quantitatively inaccurate). Subsequently, some effort has been invested in trying to perform a more detailed analysis of the superconducting gap. In principle, the gap could be estimated by measuring the quasiparticle dispersion in the vicinity of the Fermi level which, within the BCS framework Schrieffer (1964), is predicted to change from to upon entering the superconducting state. However, the determination of on the basis of the change in the dispersion is a very difficult task because the cuprates are not conventional FL metals in the normal state and, as a consequence, cannot be determined with sufficient accuracy. Furthermore, this analysis is also complicated by the dramatic change in quasiparticle lineshape that takes place across the phase transition (Fig. 45). Nonetheless, by fitting energy distribution curves at different momenta with a phenomenologically broadened BCS spectral function, Ding et al. (1995a, b, 1996b) managed to obtain the momentum dependence of the gap along the normal state FS (Fig. 46). The results agree with the functional form extremely well.
It has to be emphasized that such a good fit to the -wave gap functional form as the one of Fig. 46 is the exception rather than the norm. In most cases, and especially in the underdoped regime, instead of the “V”-like shape cusp seen in the data of Fig. 46, one finds an extended area around the nodal region characterized by gapless excitations.191919Dessau et al. (1993); Ding et al. (1996b); Mesot et al. (1999); Harris et al. (1996); Norman et al. (1998a). In this regard, it is important to mention that also recent high momentum resolution results from underdoped Pb-Bi2212 ( K), for which the bilayer splitting could be resolved making the analysis more reliable, indicated a “U” rather than a “V”-like shape for the superconducting gap along the bonding FS Borisenko et al. (2002).202020Note that although an identical gap was detected for both bilayer split FSs in the antinodal region, the momentum dependence along the antibonding one could not be investigated in detail. In order to account for this behavior Mesot et al. (1999) suggested that higher harmonics consistent with -wave symmetry, such as , should be included in the expansion of the gap function , in addition to the simple “V”-like first term Wenger and Östlund (1993). Presently, however, this is still an open issue that deserves further scrutiny for its significant theoretical implications.
V.2 Bi2Sr2CuO6+δ
The angular dependence of the superconducting gap in Bi2201 was first investigated by Harris et al. (1997). Similar to the case of Bi2212, the results from Bi2201 appear to be consistent with a -wave pairing symmetry, albeit a larger region of gapless excitations was observed close to the nodal direction. The overall magnitude of the superconducting gap ( meV at optimal doping) is approximately a factor of three smaller than for Bi2212 at similar doping levels, consistent with the reduction in transition temperature. More recently, the superconducting gap was investigated with improved resolution by Sato et al. (2001a). By comparing the data obtained in the nodal and antinodal regions, these authors also concluded in favor of a -wave symmetry order parameter with a maximum size of 10-15 meV at (,0).
V.3 Bi2Sr2Ca2Cu3O10+δ
The superconducting gap in Bi2223 was recently measured by several groups Feng et al. (2002a); Sato et al. (2001d); Müller et al. (2002). In Fig. 47a, where the temperature dependence of the (,0) ARPES spectra is presented, one can clearly observe the remarkable change of quasiparticle lineshape that takes place for , as well as the opening of the superconducting gap. Fig. 47b shows the angular dependence of the superconducting gap as determined from the shift of the leading-edge midpoint along the normal-state FS.
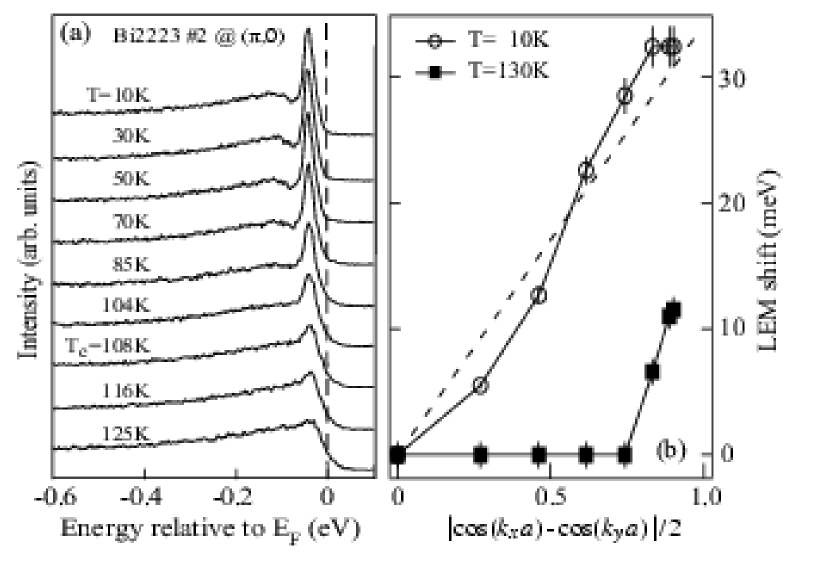
The results are consistent with a -wave symmetry order parameter, with a magnitude which is the largest so far reported among the Bi-based cuprate superconductors.
V.4 La2-xSrxCuO4
The superconducting gap in LSCO is much smaller than in Bi2212 and, so far, no detailed investigations have been reported. As we already mentioned in Sec. IV.2 when discussing the data of Fig. 26, the presence of a finite superconducting gap was evidenced by the shift of the leading-edge midpoint of the spectra along the normal-state FS Ino et al. (1999). On the basis of this behavior Ino et al. (1999) estimated a superconducting gap for optimally doped LSCO of about 10-15 meV, in agreement with the results from other techniques Chen et al. (1994); Yamada et al. (1995); Nakano et al. (1998). Furthermore, it appears that the measured gap is qualitatively consistent with a -wave scenario. Similar conclusions were reached by Sato et al. (1999) on the basis of a detailed fit of angle-integrated photoemission data.
V.5 YBa2Cu3O7-δ
Information on the superconducting state of Y123 by ARPES can be obtained only after the identification of the surface state (Sec. IV.6), which dominates the photoemission spectra at both and points in the Brillouin zone (note that it is at these momenta that a gap, if -wave like, would have its maximum amplitude). By investigating the region, where the surface state was weaker in that specific experimental geometry, Schabel et al. (1997) provided supporting evidence for a superconducting gap whose momentum dependence is consistent with the -wave form.
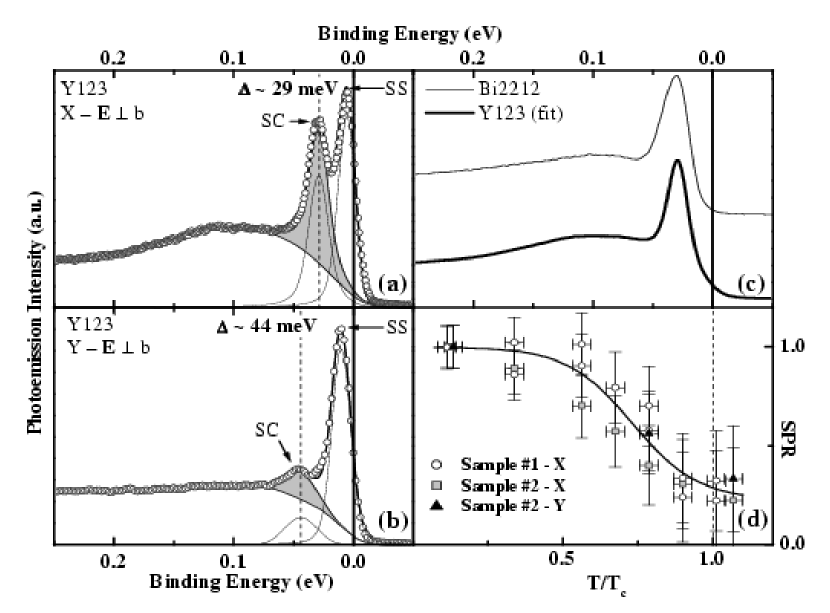
In that study, however, due to sample quality issues the surface was not stable enough to allow cycling the temperature during the experiments.
Recently, the substantial improvement in sample quality and instrumental resolution allowed the convincing detection of superconductivity related features on Y123 Lu et al. (2001). As shown in Fig. 48a,b, after subtracting the surface state contribution by means of a phenomenological fitting procedure, the remainder of the fitted function looks strikingly similar to the lineshape typically observed in Bi2212 at () in the superconducting state (see Fig. 48c and Sec. VI). Direct evidence for the second peak being related to superconductivity comes from measurements performed by cycling the temperature, which show that this feature consistently disappears above . This behavior is summarized for several overdoped samples ( K) and momenta in Fig. 48d, where the normalized superconducting peak intensity is plotted (note that in Fig. 48d SPR refers to superconducting peak ratio, which will be defined in Sec. VI.1).
An interesting finding, which is specific to Y123, is the strong - anisotropy of the in-plane electronic structure. In fact, as determined by Lu et al. (2001), the energy positions of peak and hump for overdoped Y123 are: 29 () and 120 meV () at X, and 44 () and 180 meV () at Y. These results, in agreement with those from other techniques Polturak et al. (1993); Limonov et al. (2000), indicate a 50% difference in the gap magnitude between X and Y, which represents a remarkable deviation from the ideal pairing symmetry.
V.6 Nd2-xCexCuO4
The improved experimental resolution also allowed the successful detection of the superconducting gap in the electron doped superconductor NCCO Armitage et al. (2001a); Sato et al. (2001b), a task that was not possible before King et al. (1993); Anderson et al. (1993).
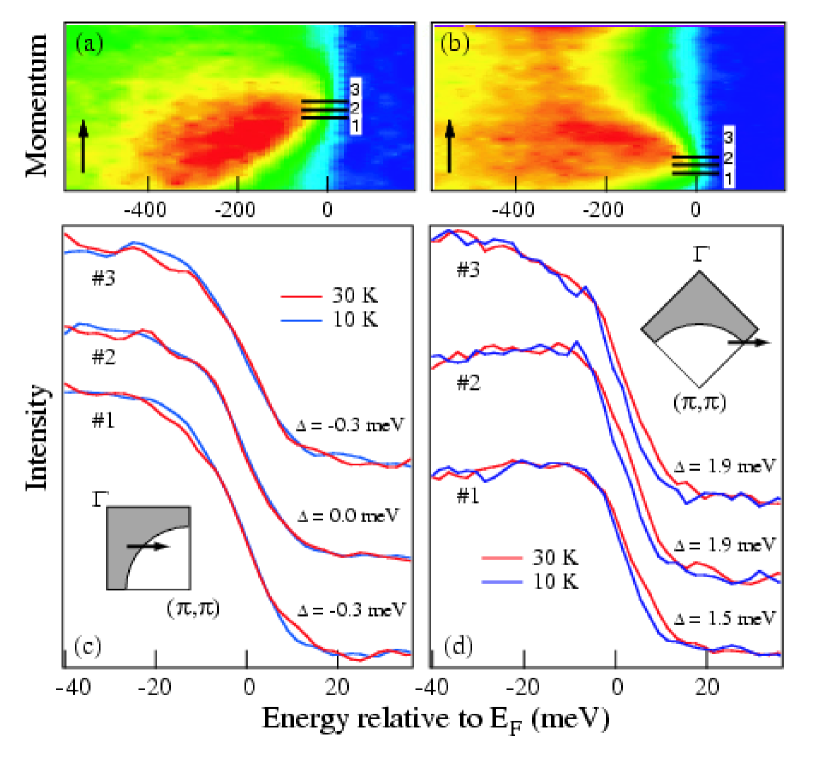
This investigation is of particular relevance because, whereas for the hole-doped HTSCs it is now generally accepted that the order parameter has a majority component of -wave symmetry [see, e.g., Tsuei and Kirtley (2000a)], for the electron doped systems this issue is less clear. On the one hand, an isotropic superconducting gap was supported by early tunnelling Huang et al. (1990), microwave penetration depth Wang et al. (1990); Wu et al. (1993), and Raman experiments Stadlober et al. (1995). On the other hand, this picture has been seriously questioned by recent scanning SQUID microscopy measurements on tricrystal films, which provided direct evidence for an order parameter with a large -wave component Tsuei and Kirtley (2000b).
In order to investigate the superconducting gap by ARPES, Armitage et al. (2001b) focused on the FS crossings near (/2,/2) and (,0.3) in the Brillouin zone (see Fig. 49a,b), where a superconducting gap is expected to be zero and maximum, respectively. The blue and red curves in Fig. 49c-d are data collected below and above K, respectively. Near the (/2,/2) region (Fig. 49c), one does not see a shift of the leading edge of the spectra with temperature, indicating minimal or zero gap. Near (,0.3) on the other hand, all curves show a clear shift below of about 1.5-2 meV, in agreement with the opening of a superconducting gap (Fig. 49d). Systematic estimates for the leading-edge midpoint shift were obtained by means of a phenomenological fitting procedure and are indicated, for the different spectra, in Fig. 49c-d. Armitage et al. (2001a) concluded that, although an anisotropic -wave order parameter with a small amplitude in the nodal region cannot be completely excluded, these results provide support for a -wave pairing state in NCCO. Furthermore, as the leading-edge analysis can underestimate the superconducting gap value by as much as a factor of 2 Ding et al. (1995a); Loeser et al. (1997), a gap of about 4 meV would be consistent with the ARPES data, in agreement with other techniques Huang et al. (1990); Wang et al. (1990); Wu et al. (1993); Stadlober et al. (1995); Kokales et al. (2000); Prozorov et al. (2000).
Similar results were also reported by Sato et al. (2001b). In this case, the authors did not perform temperature dependent measurements on NCCO across the phase transition but relied on the comparison, at one fixed temperature below , between the Fermi edges measured on polycrystalline Pt and on a single-crystal of NCCO. Sato et al. (2001b) detected for NCCO a leading edge shift of about 2-3 meV at the Fermi crossing along (,0)-(,) and no shift at the Fermi crossing along (0,0)-(,). Furthermore, by fitting the data with a phenomenologically broadened BCS spectral function Ding et al. (1995a, b, 1996b), they concluded in favor of a -wave gap of about 5 meV, in good agreement with the estimate by Armitage et al. (2001a).
V.7 Discussion
From the results presented in this section it is clear that the cuprate HTSCs are characterized by an overall -wave pairing symmetry, although further scrutiny is required for specific issues such as the existence of an area of gapless excitations in the nodal region, which would hint to significant deviations from a pure symmetry. Furthermore, as summarized in Fig. 50 where ARPES as well as tunnelling spectroscopy results are presented for several families of cuprates, at optimal doping the gap magnitude of the different systems scales linearly with the corresponding Feng et al. (2002a); Sato et al. (2001a, d). In particular, the gap versus data obtained from the position of the leading-edge midpoint can be fitted by a line across the origin corresponding to the ratio Feng et al. (2002a).
At this stage, a system that seems to stand out is Y123, as evidenced by the 50% anisotropy between the gap amplitude at and . As discussed by Lu et al. (2001), this anisotropy could originate from the orthorhombicity of the CuO2 planes in Y123 which, according to band structure calculations, should affect the normal state electronic structure Andersen et al. (1995).

Alternatively, it could be a consequence of the presence of the CuO chains which, for strong chain-plane hybridization, can directly affect the CuO2-plane-derived electronic structure Atkinson (1999). Anyway it seems that for Y123, rather than a pure symmetry, alternative models should be considered Atkinson (1999); Wu (2002).
Although not detected by ARPES, significant deviations from a simple symmetry may be present in the case of NCCO. In fact, a non monotonic -wave superconducting order parameter has been recently proposed on the basis of Raman experiments Blumberg et al. (2002). These results, whose interpretation however was recently questioned Venturini et al. (2002), were taken as an indication that the absolute maximum in gap magnitude may be located at the intersection between the holelike FS and the AF zone boundary (the so called hot spots indicated in the inset of Fig. 44c), rather than at (,0) as in the p-type cuprate superconductors. In this regard, as for the possible deviations from a “V”-like cusp in the nodal region for the p-type materials Mesot et al. (1999), it was proposed that high order harmonics should be included in the expansion of the gap function Guinea et al. (2002). This would account for a doping evolution of the gap anisotropy and, in particular, for the maximum gap amplitude being pushed away from (,0) in optimally doped NCCO. However, in order to conclusively address these issues, more detailed ARPES studies of the momentum dependence of the superconducting gap in both n and p-type HTSCs are required.
VI Superconducting peak
We now move on to the second well-known phenomenon observed in the ARPES data below , namely the dramatic change in lineshape of the (,0) spectra, first seen in Bi2212 Dessau et al. (1991); Hwu et al. (1991): a sharp quasiparticle peak develops at the lowest binding energies followed by a dip and a broader hump, giving rise to the so called peak-dip-hump structure. This evolution can be clearly seen in Fig. 51, or in Fig. 45 where the normal and superconducting state spectra from (,0) and (/2,/2) are compared. While the opening of the superconducting gap has been observed in many different cuprate HTSCs, for a long time the emergence of a sharp peak below appeared to be a phenomenon unique to Bi2212.
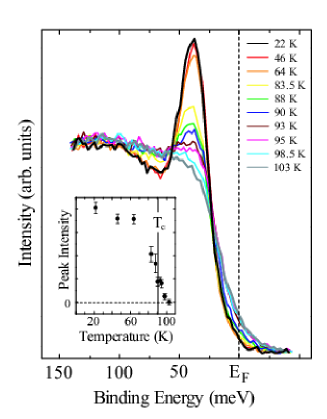
Only very recently, a similar feature has been detected below also on Y123 and Bi2223 (see Sec. V.5 and VI.2, respectively). However, as it is on Bi2212 that the most extensive body of work for doping, temperature, and momentum dependence of this feature is available, in this section we will mainly focus on that material.
Because the emergence of the peak-dip-hump structure in the Bi2212 (,0) spectra is the most remarkable effect seen across , a lot of work has been devoted to the experimental and theoretical investigation of this behavior. However, as we will discuss in more detail below and in Sec. VIII, the lineshape analysis of the ARPES spectra from Bi2212 is a very controversial subject and is currently matter of an intense debate. In particular, the recent observation of bilayer band splitting in Bi2212 (Sec. IV.3.2) suggests that the peak-dip-hump structure near (,0) needs to be completely re-explored. It is indeed possible that its main features could be interpretable as bilayer splitting effects. Nonetheless, due to the present uncertainty and the inherent interest of this issue, in this section we will review previous analyses, focusing mainly on the experimental phenomenology.
VI.1 Bi2Sr2CaCu2O8+δ
The connection between the emergence of the peak-dip-hump structure and the onset of superconductivity is evidenced by detailed temperature dependent investigations.212121Loeser et al. (1997); Franz and Millis (1998); Fedorov et al. (1999); Millis (1999); Feng et al. (2000); Ding et al. (2001). Although it starts to manifest itself slightly above , it is below that the quasiparticle peak really stands out. This can be clearly observed in the high-resolution (8 meV) data from optimally doped Bi2212 presented in Fig. 51, which indicate an intrinsic width for this peak of about 14 meV Fedorov et al. (1999).
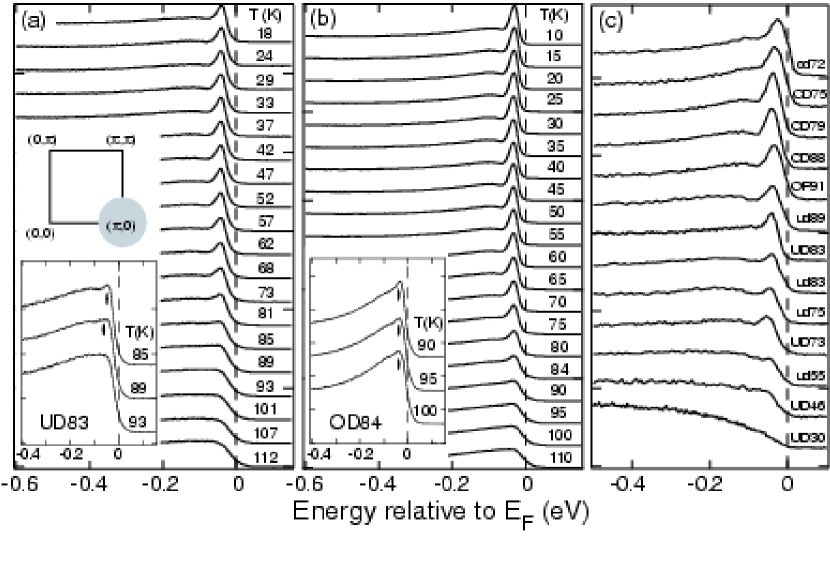
Temperature dependent data from underdoped and overdoped Bi2212 are presented in Fig. 52a,b Feng et al. (2000). As shown in particular in the insets of Fig. 52, the superconducting peak turns on slightly above in striking contrast to the pseudogap which behaves very differently in under and overdoped samples (e.g., it opens up well above on the underdoped side, as discussed in Sec. VII). The results obtained at low temperatures ( K) for different doping levels are displayed in Fig. 52c. The peak, not resolved in the very underdoped samples (bottom curve in Fig. 52c), grows with doping.
At the experimental level, the momentum dependence of the peak-dip-hump structure is a more complicated and controversial issue than the doping or temperature dependence. As we will see below, this is mostly a consequence of the superstructure and bilayer splitting effects (Sec. IV.3), which are particularly pronounced in the (,0) region of momentum space.
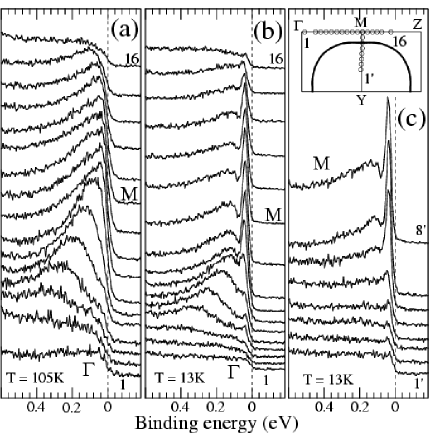
The other reason is that this investigation requires many spectra to be recorded as a function of momentum and temperature, which is technically more challenging especially if one is going after small effects. For instance, Shen et al. (1998) reported 2-5% temperature induced spectral weight transfer with momentum . This was observed in samples with lower , reflecting the presence of impurities, but not in those characterized by the highest ; it was interpreted as a consequence of the stripe formation. It was later found that this effect may more likely be an experimental artifact due to the aging of the sample surface Campuzano et al. (1998); White et al. (1999), as evidenced by ARPES experiments performed on samples containing impurities whose surface was intentionally and systematically aged White et al. (1999).
Fig. 53 presents ARPES spectra from Bi2212 along the high symmetry lines Norman et al. (1997), which suggest that the sharp superconducting peak persists in a very large momentum space region around (,0). However, as later recognized the low-energy peak observed at those -points, at which the hump has dispersed to binding energies larger than 200 meV, stems from the superstructure contamination discussed in Sec. IV.3. The actual experimental phenomenology is that the superconducting peak occurs only in those momentum space regions where the normal state band is within 100-150 meV of , and has a very weak dispersion. This can be seen in Fig. 54, which presents the quasiparticle dispersion reported for different doping levels by Campuzano et al. (1999).
The detection of the peak-dip-hump structure has generated a tremendous amount of interest as it is thought to carry critical information about the superconducting transition.222222See, e.g., Harris et al. (1996); Loeser et al. (1997); Norman et al. (1997); Shen and Schrieffer (1997); Shen et al. (1998); Franz and Millis (1998); Chubukov and Morr (1998); Fedorov et al. (1999); Campuzano et al. (1999); Feng et al. (2000); Ding et al. (2001); Eschrig and Norman (2000); Kaminski et al. (2001). In particular, it gave the main impetus for a phenomenological description of the single-particle excitations in terms of an interaction between quasiparticles and collective modes, which is of fundamental relevance to the nature of superconductivity and of the pairing mechanism in the HTSCs [see, e.g., Eschrig and Norman (2002)]. However, as we will discuss in more detail in Sec. VIII, different interpretative scenarios have been proposed, which are still matter of intense debate.
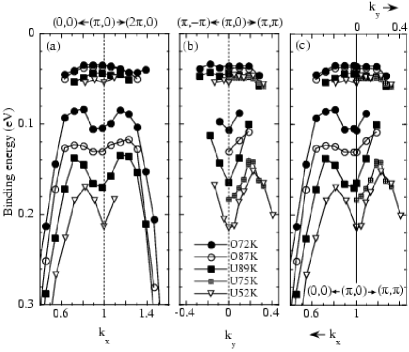
In this regard, it is important to point out that the main constituents of the peak-dip-hump structure have been interpreted also as possible fingerprints of the bilayer splitting of the electronic structure of Bi2212, with peak and hump corresponding to antibonding and bonding bands respectively. As shown in Sec. IV.3.2, this assignment was particularly obvious for both normal and superconducting state data from overdoped Bi2212 (see Fig. 34). For the optimally and underdoped cases it has been suggested that in the normal state, due to the breadth of the lineshapes, the two bands can only be recognized on the basis of the different photon energy dependence (see Fig. 36); in the superconducting state on the other hand (see also Sec. VIII.3.3), bonding and antibonding bands can be resolved directly due to the sharpening and/or spectral weight increase of the peaks Kordyuk et al. (2001); Gromko et al. (2002b). In this context, it should be noted that also the complex lineshape observed in the (,0) spectra from YBCO (Fig. 48) and Bi2223 (Fig. 47) may originate from multilayer splitting effects.
Despite the degree of uncertainty on the lineshape analysis of the peak-dip-hump structure as a whole, and independent of the bilayer splitting effects, the detailed study of the temperature and doping dependence of this feature may still provide very relevant information.

Feng et al. (2000) used a phenomenological fitting procedure to quantify the temperature and doping evolution of the intensity of the lowest energy peak at (,0). In particular, the ratio between the area of the peak and that of the spectrum integrated between -0.5 and 0.1 eV was considered, in the attempt of extracting more systematic information (i.e., independent of artifacts due to -dependence of matrix elements and/or different experimental conditions for the different samples). The doping and temperature dependence of this quantity, referred to as the superconducting peak ratio (SPR), are presented in Fig. 55a and 55d, respectively. From the comparison, in the same figure, with many superfluid-related quantities measured on Bi2212, Y123, and LSCO, Feng et al. (2000) suggested that: (i) the remarkable similarities between the data presented in Fig. 55 hint at a universality in the superconducting properties of the cuprate HTSCs; (ii) ARPES, which probes single-particle excitations of the condensate and therefore directly measures the strength of the pairing (i.e., superconducting gap), may also provide information on the phase coherence of the superconducting state (note that in principle this can only be inferred from those techniques which directly probe the collective motion of the condensate). This latter point is evidenced by the similar behavior observed, as a function of hole concentration, for SPR, superfluid density measured by SR (Fig. 55b), condensation energy from the specific heat and jump in the specific heat coefficient (Fig. 55c), as well as by the similar temperature dependence of SPR and measured by microwave or SR spectroscopy (Fig. 55d and 55e).

Furthermore, contrary to what is expected within the FL-BCS framework Schrieffer (1964), the SPR and superfluid density exhibit an abrupt drop near (i.e., disappearance of the phase coherence) rather than at (i.e., opening of the pseudo-gap in the underdoped regime), and grow with the hole concentration while the gap magnitude, as determined by ARPES (see Sec. VII and Fig. 62), scales with ().
Similar observations were made by Ding et al. (2001), who also found an increase in the peak intensity with doping, as shown in Fig. 56a (here the quantity , referred to by the authors as coherent quasiparticle weight, is defined exactly as the above SPR and is therefore a phenomenological quantity without rigorous theoretical implications). It was observed that the product , where is the superconducting gap estimated by the peak-position at (,0) for K, is directly proportional to the superconducting transition temperature (Fig. 56c). On the basis of these results, Ding et al. (2001) concluded that superconductivity is mainly controlled by the quasiparticle coherence in the underdoped regime and by the superconducting gap in the overdoped regime, and suggested that a new quantity, , may be the true superconducting order parameter in the HTSCs.
The emergence of a sharp quasiparticle peak below has been taken as evidence for some form of coherence transition, which was also the spirit of the phenomenological analyses discussed above. While in the BCS framework Schrieffer (1964) the superconducting transition and the opening of a superconducting gap in the single particle excitation spectrum are due to an effective attractive interaction between FL quasiparticles which are already well-defined above , in the case of the HTSCs coherent quasiparticles may be formed only upon entering the superconducting state [see, e.g., Shen and Sawatzky (1999)]. Theoretical examples of this kind of transition in the literature include, e.g., dimensional crossover Carlson et al. (2000), condensation of chargons Senthil and Fisher (1999), quantum confinement and Bose condensation Nagaosa and Lee (2000). Note however that the above discussed interpretations by Feng et al. (2000) and Ding et al. (2001) are not universally accepted. Notably, Norman et al. (2001b) suggested that the temperature dependence of the ARPES spectra is not due to the decrease of spectral weight of the low-energy peak upon increasing the temperature above , but is instead a reflection of the quasiparticle lifetime catastrophe Kuroda and Varma (1990); Norman and Ding (1998); Norman et al. (2001b); Abanov and Chubukov (1999). The disappearance of the sharp peak above would be a consequence of the reduction of the low-energy electron lifetime, which broadens the quasiparticles out of existence once the superconducting gap has closed.

At this stage, it is hard to judge which interpretation is more appropriate. On the one hand, the analysis by Norman et al. (2001b) is more detailed than the phenomenological one presented in the two experimental papers Feng et al. (2000); Ding et al. (2001). On the other hand, this alternative scenario seems to be in contrast with the experimental observation that, at least in the optimally-doped/overdoped regime (see Fig. 55d where the FWHM is plotted), the width of the superconducting peak does not appear to change significantly across Fedorov et al. (1999); Feng et al. (2000); Ding et al. (2001).
VI.2 Bi2Sr2Ca2Cu3O10+δ and Bi2Sr2CuO6+δ
The temperature dependence seen for the quasiparticle peak in Bi2212 seems to be confirmed also by the data reported for optimally doped Bi2223 (Fig. 47a and 64), in which once again the quasiparticle peak disappears at temperatures slightly larger than K Feng et al. (2002a); Sato et al. (2001d). Furthermore, as shown in Fig. 57 where the superconducting state (,0) ARPES spectra from one, two, and three CuO2 planes Bi-cuprates are presented, it appears that the superconducting peak intensity increases with , supporting the idea that it is related to the strength of superconductivity in the system. In particular, Feng et al. (2002a) showed that both the peak intensity and the superconducting gap increase approximately linearly with in this family of compounds, which seems to indicate that both phase coherence and pairing strength scale with the number of CuO2 planes. In this regard, it has to be mentioned that for Bi2201, presumably due to the lower superfluid density of the single layer compound, only very recently some evidence was collected for the presence of a sharp peak at low temperatures, which indeed is much weaker than in the case of Bi2212 and Bi2223 Lanzara (2002).
VII Pseudogap
One of the most important contributions of ARPES to the investigation of the HTSCs, is the discovery of the normal-state excitation gap or pseudogap Loeser et al. (1996); Marshall et al. (1996); Ding et al. (1996c); Levi (1996). Similar to what we have discussed in Sec. V for the superconducting gap, the pseudogap can be simply described as the opening of an energy gap along the underlying FS, but detected in this case in the normal state.

In fact, for the underdoped cuprates it was found that the Fermi level crossings are absent over a large portion of the FS due to the opening of an excitation gap at temperatures considerably higher than itself. This phenomenon was first recognized in the photoemission spectra by King et al. (1995) in attempting to connect the Bi2212 data to that from undoped SCOC Wells et al. (1995). The pseudogap has been observed in many of the cuprate superconductors, but has been most extensively studied in Bi2212.

As we will discuss in detail later, the main characteristics of the normal-state pseudogap can be summarized as follows Shen et al. (1997); Randeria and Campuzano (1997): (i) the effect is strong in underdoped samples, persists to optimal doping, and disappears in overdoped samples Loeser et al. (1996); Marshall et al. (1996); Ding et al. (1996c). (ii) The gap has two energy scales, with the low energy one given by the location of the leading-edge midpoint (which shows a clear gap), and the higher energy one by the position of the broad peak near the (,0) point (the expected sharp quasiparticle peak at is converted into a broad feature over meV and the low-energy spectral weight is suppressed). The lower energy scale has a -wave like momentum dependence similar to the one of the superconducting gap, with a gapless arc near the nodal region. As a function of doping, the two energy scales track each other Marshall et al. (1996); Norman et al. (1998a); White et al. (1996); Harris et al. (1996); Campuzano et al. (1999). (iii) Upon reducing the hole concentration, the size of the leading-edge pseudogap increases, in contrast to the decreasing of . This is believed to provide an important piece of evidence for the non-BCS behavior of the superconducting transition in the underdoped regime of the HTSCs.
VII.1 Bi2Sr2CaCu2O8+δ
The first specific study of the pseudogap effect in Bi2212 was performed by Marshall et al. (1996). Fig. 58 reproduces the key data that illustrate the basic phenomenology. For the optimally doped or overdoped samples, Fermi crossings around the entire FS are observed (solid squares in Fig. 58a). For the underdoped samples, well defined FS crossings are detected only within an arc-segment centered on the (0,0)-(,) line (open circles in Fig. 58a), while they are completely missing near (,0). By comparing the results from both underdoped and optimally doped Dy-Bi2212 (Fig. 58b), it is clear that the spectra from the underdoped samples pull towards higher binding energy in the entire region, and in particular at (,0). As the FS should be a continuous surface in momentum space, this behavior was interpreted as the opening of an anisotropic gap. It has to be emphasized that the pseudogap phenomenon is relatively insensitive to the details of the FS topology in this region (Sec. IV.3): in fact, the magnitude of the gap is rather large, and the spectra from underdoped samples are pulled back over an extended momentum space region with a weak band dispersion near the (,0) point (see Fig. 58c,d, where the dispersion is summarized for several doping levels). Hence, the normal state gap and its doping dependence are robust features in the ARPES spectra.
Marshall et al. (1996) suggested two different ways of characterizing the normal state pseudogap: by the position of the leading edge (20-30 meV) or by the position of the broad maximum of the spectra (100-200 meV), which identify respectively low-energy and high-energy pseudogap. While the former is well defined at intermediate low-doping levels but not in the deeply underdoped regime, the latter is particularly useful in the very underdoped cases. As we will discuss below, it is generally believed that low and high-energy scale of the normal-state gap naturally connect to the gap of the superconductor and the one of the AF insulator, respectively.

In this regard, of particular relevance are the momentum dependence studies of these features. (i) For the low-energy pseudogap, detailed results were reported by Loeser et al. (1996) and Ding et al. (1996c).

Although the spectra are characterized by a peak not as sharp as the one seen in the superconducting state (Sec. VI.1), the compilation of data presented in Fig. 59 shows that the -dependence of the magnitude of low-energy pseudogap is similar to the one of the -wave superconducting gap (Sec. V.1), which suggests the interesting possibility that the two gaps may originate from the same underlying mechanism. (ii) As for the high-energy pseudogap, it was suggested that this feature exhibits the same dispersion along the (0,0)-(,) and (,)-(,) directions Campuzano et al. (1999). As these orthogonal directions are equivalent only in the reduced AF Brillouin zone, it was argued that the high energy pseudogap is a remnant of the AF undoped insulator [similar point was made by Ronning et al. (1998), following the proposal of Laughlin (1995, 1997)]. However this conclusion rests on the assumption that the dispersion of the high-energy pseudogap is equivalent to the one of the hump detected in the superconducting state (see Sec. VI.1 and, in particular, Fig. 53 and 54). In light of the recent detection of bilayer splitting in Bi2212 (Sec. IV.3), and of the possible correspondence of peak and hump features to antibonding and bonding bilayer split bands, this interpretation of the dispersion of hump and high-energy pseudogap should be reconsidered (then again, as we will discussed in Sec VII.4 and VII.5, a similar behavior has been observed also on single-layer underdoped cuprates).
Important insights also come from the study of the pseudogap as a function of temperature. Fig. 60 summarizes the temperature dependence of the leading-edge midpoint positions near (,0) for underdoped samples with of about 85 K, which shows that at these dopings the pseudogap opens up around K Loeser et al. (1996); Ding et al. (1996c); Harris et al. (1996). More in detail, as reported by Norman et al. (1998a) in a subsequent paper, we are dealing with a highly anisotropic gap that closes non-uniformly in momentum space upon increasing the temperature.

In fact, as shown in Fig. 61, the temperature at which the leading-edge midpoint coincides with the reference Fermi energy obtained from a polycrystalline Pt sample is very different for the Bi2212 spectra taken at -space points (a), (b), and (c). In particular, this happens at about 150 K at (a), and 95 K at (c). Since these results were obtained on a K underdoped sample, they indicate that a gap is present at (a) and (b) already at temperatures well above .
The next important issue is the doping dependence of the normal-state gap magnitude. Fig. 62 compiles data from several studies, which indicate that the pseudogap decreases monotonically upon doping. Here, in order to estimate the normal-state gap energy, both the position of the leading-edge midpoint and of the high-energy feature were used. Concerning the different doping dependence of the experimentally determined pseudogap and lines in the underdoped regime, two alternative scenarios are usually discussed: (i) phase fluctuations and (ii) quantum critical point. The phase fluctuation picture refers to the idea that superconductivity in the underdoped regime is determined by the phase stiffness of the superfluid,232323Doniach and Inui (1990); Uemura et al. (1991); Imada (1993); Emery and Kivelson (1995a, b); Kivelson et al. (1998). which is consistent with the experimental observation that in the underdoped samples is proportional to the superfluid density Uemura et al. (1991).
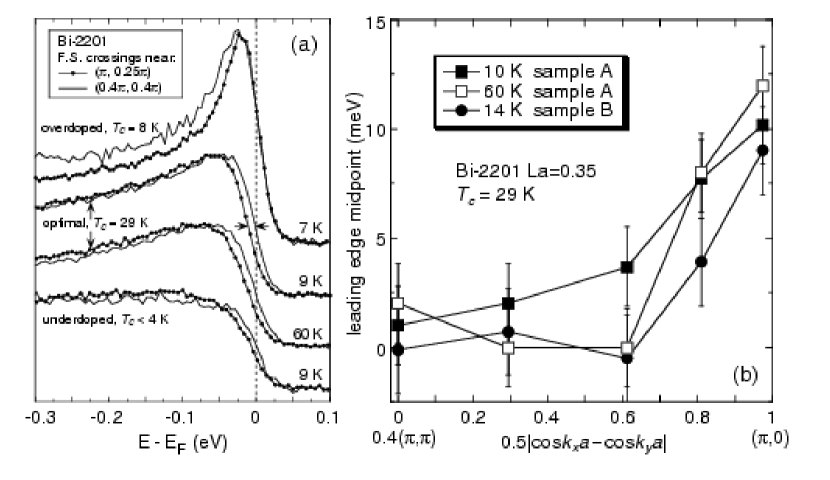
In this view, the pseudogap is a reflection of incoherent pair-fluctuations above ,242424Pre-formation of Cooper pairs at the crossover temperature without any phase coherence, which is established only when they condense into the coherent superconducting state. and does not scale with itself. Given the similarity in the momentum dependence between the pseudogap and the superconducting gap, earlier photoemission data were mostly interpreted along this line. In the case of the quantum critical point scenario, superconducting and normal-state gap have a different origin,252525Tallon et al. (1999, 2000); Tallon and Loram (2001). and the suppression of in the underdoped regime is caused by the development of a competing order responsible for magnetic correlations independent of the Cu spins Sonier et al. (2001). In this context, possible microscopic descriptions for the pseudogap phase include the circulating-current phase Varma (1997, 1999), charge-density wave Castellani et al. (1995), and -density wave short-range fluctuations Chakravarty et al. (2001). It has to be mentioned that, in addition to scenarios (i) and (ii), there is also a class of pairing theories that explain the normal state -wave gap as a signature of pairing in the spin channel. These stem from the spin-density-wave/spin-bag approach,262626Kampf and Schrieffer (1990a, b); Kusko et al. (2002). and from the strong-coupling version of the - or Hubbard models,272727Kotliar and Liu (1988); Suzumura et al. (1988); Tanamoto et al. (1992); Wen and Lee (1996). in which the pseudogap results from AF spin fluctuations and spinon pairing respectively. Finally, there is the interpretation of the pseudogap in terms of umklapp scattering truncation of the FS near the location of the hot spots, as in Fig. 15b.282828Furukawa et al. (1998); Furukawa and Rice (1998).
VII.2 Bi2Sr2CuO6+δ
Clear evidence for a -wave like pseudogap for underdoped and optimally doped Bi2201 was reported by Harris et al. (1997), as shown in Fig. 63 (note that no gap was observed for the overdoped material). On the basis of the leading-edge midpoint shift, the gap amplitude was estimated to be meV for the optimally doped sample, therefore much smaller than in Bi2212 (-30 meV, see Fig. 62). As discussed for the case of Bi2212 (Sec. VII.1), the momentum dependence and magnitude of the normal state pseudogap are similar to those of the superconducting gap, which may imply a common origin for the two features. Furthermore, as we will see in Sec. VII.4, the magnitude of the pseudogap in Bi2201, in particular as estimated from the position of the leading-edge midpoint, is comparable to the results obtained for LSCO. Given that Bi2201 and LSCO are characterized by a similar value of 34-38 K much lower than the K of Bi2212 [see, e.g., Eisaki et al. (2002)], these findings suggest a direct correlation between and the size of the pseudogap (and/or superconducting gap), for the different families of cuprates.
VII.3 Bi2Sr2Ca2Cu3O10+δ
The pseudogap in Bi2223 has been recently studied by Sato et al. (2001d) and Feng et al. (2002a), on nearly optimally doped samples ( K). The (,0) ARPES spectra and the results obtained by symmetrizing the spectra with respect to [as defined by Norman et al. (1998b)] are presented as a function of temperature in Fig. 64a,b. At low temperature, a large superconducting gap is clearly visible, as discussed in Sec. V.3.
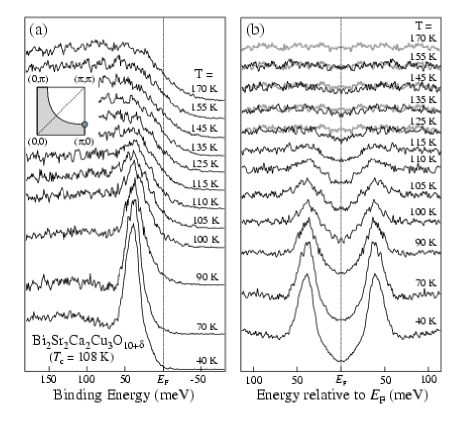
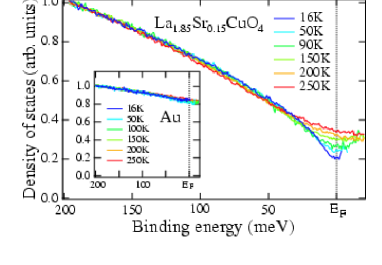
However, as emphasized by the direct comparison between the 170 K symmetrized spectrum an those taken at K (Fig. 64b), the gap is still open at and it does not close until K (as evidenced by the suppression of the low-energy spectral weight). Note that the absolute difference between and is rather small in this case, presumably because the doping level is very close to optimal. Similar results were reported by Feng et al. (2002a), who showed that a gap is present at spectra taken above near (,0) but not along the nodal direction, which suggests a -wave symmetry for the pseudogap in Bi2223.
VII.4 La2-xSrxCuO4
The investigation of the normal state pseudogap in LSCO by ARPES has been complicated by the poor stability of the cleaved surface at temperature higher than , even in ultra-high vacuum. Therefore, the first evidence for this phenomenon in LSCO was reported by Ino et al. (1998) on the basis of angle-integrated photoemission experiments, in which clean surfaces were obtained by repeatedly scraping (i.e., every 40 minutes) the sample surface in situ with a diamond file (a procedure which obviously prevents the acquisition of angle resolved spectra, due to the roughness of the scraped surface). These data indicated a systematic depression of the density of states (more pronounced at lower dopings), which has been considered indicative of a pseudogap with an energy scale of about 100-200 meV at 5-10% doping.
Using a similar procedure, Sato et al. (1999) investigated the temperature dependence of the pseudogap in optimally doped LSCO (, K). In order to extract a more direct representation of the density of states near the Fermi level, the spectra were divided by the Fermi-Dirac distribution function (at the corresponding temperature) convoluted with a Gaussian (to account for the instrumental resolution of 7 meV).

In contrast to what is observed in a normal metal like Au (inset of Fig. 65), on LSCO the intensity close to the Fermi level ( meV) increases smoothly upon raising the temperature (Fig. 65). This effect is observable over a temperature range much larger than , and thus provides direct evidence for the existence of normal state pseudogap.
Detailed angle-resolved investigations of the pseudogap in LSCO were recently reported by Ino et al. (2002) and Yoshida (2001). As shown in Fig. 66a where the shift of the leading-edge midpoint along the underlying FS is presented for 10% doped LSCO, a clear gap is observable close to (,0) but not at (/2,/2), with an overall momentum dependence consistent with the -wave functional form (Fig. 66b). Note that the spectra presented in Fig. 66 were taken at the temperature of 30 K, therefore not much higher than K. This was necessary in order to avoid aging of the sample surface over the time required to obtain a complete set of data in momentum space. It has to be emphasized that, however, temperature dependent ARPES experiments restricted to the (,0) region show that the gap is still open at temperatures as high as 90 K and therefore well into the normal state, consistent with the results presented in Fig. 65. Regarding the absolute magnitude of the pseudogap and its doping evolution, detailed estimates could also be obtained from angle-resolved experiments (Fig. 67a). The results for the high-energy pseudogap at (,0) and the low-energy pseudogap at the underlying Fermi vector near (,0) are presented in Fig. 67b and c, respectively. Similar to the case of the Bi-based HTSCs, these findings support the picture of a smooth evolution of the pseudogap into the superconducting gap upon increasing the doping. Furthermore, as mentioned in Sec. VII.2, the results from these two different families indicate a direct scaling of the leading-edge pseudogap with .
It has been observed that the doping dependence of the high energy pseudogap (Fig. 67b) indicates that this effect is intimately related to the anomalous behavior seen in thermodynamics and transport properties. In particular, for along with the opening of the pseudogap one observes a suppression of the electronic specific heat and a decrease of the effective mass Ino et al. (1998, 2002).
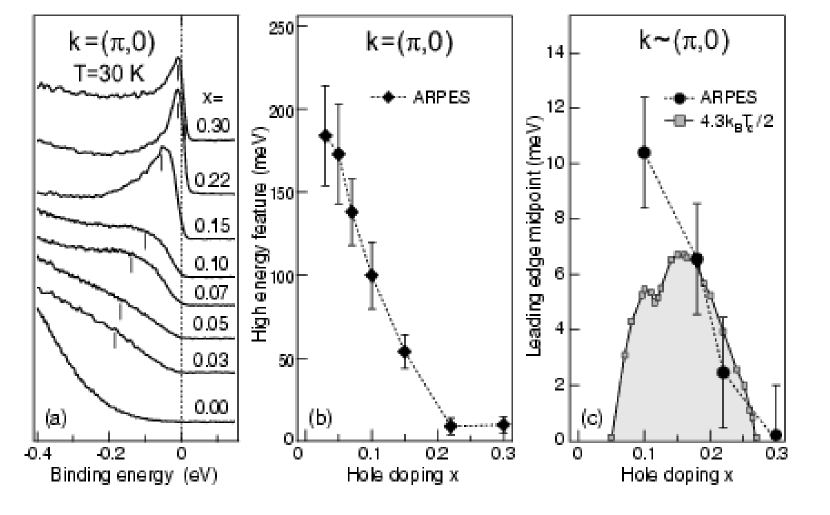
This suggests that a decrease in the density of states (or carriers) is responsible for the metal-insulator transition in LSCO, and not a divergence of the effective mass Imada et al. (1998). This may also be related to the fact that the coherent quasiparticle weight decreases upon reducing the doping level (Fig. 67a).
VII.5 Ca2-xNaxCuO2Cl2
Many attempts have been made to connect the electronic structure of the doped HTSC to that of the insulator. This is also the case in the context of the pseudogap discussion, as many believe that the pseudogap is a quantity that can already be defined in the insulator. Since the best insulator data were collected on SCOC and CCOC, and the best metal data were obtained on Bi2212, it is natural that the possibility of such a connection has been most intensively explored for these two families of materials.
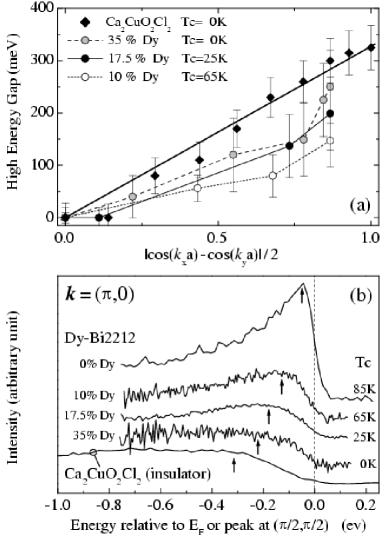
The first explicit attempt in this direction was made by Laughlin (1995) who showed that the (,0) ARPES spectra evolve continuously from one system to another, making a strong case for the high-energy broad peak being derived from the insulator. The idea of remnant FS discussed in Sec. IV.1.2 was inspired by this approach, which suggested to consider the evolution of the (,0) spectra in terms of a gap evolution rather than a trivial band dispersion even in the insulator.
The (,0) spectra from Bi2212, Dy-Bi2212, and CCOC are compared in Fig. 68b Ronning et al. (1998), which shows a smooth evolution of lineshapes and peak positions (see arrows): upon underdoping the quasiparticle peak at (,0) broadens and shifts to higher binding energies. Note that for CCOC the zero in energy does not correspond to but to the peak position at (/2,/2) which, in turn, corresponds to the top of the valence band located meV below because of the Mott gap. The high-energy pseudogap (Fig. 68b) is characterized by a -wave like dispersion not only in the underdoped systems but also in the undoped insulator. This is shown in Fig. 68a where the dispersion of the high energy pseudogap along the FS (remnant-FS for CCOC) is plotted against the -wave functional form (a fit for CCOC is shown). Although their sizes vary, the superconducting gap, the pseudogap of the underdoped system, and the gap of the insulator have a similar -wave form, suggesting a common origin Zacher et al. (2000b). This is consistent with the idea of one underlying symmetry principle that unifies the AF insulator and the -wave superconductor Zhang (1997); Zacher et al. (2000b).
Recently, single crystals of Na-doped CCOC have been made available (as discussed earlier in Sec. IV.1), which allowed the study of the doping evolution from insulator to superconductor within the same material family Kohsaka et al. (2001); Ronning et al. (2002b). The (,0) spectra from 10% doped Na-CCOC (Fig. 20a) and CCOC (Fig. 68b) exhibit the same lineshape, although the insulator data are shifted below by meV Ronning et al. (2002b). Furthermore, as shown in Fig. 21b, the 10% Na-doped sample is characterized by a Fermi arc centered around the nodal region, while around (,0) the spectra are pushed to much higher energies. This behavior is almost identical to the one seen for underdoped Bi2212 in Fig. 58, which supports the earlier conclusions based on the comparison between CCOC and Bi2212 at various dopings. Hence, these findings make a strong case for the high-energy pseudogap to have its origin in the electronic structure of the insulator. In addition, regarding possible complications due to bilayer splitting effects in the (,0) data from Bi2212, it has to be emphasized that the similar behavior observed for single-layer Na-CCOC and bilayer Bi2212 provides further support for the presence of two energy scales in the pseudogap phenomenon and for their observed doping evolution.
VII.6 Discussion
The results from Bi2201, Bi2212, and LSCO, with the presence of two-energy scales for both single and double layer materials, indicate the generality of the pseudogap phenomenology. The low energy pseudogap smoothly evolves into the superconducting gap upon going from underdoped to overdoped regime. Both gaps exhibit the same overall -wave symmetry. Furthermore, the magnitude of the leading-edge pseudogap scales with the maximum of the different HTSC families. The high-energy pseudogap, which allows a more meaningful description of the data in the very underdoped regime, seems to originate from the AF insulator, as first proposed on the basis of CCOC and Bi2212 data. In this regard, more direct evidence is provided by the results from Na-CCOC. In particular, we have discussed that the similar -wave form observed for the superconducting gap, the pseudogap of the underdoped system, and the angular dependent part of the gap along the remnant FS of the insulator might suggest a common origin for these different excitation gaps Zacher et al. (2000b), and the existence of a unifying symmetry principle for the AF insulator and the -wave superconductor Zhang (1997); Zacher et al. (2000b). In this regard however, as discussed in detail by Ronning et al. (2002a), an important caveat is the rounded electronic dispersion observed near the nodes of the -wave functional form for both the superconducting and normal state gap. This finding, which is also consistent with the observations of Fermi arcs rather than a uniformly gapped FS in the pseudogap regime (Fig. 21, 58, and 61), suggests that high order harmonics may have to be included in the expansion of the gap function Mesot et al. (1999); Guinea et al. (2002), as already discussed in Sec. V.1 and V.7. This would in fact account for the lack of a well defined “V”-like cusp in the gap momentum dependence in the nodal region. The presence or absence thereof is a critical information in discriminating between different microscopic models connecting the AF insulator to the -wave superconductor.
It has to be noted that the detection of a -wave like pseudogap and, in particular, the increase of its maximum amplitude at (,0) upon reducing doping emphasize the inadequacy of a rigid band description for the electronic structure of the HTSCs King et al. (1995). In other words, the evolution from insulator to overdoped metal cannot be described in terms of the simple shift of the chemical potential in a rigid band picture. In fact, in the insulator the binding energies of the lowest energy states at (/2,/2) and (,0) differ by meV as shown in Fig. 19, while in the overdoped metal a Fermi level crossing can be found near both momenta [the rigid chemical potential shift would instead results in FS pockets closed around (/2,/2)].
VIII Self energy and collective modes
As discussed in Sec. II.3, the introduction of the electron self energy is a powerful way to account for many-body correlations in solids. Its real and imaginary parts correspond, respectively, to the energy renormalization with respect to the bare band energy and to the finite lifetime of the quasiparticles in the interacting system. Owing to the energy and momentum resolution nowadays achievable (Sec. II.5), both components of the self energy can be in principle estimated very accurately from the analysis of the ARPES intensity in terms of energy distribution curves (EDCs) and/or momentum distribution curves (MDCs).292929This is one of the aspects that make ARPES such a powerful tool for the investigation of complex materials, as exemplified by the recently reported experimental determinations of many-body effects in different systems. For a review, see: Johnson et al. (2001a); Kevan and Rotenberg (2001); Gweon et al. (2001). In this regard, it is important to realize that in some cases the MDC analysis may be more effective than the analysis of the EDCs in extracting information on the self energy, as noted by Valla et al. (1999b) who first used this approach for Bi2212 (see Fig. 7 and 74). EDCs are typically characterized by a complex lineshape (Fig. 7) because of the nontrivial dependence of the self energy (see, e.g., Eq. 17 and 18), the presence of additional background (Sec. II.4), and the low-energy cutoff due to the Fermi function. Furthermore, as evidenced by the generic expression for the spectral function in Eq. 14, the EDC peak position is determined by as well as , because both terms are strongly energy dependent. On the other hand, if the self energy is independent of normal to the FS (and the matrix elements are a slowly-varying function of ), then the corresponding MDCs are simple Lorentzians centered at with FWHM given by , where is the bare Fermi velocity normal to the FS.303030This is obtained by simply approximating in the spectral function in Eq. 14 Kaminski et al. (2001). Indeed, Lorentzian lineshapes were observed experimentally for the MDCs (Fig. 7 and 74), and this approach has been extensively used in the literature as we will see throughout this section. However, it has to be noted that, although the results of MDC and EDC analyses should coincide, differences in both dispersions and peak widths can be observed, in particular at high energies due to the dependence of , or near the band maxima and minima (see, e.g., the simulations in Fig. 72).
As we will elaborate in Sec. VIII.2 and VIII.3, the peak-dip-hump structure and the corresponding step-edge in observed for the cuprates are crucial hallmarks for quasiparticles interacting with a dispersionless collective bosonic mode. This problem has been studied in great detail for the strong-coupling BCS superconductors, in which the bosonic mode is an Einstein phonon Engelsberg and Schrieffer (1963); Schrieffer (1964); Scalapino (1969). Therefore, before discussing the specific case of the cuprate HTSCs, in the following section we will briefly review the effects of electron-phonon coupling on the ARPES spectra from simple metallic surfaces for which, given that the electron-electron interaction is relatively unimportant, the established theoretical formalism can be applied very effectively.313131Balasubramanian et al. (1998); Hofmann et al. (1998); Hengsberger et al. (1999b, a); Valla et al. (1999b); LaShell et al. (2000); Rotenberg et al. (2000).
VIII.1 Electron-phonon coupling on metallic surfaces
The electron-phonon interaction involving surface phonons and the -surface state on the Be(0001) surface was investigated by two groups, and qualitatively similar conclusion were drawn Balasubramanian et al. (1998); Hengsberger et al. (1999b, a); LaShell et al. (2000). Fig. 69a shows results by Hengsberger et al. (1999b) for the Be(0001) surface state along the direction of the surface Brillouin zone; a feature is seen dispersing towards the Fermi level. Close to the spectral function exhibits a complex structure characterized by a broad hump and a sharp peak, with the latter being confined to within an energy range given by the typical bandwidth of the surface phonons.
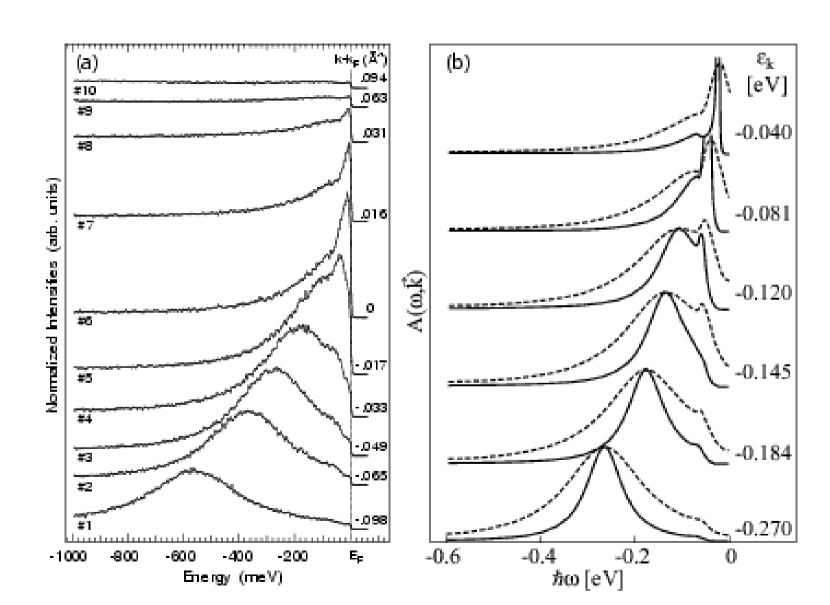
This behavior corresponds to a two-branch splitting of the near- dispersion, with a transfer of spectral weight between the two branches as a function of binding energy (this is more clearly emphasized by the simulation shown in Fig. 69b). While the high-energy dispersion is representative of the bare quasiparticles, at low energy the dispersion is renormalized by the electron-phonon interaction (this behavior is shown, for a similar electron-phonon coupled system, in the inset of Fig. 70). In other words, the weaker dispersion observed at energies smaller than describes dressed quasiparticles with an effective mass enhanced by a factor of , where is the electron-phonon coupling parameter Ashcroft and Mermin (1976). The latter can be estimated from the ratio of renormalized () and bare () quasiparticle velocities, according to the relation . This way, for the data presented in Fig. 69a the value was obtained [note that alternatively could also be estimated from the temperature dependence of the linewidth near Balasubramanian et al. (1998)]. In a follow up paper, Hengsberger et al. (1999b) provided a more detailed analysis of the data, by including also the effect of impurities and electron-electron interactions, which however led to similar conclusions.
A slightly different analysis of similar data from Be(0001) was performed by LaShell et al. (2000). In this case, the authors used the isotropic zero temperature Debye model with a constant electron-phonon interaction matrix element to express the Eliashberg coupling function (i.e., the phonon density of states weighted by the electron-phonon coupling strength) as , for , and otherwise zero (here is the maximum phonon energy and the dimensionless mass renormalization parameter represents the coupling strength).

Within the above approximation the electron-phonon contribution to the self energy , if effectively treated as momentum independent, can be calculated from . For real () and imaginary () parts one obtains: The spectral function for this model is shown in Fig. 69b for parameter values and meV; it qualitatively reproduces the basic features of the ARPES spectra presented in Fig 69a, and in particular the double structure with a dip at approximately . By assuming the self energy to be independent of (or weakly dependent on) momentum, a fact that is qualitatively consistent with the Lorentzian lineshape of the MDCs (see previous section), LaShell et al. (2000) extracted the self energy using only the free parameter , which they took as a second-order polynomial imposing the additional condition that must vanish at and . These results are in good agreement with theoretical simulations based on the Debye model.
Another example of an electron-phonon coupled system is the surface state of Mo(110) studied by Valla et al. (1999a). In this case, the real and imaginary part of the self energy shown in Fig. 70 were obtained directly from the EDC analysis: corresponds to the EDC width and to the difference between the observed quasiparticle dispersion and a straight line approximating the dispersion of the non-interacting system (Fig. 70, inset). The step-like change at 30 meV in is interpreted as the phonon contribution (dashed line) and the parabolic part at higher energies is attributed to electron-electron interactions. The phonon contribution to the real part of the self energy is calculated from the Kramers-Kronig relations (see Sec. II.3) and agrees well with the data (dotted line). As an additional confirmation of the electron-phonon description, it was noted that also the observed temperature dependence of the scattering rate is well reproduced by the calculations Valla et al. (1999a). The difference between the Mo(110) results and those from Be(0001), or the simulations presented in Fig. 69b, is that no double structure is seen directly in the EDCs for the Mo(110) surface state, although one should expect it for the parameters extracted from the experiment. The reason for this discrepancy probably lies in the energy scale of the Debye frequency, which is about 30 and 65 meV for Mo and Be, respectively. For meV the complex lineshape is probably smeared out because of impurities or finite resolution.
A similar manifestation of two-branch splitting in the ARPES spectra as a consequence of electron-phonon coupling was observed for hydrogen and deuterium adsorbed onto the W(110) surface Rotenberg et al. (2000). In this case, the direct coupling between an adsorbate optical phonon and an intrinsic surface electronic state was evidenced by the hydrogen/deuterium isotope effect.
VIII.2 Self-energy effects in the HTSCs
VIII.2.1 The (,0) region
Earlier ARPES investigation of the self-energy corrections in the cuprates focused on the antinodal (,0) region of Bi2212, where across the lineshape evolves into the well-known peak-dip-hump structure already discussed in Sec. VI.1. However, as recently recognized and elaborated in detail in Sec. IV.3.2, the (,0) spectra from Bi2212 are severely distorted by the bilayer splitting effects.323232Feng et al. (2001); Feng et al. (2002b); Chuang et al. (2001a, b); Kordyuk et al. (2001); Gromko et al. (2002b); Borisenko et al. (2002). In particular, the results reported by Kordyuk et al. (2001) and Gromko et al. (2002b) most convincingly suggested that the peak and hump observed in the superconducting state correspond to antibonding and bonding bilayer split bands, at any doping levels (i.e., even at under and optimal doping). This invalidates much of the quantitative lineshape analysis of data from this momentum-space region.
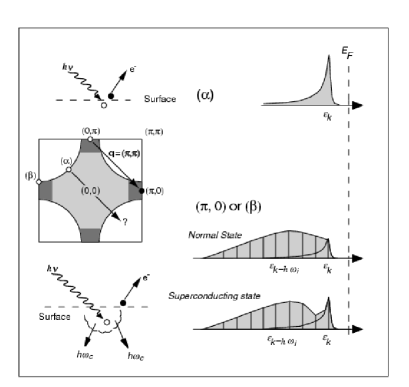
However, as the methodology is still very instructive, in the following we will nevertheless review the literature devoted to this issue.
As for the detailed understanding of the peak-dip-hump structure seen at (,0) in the superconducting state, there are two distinct aspects of this effort:
(i) The development of a way to extract self-energy information directly from the ARPES data. The upshot of this approach is that one does not need input from any microscopic model, thus it may in principle allow one to analyze the data with no preconceived judgment. The price to pay is that certain approximations are necessary and, as a consequence, one has to be cautious in the quantitative evaluation of the final results.333333Norman et al. (1997); Norman and Ding (1998); Norman et al. (1998b); Norman (2001); Norman et al. (1999).
(ii) The analysis of the photoemission data within the context of a specific microscopic model.343434Norman et al. (1997); Norman (2001); Shen and Schrieffer (1997); Norman and Ding (1998); Campuzano et al. (1999); Abanov and Chubukov (1999); Eschrig and Norman (2000, 2002). Within this approach, in analogy to the case of the electron-phonon coupled systems discussed in Sec. VIII.1, the peak-dip-hump structure would result from the coupling between the quasiparticles and a collective bosonic mode. In this case the latter is assumed to be electronic in nature and, in particular, the so-called ,) resonant magnetic mode observed in inelastic neutron scattering experiments in YBCO Rossat-Mignod et al. (1991); Mook et al. (1993); Fong et al. (1995) and Bi2212 Mook et al. (1998); Fong et al. (1999). Related to this scenario is the approach schematically summarized in Fig. 71, which emphasizes that the scattering will severely affect the (,0) spectra (i.e., broadening due to the simultaneous excitation of collective modes). As a consequence of the sharpening of the quasiparticle pole in the superconducting state, a sharp peak would eventually emerge below , as observed in the experiments.
It should be noted that the connection between the (,0) peak-dip-hump structure and a sharp electronic resonant mode in the cuprates was first proposed by Norman et al. (1997), following earlier work on electron-phonon coupling Engelsberg and Schrieffer (1963); Scalapino (1969). Fig. 72 reproduces the calculations performed at two different momenta in the superconducting state for electrons coupled to a collective mode of energy as well as a gapped continuum, which account for the complete spin excitation spectrum Eschrig and Norman (2002).

As a result of the interaction, the spectral function is characterized by a peak-dip-hump-like lineshape as well as a break and two-branch behavior (i.e., for peak and hump) in the EDC-derived quasiparticle dispersion [the energy of dip and dispersion kink is comparable to the one of the (,0) superconducting state peak plus ]. This behavior is particularly evident in the (,0) region (Fig. 72a-b), but similar although weaker effects can also be seen along the nodal direction (Fig. 72c-d). An obvious difference between the two momentum space regions in Fig. 72 comes from the presence of the -wave superconducting gap: while the quasiparticle peak crosses with a linear dispersion along (0,0)-(,), it disperses backward losing spectral weight for around (,0), where the gap along the FS is maximum. In Fig. 72 it should also be noted that the two-branch behavior seen in the EDCs corresponds to a kink in the MDC-derived quasiparticle dispersion, which emphasizes the crossover between high and low-energy branches.
The agreement between the above calculations and ARPES data such as those presented in Fig. 53, 54, and 76 was taken as evidence for the validity of the approach. Furthermore, as mentioned above, according to the magnetic-mode scenario the energy separation between peak and dip in the ARPES spectra (Fig. 73a) should correspond to the energy of the mode itself Campuzano et al. (1999).
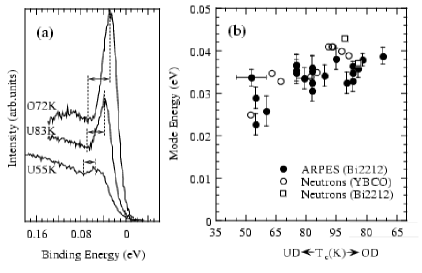
Indeed, some correlation between these characteristic energies was experimentally observed over a broad doping range, as shown in Fig. 73b where ARPES and inelastic neutron scattering data are compared. Campuzano et al. (1999) argued that these results, which have also been confirmed by more recent photoemission and neutron data reported for the very same sample by Mesot et al. (2001a), provide direct evidence for the bosonic mode being the (,) resonant magnetic mode. However, in light of the recent detection of bilayer splitting effects that dominate the (,0) spectra (with an energy scale coinciding with that of peak and hump), also this quantitative comparison of neutrons and Bi2212 ARPES data needs to be carefully reevaluated [see, e.g., Eschrig and Norman (2002)].
VIII.2.2 The nodal direction
As the data from Bi2212 along the (0,0)-(,) direction are not complicated by superstructure contaminations (at least along , as shown in Fig. 28 and 30a,b) or bilayer splitting effects (see Fig. 31 and 32), in principle the quasiparticle lineshape analysis in this region of momentum space is more reliable. In this context, detailed ARPES studies of the single-particle self energy have been very recently reported by several groups.353535Valla et al. (1999b); Valla et al. (2000); Bogdanov et al. (2000); Kaminski et al. (2001); Lanzara et al. (2001); Yusof et al. (2002); Kaminski et al. (2000); Johnson et al. (2001b). Interestingly, from a temperature dependence study on optimally doped Bi2212 ( K ARPES data are shown in Fig. 7), Valla et al. (1999b) reported that the width of the Lorentzian-like MDCs at decreases linearly as a function of temperature (Fig. 74), similar to what is observed for the scattering rate in normal state resistivity data and consistent with the marginal Fermi liquid (MFL) description [Varma et al. (1989); see Sec. II.3].
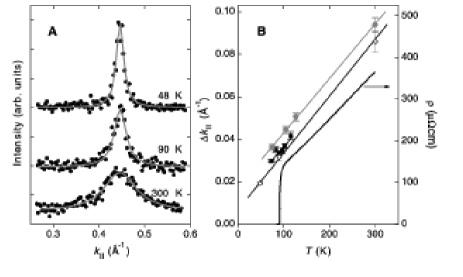
Furthermore, this behavior seemed to smoothly persist into the superconducting state in contrast to what is seen by transport and optical measurements. The linear dependence of the scattering rate on temperature (at small binding energies) and on energy (at large binding energies), with no indications for an extraneous energy scale set by conventional sources of quasiparticle scattering, was considered by Valla et al. (1999b) a signature of a nearby quantum critical point.363636See for example: Chakravarty et al. (1989); Varma et al. (1989); Varma (1997); Littlewood and Varma (1991); Sachdev and Ye (1992); Sokol and Pines (1993); Emery and Kivelson (1993b); Castellani et al. (1995); Chakravarty et al. (2001).
However, evidences for an additional energy scale in the quasiparticle self energy, at least below , were later reported by two other groups Kaminski et al. (2000); Bogdanov et al. (2000); Lanzara et al. (2001). Kaminski et al. (2000) observed a clear drop in the low-energy scattering rate in particular below , as estimated from the width of the EDCs measured along the nodal direction on optimally doped Bi2212. This behavior is shown in Fig. 75 where the scattering rate obtained from ARPES and optical experiments are compared for two different temperatures above and below . In addition, from the analysis of both EDCs and MDCs taken on Bi2212 for several dopings along the (0,0)-(,) direction, Bogdanov et al. (2000) found a kink at approximately meV in the quasiparticle dispersion (see Fig. 78 which shows, in addition to the Bi2212 results, similar data reported by Lanzara et al. (2001) for a wide range of HTSCs). This is counter to the linear dispersion predicted by band-structure calculations in this energy range Massidda et al. (1988); Krakauer and Pickett (1988). The kink appeared to be more pronounced at low temperatures and in underdoped samples; below , a drop in the EDC-derived quasiparticle scattering rate was observed at the kink energy, similar to that shown in Fig. 75.
It should be noted that a kink in the dispersion is also present in the superconducting state results by Valla et al. (1999b), although this aspect of the data was not considered by those authors (see white circles in Fig. 7).

However, as real and imaginary part of the self energy are related by Kramers-Kronig relations, the presence of a dispersion renormalization below a certain binding energy corresponds necessarily to a well defined structure in the quasiparticle scattering rate, contrary to the initial claim of the linear temperature dependence of the scattering rate and absence of any energy scale [as later recognized by those same authors Johnson et al. (2001b)].
VIII.3 Origin of the energy scale in the HTSCs
While there has been an initial disagreement with one group arguing for the absence of any energy scale at all temperatures Valla et al. (1999b), the field eventually converged to the conclusion that the kink in the dispersion and the change in the EDC width observed along the nodal direction indicate the presence of a well defined energy scale in the electron self energy for Bi2212, at least in the superconducting state.
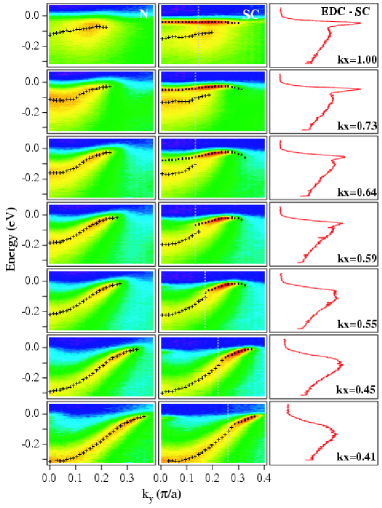
Furthermore, the coupling between the quasiparticles and some collective mode is considered to be the most likely origin of this phenomenon Bogdanov et al. (2000); Kaminski et al. (2000, 2001); Lanzara et al. (2001); Johnson et al. (2001b). In fact, other possible causes, such as the opening of the superconducting gap, have been ruled out as will be elaborated later. However, there is currently no consensus on whether or not these effects are limited to temperatures lower than and, in turn, on the precise nature of the collective mode. As for the latter, in addition to the (,) resonant magnetic-mode scenario already discussed in relation to the self-energy effects in the (,0) region, also lattice vibrations have been proposed as a possible candidate. A direct comparison of these two competing scenarios will be presented in the following.
VIII.3.1 Resonant magnetic-mode scenario
In the context of a coupling between quasiparticles and a mode, the strongest effects on the self energy are expected around (,0), as emphasized in the inset of Fig. 71. In addition, as already discussed in relation to Fig. 72, Kaminski et al. (2001) argued that the coupling between quasiparticles and spin fluctuations could also be responsible for the drop in the scattering rate and the dispersion renormalization observed in the superconducting state of Bi2212 along the (0,0)-(,0) direction (Fig 75 and 76 for ).
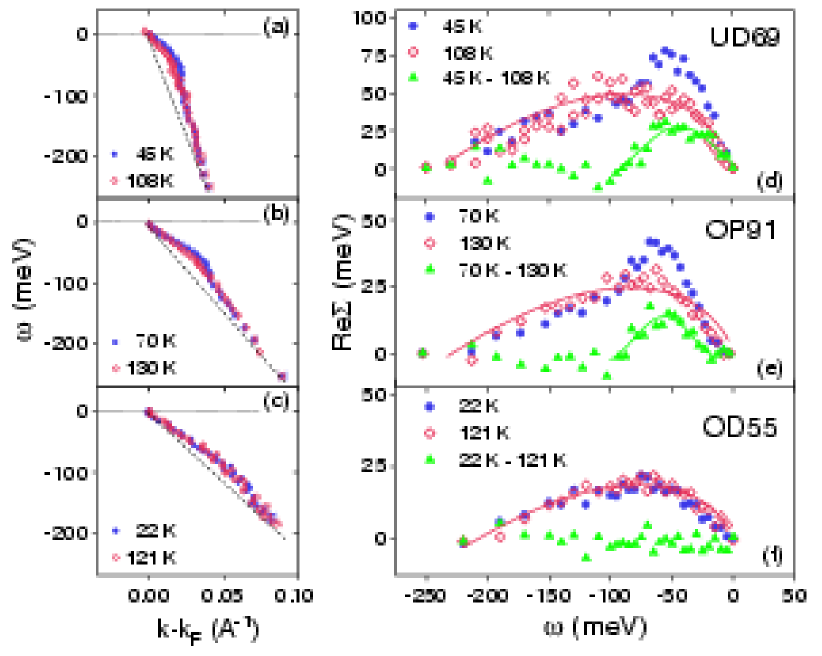
Within this approach Kaminski et al. (2001); Eschrig and Norman (2000, 2002) a unified view is given for the peak-dip-hump structure and two-branch behavior detected in the (,0) region (Fig 76, top panels), and the quasiparticle renormalization observed along the nodal direction (Fig 76, bottom panels). However, as already discussed in Sec. VIII.2.1, an important caveat is that the effects identified as due to self-energy corrections in the (,0) region could mostly be a direct manifestation of bonding and antibonding bilayer split bands.
Similar results and conclusions were later reported by Johnson et al. (2001b), who investigated the self-energy corrections along the nodal direction of Bi2212 for different doping levels, above and below . Fig. 77 shows the MDC-derived quasiparticle dispersion and an approximate estimate of the real part of the self energy. This was obtained from the difference between the MDC-derived dispersion and the dashed straight lines that in Fig. 77a-c intersect the dispersion at and at 200-250 meV, where is then set to zero (strictly speaking, however, the true noninteracting dispersion should be used as a reference, which would not cross the interacting one). Although these results are not characterized by a strong temperature dependence (i.e., the main deviation from the dashed lines in Fig. 77a-c is already present in the normal state), Johnson et al. (2001b) argued that, while the normal state dispersion shows only a smooth MFL-like renormalization (as defined in Sec. II.3), in the superconducting state the self energy is characterized by the emergence of a sharp structure for under and optimal doping. On the basis of this temperature and doping dependence, Johnson et al. (2001b) attributed the self-energy change across (green symbols in Fig. 77) to the magnetic-mode contribution. Interestingly, it was also noted that for meV the band velocity decreases with doping and that in the underdoped regime both EDCs and MDCs widths are larger than the corresponding binding energy. These results were discussed by Johnson et al. (2001b) as indicative of electron (hole) fractionalization, following an earlier work by Orgad et al. (2001).
VIII.3.2 Electron-phonon coupling scenario
Alternative to the magnetic-mode scenario discussed in the previous section, Lanzara et al. (2001) and Shen et al. (2001b) argued that the self-energy effects in the ARPES data from Bi2212 along the nodal direction can be best described in terms of electron-phonon coupling. This interpretation is based on the following observations. First, the kink in the quasiparticle dispersion as well as the drop in the scattering rate are seen in all the -type cuprates studied and the behavior is almost identical. This is shown in Fig 78a-c that present the dispersion along (0,0)-(,) for LSCO, Bi2212, and Bi2201. In all cases one can observe a clear change in band velocity, which becomes more pronounced in the underdoped samples.373737For the -type cuprates no detailed study is available; at this stage, as shown in Fig. 42, no effect is detected on NCCO along the nodal direction Sato et al. (2001b); Shen et al. (2001b), while a break in the dispersion at about 50 meV was observed along the (,0)-(,) direction Sato et al. (2001b). Note that the observation of a similar energy scale (50-80 meV) in systems characterized by very different gap energies (10-20 meV for LSCO and Bi2201, 30-50 meV for Bi2212) rules out the superconducting gap as a possible origin. Furthermore, this finding was taken by Lanzara et al. (2001) also as a strong evidence against the magnetic-mode interpretation and in favor of the phonon scenario. In fact, while the kink in the dispersion appears to be similar in the different families of compounds, the magnetic resonant mode behaves very differently: the latter is not seen in LSCO, and is expected to have an energy three times lower in Bi2201 as compared to Bi2212 or YBCO, because its characteristic energy scales approximately with .

On the contrary, the similar energy scale observed for the different compounds is consistent with the coupling between quasiparticles and oxygen phonons: as evidenced by neutron scattering experiments McQueeney et al. (1999); Petrov et al. (2000), these lattice vibrational modes are strongly coupled to the charge carriers and their characteristic frequencies fall in the same energy range of the kink observed in the quasiparticle dispersion (black arrows in Fig 78b-e). For instance, for LSCO the (,0) oxygen stretching mode has an energy of 70 meV as indicated by the red arrow in Fig 78a McQueeney et al. (1999), and coincides with the energy of the kink detected by ARPES.
A second important piece of evidence in favor of the phonon scenario comes from the temperature dependence of the kink in the quasiparticle dispersion. The data in Fig 78d-e indicate that the effect smoothly evolves upon raising the temperature and persists well above . This is particulary obvious in the 100 K data from LSCO, for which K. The inset in panel (e) presents the real part of the self energy for optimally doped Bi2212 extracted with the same procedure used by Johnson et al. (2001b) for the data presented in Fig. 77. The results from the two groups are very similar except for a subtle difference: while both data sets show a slightly more pronounced structure at low-temperature, the superconducting state data by Johnson et al. (2001b) hint at a sharp peak superimposed on the normal state result (Fig. 77), which could be taken as evidence for a qualitatively different effect below and above . On the other hand, the data by Lanzara et al. (2001) show a more continuous evolution, with a persistence of the effect into the normal state. Therefore the temperature dependence of the ARPES data from Bi2212 and especially LSCO was taken by Lanzara et al. (2001) as a direct and conclusive evidence against the magnetic-mode interpretation because the latter, as indicated by elastic neutron scattering experiments, turns on below Dai et al. (1996, 1999); Fong et al. (1999); He et al. (2001).
Fig. 79 directly compares the low-temperature ARPES spectra taken with 55 eV photons on overdoped (OD), optimally doped (OP) and underdoped (UD) Bi2212. It should be emphasized that these data were recorded along the nodal direction, where the two bilayer split bands are degenerate in energy (Sec. IV.3.2).
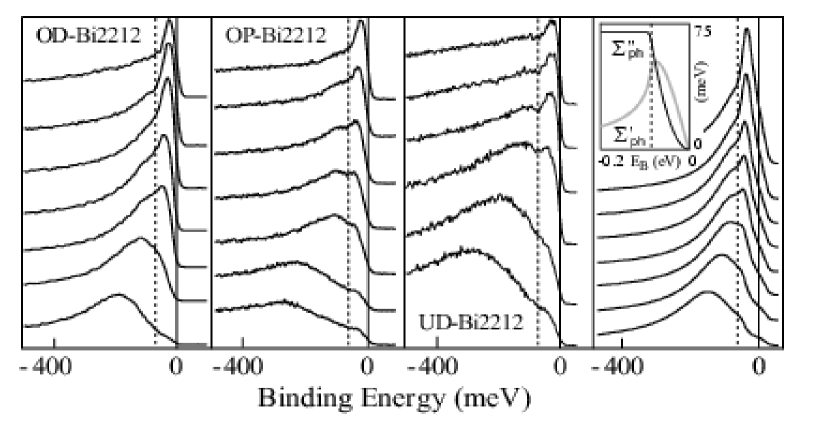
The most important aspect is that these spectra are characterized by a clear peak-dip-hump structure, in strong resemblance with both the simulated spectral function for an electron-phonon coupled systems (Fig. 79, right panel), and the results for the Be(0001) surface state presented in Fig. 69a. Note that the peak-dip-hump structure is better resolved in these data than in those reported in an earlier publication Bogdanov et al. (2000) because of the improved signal-to-noise ratio and possibly the higher photon energy used in the more recent experiments. Furthermore, the dip energy marked by dashed lines in Fig. 79 corresponds to that of the kink in the dispersion (Fig 78). However, while the kink is still recognizable above , the peak-dip-hump structure is smeared out at high temperature. Similar results were also obtained along the nodal direction for LSCO Zhou (2001) and Bi2201 Lanzara (2002). In particular, for Bi2201 the peak-dip-hump structure could be clearly observed also above , as this is low enough that the system can be studied in the normal state avoiding, at the same time, excessive thermal broadening.
From the ratio of the quasiparticle velocities at energies above and below the kink, Lanzara et al. (2001) estimated the quantity which is proportional to the electron-phonon coupling parameter [note that this is the same procedure already discussed in Sec. VIII.1 for Be(0001); however, in the present case because of the underlying electron-electron correlations the quasiparticle velocity is already strongly renormalized over a large energy scale]. The doping dependence of is presented in Fig. 78f and it clearly shows that the electron-phonon coupling increases in all the systems (i.e., LSCO, Bi2201, and Bi2212) upon reducing the doping level.
The ARPES results presented in this section indicate that in addition to the electron self-energy corrections due to electron-electron correlations, which are responsible for the renormalization of the electronic structure of the cuprates over a large energy scale (see, e.g., Sec. IV.1), also the contribution from electron-phonon interaction must be taken into account, as the latter appears to have a direct influence on the quasiparticle dynamics. In this regard Shen et al. (2001b) went a step further and, by considering both the diagonal and off-diagonal channels of electron-phonon coupling for and -type HTSC superconductors, asserted that electron-phonon interaction is also an essential ingredient to pairing (a more detailed discussion of this issue is however beyond the scope of our review).
VIII.3.3 Discussion
As we have seen throughout this section, the investigation of the self-energy corrections in Bi2212 is an extremely complex issue. There are now strong evidences that the normal and superconducting state low-energy dispersion along the nodal direction is characterized by a sharp break accompanied by a double peak structure in the EDCs (as indicated not only by the data from Bi2212 but also from Bi2201 and LSCO). This identifies an energy scale in the quasiparticle dynamics which is naturally explained as a consequence of relatively strong electron-phonon coupling. On the other hand, the results we discussed for the antinodal region are much less certain because of the complications due to the superstructure contaminations and bilayer splitting effects. Most recently, however, new and more convincing evidence for the presence of a kink in the Bi2212 quasiparticle dispersion near (,0) below was reported by Gromko et al. (2002b, a).
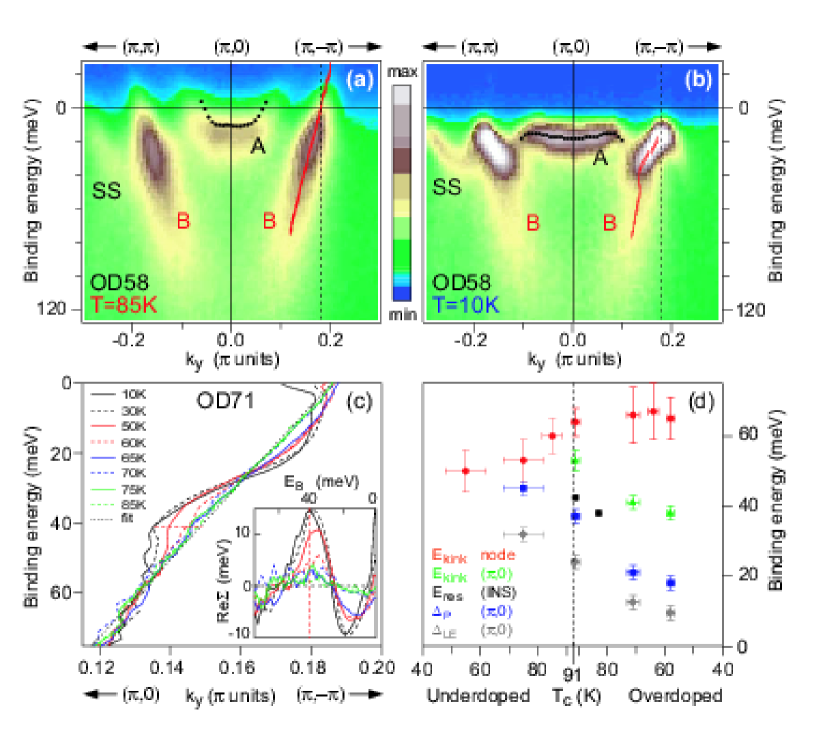
As shown in Fig. 80a where the normal state ARPES intensity from overdoped Bi2212 along the (,)-(,0)-(,) direction is presented, these authors could clearly resolved the bonding and antibonding split bands as well as their superstructure replicas. Below K (Fig. 80b), one can observe the opening of the superconducting gap and the sharpening and/or intensity increase of the low energy peaks, which give rise to the traditional (,0) peak-dip-hump structure. In addition, the bonding band MDC-derived dispersion, which was linear above , is now characterized by a sharp kink at 40 meV (this is further substantiated by the detailed study on a K overdoped sample presented in Fig. 80c). It has to be emphasized that, on the one hand, this work confirms prior reports [see, e.g., Norman et al. (2001a)]. On the other hand, while the kink in the (,0) region was believed to be connected to the traditional peak-dip-hump structure, these results indicate the independency of the two phenomena, with the traditional peak-dip-hump structure being simply a bilayer splitting effect. Furthermore, Gromko et al. (2002a) reported that the emergence of the (,0) kink at 40 meV in the bonding band is accompanied by the development of a separate antinodal peak-dip-hump structure much weaker than the traditional one, consistent with an earlier report [Feng et al. (2001); see crosses and bars in Fig. 34b].
From the comparison between the results above and those presented in Sec. VIII.3, it is clear that the kinks in the antinodal and nodal dispersions have a completely different origins: (i) while the former has a dramatic temperature dependence and is observed only below (Fig. 80c), the latter is seen already above and is essentially independent of temperature (Fig. 78). (ii) As summarized by Gromko et al. (2002b) in Fig. 80d where several energy scales are plotted versus doping, the antinodal kink has a characteristic energy significantly smaller than the nodal one. (iii) Different is also the doping dependence of the energy scale (Fig. 80d), and of the magnitude of the velocity renormalization; as for the latter, which is proportional to the coupling strength, while the nodal kink gets weaker upon increasing doping, the antinodal one remains very strong in the overdoped regime.383838It should be noted that it is hard to judge whether in the antinodal region there is an additional kink at higher binding energies, similar to the one observed along the nodal direction. This is due to the very limited energy range of the data at (,0), which is defined by the bottom of the bonding band (see Fig. 34 and 80).
Because the antinodal kink is clearly associated with the onset of superconductivity and it is limited to a small momentum space region around (,0) where the superconducting gap is maximum, Gromko et al. (2002b) suggested that this effect is due to the coupling between the electrons and the magnetic resonant mode. This, in turn, could be the source of pairing for high- superconductivity. However, in this regard a few caveats have to be mentioned. First of all, there are alternative explanations for the observed effect that have to be ruled out, such as the very same opening of the superconducting gap and the dramatic change in quasiparticle dynamics associated with it (see Sec. VI). Furthermore, at this stage there is no experimental evidence from inelastic neutron scattering experiments for the existence of the resonant mode in the extremely overdoped regime ( K), where the antinodal kink remain very strong. For a more conclusive assignment, a careful and more detailed investigation of these issues is required.
IX Concluding remarks
The results discussed in the course of this review article demonstrate that the HTSCs are complex materials characterized by many competing degrees of freedom. As a consequence, both the experimental investigation and the theoretical understanding are extremely difficult. However, the remarkable improvement of the ARPES technique has allowed the community to considerably deepen our knowledge of the electronic structure of cuprates, a fundamental step towards the development of a comprehensive theoretical description of these systems.
Looking back at the last decade, there are many topics for which the ARPES results have obtained a general consensus and have profoundly impacted our understanding of the physics of the copper oxide superconductors. (i) The importance of electronic correlations (Mott physics), and the renormalization of the bandwidth from to scale for the undoped parent compounds of the HTSCs. (ii) The existence of a well defined FS for the overdoped metal in all the different families of cuprates; in this context, the observation of two bilayer split sheets of FS in Bi2212 is the most direct evidence for the remarkable precision achieved by these measurements. (iii) The qualitative doping evolution of the electronic structure in the different HTSC families, and the influence of AF correlations in the p-type underdoped cuprates and especially in the n-type ones, in which the hot-spot physics is still observed at optimal doping. (iv) The overall -wave symmetry of the superconducting gap detected below in both hole and electron doped systems, which supports the universality of the pairing nature in the HTSCs. (v) The opening of the normal-state pseudogap at a temperature in the underdoped regime, with a -wave form similar to the one of the superconducting gap. (vi) The emergence of a coherent quasiparticle peak below near (,0) in Bi2212, whose spectral weight scales with the doping level in the underdoped regime. (vii) The presence of an energy scale of about 40-80 meV in the quasiparticle dynamics, as evidenced by the sharp dispersion renormalization and drop in the scattering rate observed at those energies at different momenta. Independently of its final interpretation, this latter effect is likely of great significance to pairing because its energy scale falls in between the values of and .
Looking towards the future, ARPES as a technique continues to experience a rapid development. In gas-phase photoemission experiments, which however are performed in a very different configuration, the energy resolution has now reached exceptional values of better than 0.01 meV Hollenstein et al. (2001). One would expect further progress also in solid state experiments. In addition to that, the most significant technological advances include the implementation of circularly polarized photon sources, spin-polarized detectors, and time-resolved systems. In this regard, it should be mentioned that most recently Kaminski et al. (2002), by detecting a difference in the ARPES intensity measured with left and right circularly polarized photons on Bi2212 at (,0), concluded that the opening of the normal-state pseudogap below in the underdoped regime corresponds to a phase transition into a state characterized by a spontaneously broken time-reversal symmetry [as suggested by Varma (2000)]. In turn, this would imply that identifies a new phase transition rather than the fluctuation regime for the superconducting order parameter. Although the validity of these conclusions remains to be tested further, this and other new experiments, not only limited to the specific field of HTSCs [for a general overview see, e.g., Grioni (2001)], indicate that the study of the electronic structure of complex materials by ARPES will remain a vibrant and rapidly evolving field.
Acknowledgments
We would first like to express our gratitude to the current and former members of the Stanford photoemission group for their cooperation, daily discussions, and many useful comments: N.P. Armitage, P. Bogdanov, Y. Chen, T. Cuk, D.S. Dessau, H. Eisaki, D.L. Feng, S.L. Friedmann, M.Z. Hasan, J.M. Harris, N.J.C. Ingle, S.A. Kellar, C. Kim, D.M. King, A. Lanzara, W.S. Lee, A.G. Loeser, D.H. Lu, D.S. Marshall, A.Y. Matsuura, T.-U. Nahm, C.-H. Park, A.V. Puchkov, F. Ronning, M.C. Schabel, K.M. Shen, Z.Y. Wang, B.O. Wells, P.J. White, W.L.Yang, and X.J. Zhou. We also would like to take this opportunity to acknowledge our collaborators in the field: A.V. Balatsky, R.J. Birgeneau, D.A. Bonn, E.W. Carlson, J.N. Eckstein, V.J. Emery, A. Fujimori, M. Greven, W.N. Hardy, A. Ino, A. Kapitulnik, M.A. Kastner, K. Kishio, S.A. Kivelson, R. Liang, S. Maekawa, Y. Maeno, L.L. Miller, T. Mizokawa, N. Nagaosa, D. Orgad, F. Parmigiani, G.A. Sawatzky, J.R. Schrieffer, W.E. Spicer, H. Takagi, S. Tajima, T. Timusk, T. Tohyama, Y. Tokura, S. Uchida, D. van der Marel, T. Yoshida, R. Yosjizaki, and Z.-X. Zhao. Over the years, we have also benefited tremendously from scientific discussions with S. Doniach, R.B. Laughlin, and S.-C. Zhang, and many other colleagues: E. Abrahams, P. Aebi, O.K. Andersen, P.W. Anderson, E. Arrigoni, A. Bansil, J.C. Campuzano, S. Chakravarty, A.V. Chubukov, E. Dagotto, J.C. Davis, H. Ding, Y. Endoh, M.E. Flatt, H. Fukuyama, D.-H. Lee, W. Hanke, W.A. Harrison, M. Imada, P.D. Johnson, B. Keimer, P.A. Lee, R.S. Markiewicz, J. Mesot, A. J. Millis, K.A. Moler, H.A. Mook, M.R. Norman, N.P. Ong, J. Orenstein, J. Osterwalder, S.H. Pan, M. Randeria, S. Sachdev, D.J. Scalapino, N.V. Smith, M. Tachiki, J.M. Tranquada, Y.J. Uemura, C.M. Varma, M.G. Zacher, and J. Zaanen. Last, it is a pleasure to thank E. Abrahams, P. Aebi, N.P. Armitage, E. Arrigoni, T. Cuk, N.J.C. Ingle, D.H. Lu, D.W. Lynch, R.S. Markiewicz, N. Nagaosa, M.R. Norman, F. Ronning, K.M. Shen, J. van den Brink, for the critical reading of this review article. This project was carried out at the Stanford Synchrotron Radiation Laboratory (SSRL) which is operated by the DOE Office of Basic Energy Sciences, Division of Chemical Sciences. The Office’s Division of Materials Science has provided funding for this project. The Stanford work was also supported by the NFS Grant No. DMR0071897 and ONR Grant No. N00014-98-1-0195.
References
- Abanov and Chubukov (1999) Abanov, A., and A. V. Chubukov, 1999, Phys. Rev. Lett. 83, 1652.
- Abrahams and Varma (2000) Abrahams, E., and C. M. Varma, 2000, Proc. Natl. Acad. Sci. USA 97, 5714.
- Abrikosov et al. (1993) Abrikosov, A. A., J. C. Campazuno, and K. Gofron, 1993, Physica C 214, 73.
- Abrikosov et al. (1965) Abrikosov, A. A., L. P. Gor’kov, and I. E. Dzyaloshinskii, 1965, Quantum Field Theoretical Methods in Statistical Physics (Pergamon Press, Oxford).
- Aebi et al. (1995) Aebi, P., J. Osterwalder, P. Schwaller, H. Berger, C. Beeli, and L. Schlapback, 1995, J. Phys. Chem. Solids 56, 1845.
- Aebi et al. (1994) Aebi, P., J. Osterwalder, P. Schwaller, L. Schlapbach, M. Shimoda, T. Mochiku, and K. Kadowaki, 1994, Phys. Rev. Lett. 72, 2757.
- Affleck and Marston (1988) Affleck, I., and J. B. Marston, 1988, Phys. Rev. B 37, 3774.
- Allen et al. (1990) Allen, J. W., C. G. Olson, M. B. Maple, J. S. Kang, L. Z. Liu, J. H. Park, R. O. Anderson, W. P. Ellis, J. T. Markert, Y. Dalichaoch, and R. Liu, 1990, Phys. Rev. Lett. 64, 595.
- Andersen et al. (1994) Andersen, O. K., O. Jepsen, A. I. Liechtenstein, and I. I. Mazin, 1994, Phys. Rev. B 49, 4145.
- Andersen et al. (1995) Andersen, O. K., A. I. Liechtenstein, O. Jepsen, and F. Paulsen, 1995, J. Phys. Chem. Solids 56, 1573.
- Andersen et al. (1991) Andersen, O. K., A. I. Liechtenstein, O. Rodriguez, I. I. Mazin, O. Jepsen, V. P. Aantropov, O. Gunnarsson, and S. Gopalan, 1991, Physica C 185-189, 147.
- Anderson (1950) Anderson, P. W., 1950, Phys. Rev. 79, 350.
- Anderson (1959) Anderson, P. W., 1959, Phys. Rev. 115, 2.
- Anderson (1987) Anderson, P. W., 1987, Science 235, 1196.
- Anderson (1995) Anderson, P. W., 1995, Science 268, 1154.
- Anderson (1997) Anderson, P. W., 1997, The Theory of Superconductivity in the High- Cuprates (Princeton University Press, Princeton).
- Anderson (1998) Anderson, P. W., 1998, Science 279, 1196.
- Anderson (2000) Anderson, P. W., 2000, Science 288, 480.
- Anderson et al. (1993) Anderson, R. O., R. Claessen, J. W. Allen, C. G. Olson, C. Janowitz, L. Z. Liu, J.-H. Park, M. B. Maple, Y. Dalichaouch, M. C. de Andrade, R. F. Jardim, E. A. Early, et al., 1993, Phys. Rev. Lett. 70, 3163.
- Armitage et al. (2001a) Armitage, N. P., D. H. Lu, D. L. Feng, C. Kim, A. Damascelli, K. M. Shen, F. Ronning, Z.-X. Shen, Y. Onose, Y. Taguchi, and Y. Tokura, 2001a, Phys. Rev. Lett. 86, 1126.
- Armitage et al. (2001b) Armitage, N. P., D. H. Lu, C. Kim, A. Damascelli, K. M. Shen, F. Ronning, D. L. Feng, P. Bogdanov, Z.-X. Shen, Y. Onose, Y. Taguchi, Y. Tokura, et al., 2001b, Phys. Rev. Lett. 87, 147003.
- Armitage et al. (2000) Armitage, N. P., D. H. Lu, C. Kim, A. Damascelli, K. M. Shen, F. Ronning, Y. Onose, Y. Taguchi, Y. Tokura, and Z.-X. Shen, 2000, Physica C 341-348, 2083.
- Armitage et al. (2002) Armitage, N. P., F. Ronning, D. H. Lu, C. Kim, A. Damascelli, K. M. Shen, D. L. Feng, H. Eisaki, Z.-X. Shen, P. K. Mang, N. Kaneko, M. Greven, et al., 2002, Phys. Rev. Lett. 88, 257001.
- Ashcroft and Mermin (1976) Ashcroft, N. W., and N. D. Mermin, 1976, Solid State Physics (Saunders College, Philadelphia).
- Atkinson (1999) Atkinson, W. A., 1999, Phys. Rev. B 59, 3377.
- Auerbach (1994) Auerbach, A., 1994, Interacting Electrons and Quantum Magnetism (Springer-Verlag, Berlin).
- Bachrach (1992) Bachrach, R. Z., 1992, Synchrotron Radiation Research, Advances in Surface and Interface Science, volume 1 (Plenum Press, New York).
- Balasubramanian et al. (1998) Balasubramanian, T., E. Jensen, X. L. Wu, and S. L. Hulbert, 1998, Phys. Rev. B 57, 6866.
- Balents et al. (1998) Balents, L., M. P. A. Fisher, and C. Nayak, 1998, Int. J. Mod. Phys. B 12, 1033.
- Balents et al. (1999) Balents, L., M. P. A. Fisher, and C. Nayak, 1999, Phys. Rev. B 60, 1654.
- Balents et al. (2000) Balents, L., M. P. A. Fisher, and C. Nayak, 2000, Phys. Rev. B 61, 6307.
- Bansil and Lindroos (1995) Bansil, A., and M. Lindroos, 1995, J. Phys. Chem. Solids 56, 1855.
- Bansil and Lindroos (1998) Bansil, A., and M. Lindroos, 1998, J. Phys. Chem. Solids 59, 1879.
- Bansil and Lindroos (1999) Bansil, A., and M. Lindroos, 1999, Phys. Rev. Lett. 83, 5154.
- Bardeen et al. (1957) Bardeen, J., L. N. Cooper, and J. R. Schrieffer, 1957, Phys. Rev. 108, 1175.
- Beamson et al. (1990) Beamson, G., D. Briggs, S. F. Davies, I. W. Fletcher, D. T. Clark, J. Howard, U. Gelius, B. Wannberg, and P. Balzer, 1990, Surf. Interface Anal. 15, 541.
- Bednorz and Müller (1986) Bednorz, J. G., and K. A. Müller, 1986, Zeit. Phys. B 64, 189.
- Belinicher et al. (1996) Belinicher, V. I., A. L. Chernyshev, and V. A. Shubin, 1996, Phys. Rev. B 54, 14914.
- Bergemann et al. (2000) Bergemann, C., S. R. Julian, A. P. Mackenzie, S. NishiZaki, and Y. Maeno, 2000, Phys. Rev. Lett. 84, 2662.
- Berglund and Spicer (1964) Berglund, C. N., and W. E. Spicer, 1964, Phys. Rev. 136, A1030.
- Bianconi et al. (1996) Bianconi, A., N. L. Saini, A. Lanzara, M. Missori, T. Rossetti, H. Oyanagi, H. Yamaguchi, K. Oka, and T. Ito, 1996, Phys. Rev. Lett. 76, 3412.
- Blumberg et al. (2002) Blumberg, G., A. Koitzsch, A. Gozar, B. S. Dennis, C. A. Kendziora, P. Fournier, and R. L. Greene, 2002, Phys. Rev. Lett. 88, 107002.
- Bogdanov et al. (2000) Bogdanov, P. V., A. Lanzara, S. A. Kellar, X. J. Zhou, E. D. Lu, W. J. Zheng, G. Gu, J.-I. Shinoyama, K. Kishio, H. Ikeda, R. Yoshizaki, Z. Hussain, et al., 2000, Phys. Rev. Lett. 85, 2581.
- Bogdanov et al. (2001) Bogdanov, P. V., A. Lanzara, X. J. Zhou, S. A. Kellar, D. L. Feng, E. D. Lu, H. Eisaki, J. Shimoyama, K. Kishio, Z. Hussain, and Z.-X. Shen, 2001, Phys. Rev. B 64, 180505.
- Bonn et al. (1994) Bonn, D. A., S. Kamal, K. Zhang, R. Liang, D. J. Baar, E. Klein, and W. N. Hardy, 1994, Phys. Rev. B 50, 4051.
- Borisenko et al. (2000) Borisenko, S. V., M. S. Golden, S. Legner, T. Pichler, C. Dürr, M. Knupfer, J. Fink, G. Yang, S. Abell, and H. Berger, 2000, Phys. Rev. Lett. 84, 4453.
- Borisenko et al. (2002) Borisenko, S. V., A. A. Kordyuk, T. K. Kim, S. Legner, K. A. Nenkov, M. Knupfer, M. S. Golden, J. Fink, H. Berger, and R. Follath, 2002, eprint cond-mat/0204557.
- Borisenko et al. (2001) Borisenko, S. V., A. A. Kordyuk, S. Legner, C. Dürr, M. Knupfer, M. S. Golden, J. Fink, K. Nenkov, D. Eckert, G. Yang, S. Abell, H. Berger, et al., 2001, Phys. Rev. B 64, 094513.
- Braun (1996) Braun, J., 1996, Rep. Prog. Phys. 59, 1267.
- Brookes et al. (2001) Brookes, N. B., G. Ghiringhelli, O. Tjernberg, L. H. Tjeng, T. Mizokawa, T. W. Li, and A. A. Menovsky, 2001, Phys. Rev. Lett. 87, 237003.
- Brundle and Baker (1977) Brundle, C. R., and A. D. Baker, 1977, Electron Spectroscopy: Theory, Techniques, and Applications, volume 1 (Academic Press, New York).
- Brundle and Baker (1978) Brundle, C. R., and A. D. Baker, 1978, Electron Spectroscopy: Theory, Techniques, and Applications, volume 2 (Academic Press, New York).
- Buckingham (1950) Buckingham, M. J., 1950, Phys. Rev. 80, 704.
- Bulut et al. (1994) Bulut, N., D. J. Scalapino, and S. R. White, 1994, Phys. Rev. Lett. 73, 748.
- Campuzano et al. (1998) Campuzano, J. C., H. Ding, H. Fretwell, J. Mesot, A. Kaminski, T. Yokoya, T. T., M. T., and K. K., 1998, eprint cond-mat/9811349.
- Campuzano et al. (1999) Campuzano, J. C., H. Ding, M. R. Norman, H. M. Fretwell, M. Randeria, A. Kaminski, J. Mesot, T. Takeuchi, T. Sato, T. Yokoya, T. Takahashi, T. Mochiku, et al., 1999, Phys. Rev. Lett. 83, 3709.
- Campuzano et al. (1996) Campuzano, J. C., H. Ding, M. R. Norman, M. Randeira, A. F. Bellman, T. Yokoya, T. Takahashi, H. Katayama-Yoshida, T. Mochiku, and K. Kadowaki, 1996, Phys. Rev. B 53, 14737.
- Cardona and Ley (1978) Cardona, M., and L. Ley, 1978, Photoemission in Solids, volume 1 (Springer-Verlag, Berlin).
- Carlson et al. (2000) Carlson, E. W., D. Orgad, S. A. Kivelson, and V. J. Emery, 2000, Phys. Rev. B 62, 3422.
- Carlson (1975) Carlson, T. A., 1975, Photoelectron and Auger Spectroscopy (Plenum Press, New York).
- Castellani et al. (1995) Castellani, C., C. Di Castro, and M. Grilli, 1995, Phys. Rev. Lett. 75, 4650.
- Chakravarty et al. (1995) Chakravarty, S., P. Aebi, J. Osterwalder, P. Schwaller, L. Schlapbach, M. Shimoda, T. Mochiku, and K. Kadowaki, 1995, Phys. Rev. Lett. 74, 1885.
- Chakravarty et al. (1989) Chakravarty, S., B. I. Halperin, and D. R. Nelson, 1989, Phys. Rev. B 39, 2344.
- Chakravarty et al. (2001) Chakravarty, S., R. B. Laughlin, D. K. Morr, and C. Nayak, 2001, Phys. Rev. B 63, 094503.
- Chakravarty et al. (1993) Chakravarty, S., A. Sudbo, P. W. Anderson, and S. Strong, 1993, Science 261, 337.
- Chen et al. (1994) Chen, X. K., J. C. Irwin, H. J. Trodahl, T. Kimura, and K. Kishio, 1994, Phys. Rev. Lett. 73, 3290.
- Chernyshev et al. (2000) Chernyshev, A. L., A. H. Castro Neto, and A. R. Bishop, 2000, Phys. Rev. Lett. 84, 4922.
- Chuang et al. (1999) Chuang, Y.-D., A. D. Gromko, D. S. Dessau, Y. Aiura, Y. Yamaguchi, K. Oka, A. J. Arko, J. Joyce, H. Eisaki, S. I. Uchida, S. I. Uchida, K. Nakamara, et al., 1999, Phys. Rev. Lett. 83, 3717.
- Chuang et al. (2001a) Chuang, Y.-D., A. D. Gromko, A. Fedorov, Y. Aiura, K. Oka, Y. Ando, H. Eisaki, S. I. Uchida, and D. S. Dessau, 2001a, Phys. Rev. Lett. 87, 117002.
- Chuang et al. (2001b) Chuang, Y.-D., A. D. Gromko, A. V. Fedorov, Y. Aiura, K. Oka, Y. Ando, and D. S. Dessau, 2001b, eprint cond-mat/0107002.
- Chubukov (1995) Chubukov, A. V., 1995, Phys. Rev. B 52, 3840.
- Chubukov and Morr (1998) Chubukov, A. V., and D. K. Morr, 1998, Phys. Rev. Lett. 81, 4716.
- Cooper (1962) Cooper, J. W., 1962, Phys. Rev. 128, 681.
- Courths and Hüfner (1984) Courths, R., and S. Hüfner, 1984, Phys. Rep. 112, 53.
- Dagotto (1994) Dagotto, E., 1994, Rev. Mod. Phys. 66, 763.
- Dagotto et al. (1991) Dagotto, E., A. Moreo, F. Ortolani, J. Riera, and D. J. Scalapino, 1991, Phys. Rev. Lett. 67, 1918.
- Dagotto et al. (1994) Dagotto, E., A. Nazarenko, and M. Boninsegni, 1994, Phys. Rev. Lett. 73, 728.
- Dagotto et al. (1995) Dagotto, E., A. Nazarenko, and A. Moreo, 1995, Phys. Rev. Lett. 74, 310.
- Dai et al. (1999) Dai, P., H. A. Mook, S. M. Hayden, G. Aeppli, T. G. Perring, R. D. Hunt, and F. Doan, 1999, Science 284, 1344.
- Dai et al. (1996) Dai, P., M. Yethiraj, F. A. Mook, T. B. Lindemer, and F. Doan, 1996, Phys. Rev. Lett. 77, 5425.
- Damascelli et al. (2000) Damascelli, A., D. H. Lu, K. M. Shen, N. P. Armitage, F. Ronning, D. L. Feng, C. Kim, Z.-X. Shen, T. Kimura, Y. Tokura, Z. Q. Mao, and Y. Maeno, 2000, Phys. Rev. Lett. 85, 5194.
- Damascelli et al. (2001a) Damascelli, A., D. H. Lu, and Z.-X. Shen, 2001a, J. Electron Spectr. Relat. Phenom. 117-118, 165.
- Damascelli et al. (2001b) Damascelli, A., K. M. Shen, D. H. Lu, N. P. Armitage, F. Ronning, D. L. Feng, C. Kim, Z.-X. Shen, T. Kimura, Y. Tokura, Z. Q. Mao, and Y. Maeno, 2001b, J. Electron Spectr. Relat. Phenom. 114-116, 641.
- Damascelli et al. (2001c) Damascelli, A., K. M. Shen, D. H. Lu, and Z.-X. Shen, 2001c, Phys. Rev. Lett. 87, 239702.
- Day (2001) Day, C., 2001, Phys. Today 54(4), 17.
- Derro et al. (2002) Derro, D. J., E. W. Hudson, K. M. Lang, S. H. Pan, J. C. Davis, J. T. Markert, and A. L. de Lozanne, 2002, Phys. Rev. Lett. 88, 097002.
- Dessau et al. (1993) Dessau, D. S., Z.-X. Shen, D. M. King, D. S. Marshall, L. W. Lombardo, P. H. Dickinson, A. G. Loeser, J. DiCarlo, C.-H. Park, A. Kapitulnik, and W. E. Spicer, 1993, Phys. Rev. Lett. 71, 2781.
- Dessau et al. (1991) Dessau, D. S., B. O. Wells, Z.-X. Shen, W. E. Spicer, A. J. Arko, R. S. List, D. B. Mitzi, and A. Kapitulnik, 1991, Phys. Rev. Lett. 66, 2160.
- Di Stasio et al. (1990) Di Stasio, M., K. A. Müller, and L. Pietronero, 1990, Phys. Rev. Lett. 64, 2827.
- Dickinson and Doniach (1993) Dickinson, P. H., and S. Doniach, 1993, Phys. Rev. B 47, 11447.
- Dietz et al. (1976) Dietz, E., H. Becker, and U. Gerhardt, 1976, Phys. Rev. Lett. 36, 1397.
- Ding et al. (1996a) Ding, H., A. F. Bellman, J. C. Campuzano, M. Randeria, M. R. Norman, T. Yokoya, T. Takahashi, H. Katayama-Yoshida, T. Mochiku, K. Kadowaki, G. Jennings, and G. P. Brivio, 1996a, Phys. Rev. Lett. 76, 1533.
- Ding et al. (1995a) Ding, H., J. C. Campuzano, A. F. Bellman, T. Yokoya, M. R. Norman, M. Randeria, T. Takahashi, H. Katayama-Yoshida, T. Mochiku, K. Kadowaki, and G. Jennings, 1995a, Phys. Rev. Lett. 74, 2784.
- Ding et al. (1995b) Ding, H., J. C. Campuzano, A. F. Bellman, T. Yokoya, M. R. Norman, M. Randeria, T. Takahashi, H. Katayama-Yoshida, T. Mochiku, K. Kadowaki, and G. Jennings, 1995b, Phys. Rev. Lett. 75, 1425.
- Ding et al. (2001) Ding, H., J. R. Engelbrecht, Z. Wang, J. C. Campuzano, S.-C. Wang, H.-B. Yang, R. Rogan, T. Takahashi, K. Kadowaki, and D. G. Hinks, 2001, Phys. Rev. Lett. 87, 227001.
- Ding et al. (1996b) Ding, H., M. R. Norman, J. C. Campuzano, M. Randeria, A. F. Bellman, T. Yokoya, T. Takahashi, T. Mochiku, and K. Kadowaki, 1996b, Phys. Rev. B 54, 9678.
- Ding et al. (1997) Ding, H., M. R. Norman, T. Yokoya, T. Takeuchi, M. Randeria, J. C. Campuzano, T. Takahashi, T. Mochiku, and K. Kadowaki, 1997, Phys. Rev. Lett. 78, 2628.
- Ding et al. (1996c) Ding, H., T. Yokoya, J. C. Campuzano, T. Takahashi, M. Randeria, M. R. Norman, T. Mochiku, K. Hadowaki, and J. Giapintzakis, 1996c, Nature 382, 51.
- Doniach and Inui (1990) Doniach, S., and M. Inui, 1990, Phys. Rev. B 41, 6668.
- Duò et al. (1996) Duò, L., S. De Rossi, P. Vavassori, F. Ciccacci, G. L. Olcese, G. Chiaia, and I. Lindau, 1996, Phys. Rev. B 54, 17363.
- Dürr et al. (2001) Dürr, C., S. Legner, R. Hayn, S. V. Borisenko, Z. Hu, A. Theresiak, M. Knupfer, M. S. Golden, J. Fink, F. Ronning, Z.-X. Shen, H. Eisaki, et al., 2001, Phys. Rev. B 63, 014505.
- Eastman (1972) Eastman, D. E., 1972, in Techniques of Metal Research, edited by E. Passaglia (Interscience Publisher, New York), volume VI, part I.
- Eberhardt and Himpsel (1980) Eberhardt, W., and F. J. Himpsel, 1980, Phys. Rev. B 21, 5572.
- Economou (1983) Economou, E. N., 1983, Green’s Functions in Quantum Physics, volume 7 of Springer Series in Solid State Science (Springer-Verlag, Berlin).
- Eder et al. (1997) Eder, R., Y. Ohta, and G. A. Sawatzky, 1997, Phys. Rev. B 55, 3414.
- Edwards et al. (1992) Edwards, H. L., J. T. Markert, and A. L. de Lozanne, 1992, Phys. Rev. Lett. 69, 2967.
- Einstein (1905) Einstein, A., 1905, Ann. Physik 31, 132.
- Eisaki et al. (2002) Eisaki, H., N. Kaneko, D. L. Feng, A. Damascelli, P. K. Mang, K. M. Shen, M. Greven, and Z.-X. Shen, 2002, preprint.
- Emery (1987) Emery, V. J., 1987, Phys. Rev. Lett. 58, 2794.
- Emery and Kivelson (1993a) Emery, V. J., and S. A. Kivelson, 1993a, Physica C 209, 597.
- Emery and Kivelson (1993b) Emery, V. J., and S. A. Kivelson, 1993b, Phys. Rev. Lett. 71, 3701.
- Emery and Kivelson (1995a) Emery, V. J., and S. A. Kivelson, 1995a, Nature 374, 434.
- Emery and Kivelson (1995b) Emery, V. J., and S. A. Kivelson, 1995b, Phys. Rev. Lett. 74, 3253.
- Emery et al. (1999) Emery, V. J., S. A. Kivelson, and J. M. Tranquada, 1999, Proc. Natl. Acad. Sci. USA 96, 8814.
- Engelsberg and Schrieffer (1963) Engelsberg, S., and J. R. Schrieffer, 1963, Phys. Rev. 131, 993.
- Eroles et al. (2001) Eroles, J., G. Ortiz, A. V. Balatsky, and A. R. Bishop, 2001, Phys. Rev. B 64, 174510.
- Eschrig and Norman (2000) Eschrig, M., and M. R. Norman, 2000, Phys. Rev. Lett. 85, 3261.
- Eschrig and Norman (2002) Eschrig, M., and M. R. Norman, 2002, eprint cond-mat/0202083.
- Eskes and Eder (1996) Eskes, H., and R. Eder, 1996, Phys. Rev. B 54, 14226.
- Fan (1945) Fan, H. Y., 1945, Phys. Rev. 68, 43.
- Fedorov et al. (1999) Fedorov, A. V., T. Valla, P. D. Johnson, Q. Li, G. D. Gu, and N. Koshizuka, 1999, Phys. Rev. Lett. 82, 2179.
- Feibelman and Eastman (1974) Feibelman, P. J., and D. E. Eastman, 1974, Phys. Rev. B 10, 4932.
- Feng et al. (2001) Feng, D. L., N. P. Armitage, D. H. Lu, A. Damascelli, J. P. Hu, P. Bogdanov, A. Lanzara, F. Ronning, K. M. Shen, H. Eisaki, C. Kim, Z.-X. Shen, et al., 2001, Phys. Rev. Lett. 86, 5550.
- Feng et al. (2002a) Feng, D. L., A. Damascelli, K. M. Shen, N. Motoyama, D. H. Lu, H. Eisaki, K. Shimizu, J. Shimoyama, K. Kishio, N. Kaneko, M. Greven, G. D. Gu, et al., 2002a, Phys. Rev. Lett. 88, 107001.
- Feng et al. (2002b) Feng, D. L., C. Kim, H. Eisaki, D. H. Lu, K. M. Shen, F. Ronning, N. P. Armitage, A. Damascelli, N. Kaneko, M. Greven, J. Shimoyama, K. Kishio, et al., 2002b, Phys. Rev. B 65, 220501.
- Feng et al. (2000) Feng, D. L., D. H. Lu, K. M. Shen, C. Kim, H. Eisaki, A. Damascelli, R. Yoshizaki, J. Shimoyama, K. Kishio, G. D. Gu, S. Oh, A. Andrus, et al., 2000, Science 289, 277.
- Feng et al. (1999) Feng, D. L., W. J. Zheng, K. M. Shen, D. H. Lu, F. Ronning, J. Shimoyama, K. Kishio, G. Gu, D. V. der Marel, and Z.-X. Shen, 1999, eprint cond-mat/9908056.
- Fetter and Walecka (1971) Fetter, A. L., and J. D. Walecka, 1971, Quantum Theory of Many-Particle Systems (McGraw-Hill, New York).
- Feuerbacher et al. (1978) Feuerbacher, B., B. Fitton, and R. F. Willis, 1978, Photoemission on the Electronic Properties of Surfaces (John Wiley & Sons, New York).
- Feuerbacher and Willis (1976) Feuerbacher, B., and R. F. Willis, 1976, J. Phys. Solid State Phys. 9, 169.
- Fink et al. (1989) Fink, J., N. Nücker, H. A. Romberg, and J. C. Fuggle, 1989, IBM J. Res. Dev. 33, 372.
- Fleck et al. (2000) Fleck, M., A. I. Lichtenstein, E. Pavarini, and A. M. Ole, 2000, Phys. Rev. Lett. 84, 4962.
- Fong et al. (1999) Fong, H. F., P. Bourges, Y. Sidis, L. P. Regnault, A. Ivanov, G. D. Gul, N. Koshizuka, and B. Keimer, 1999, Nature 398, 588.
- Fong et al. (1995) Fong, H. F., B. Keimer, P. W. Anderson, D. Reznik, F. Doan, and I. A. Aksay, 1995, Phys. Rev. Lett. 75, 316.
- Franz and Millis (1998) Franz, M., and A. J. Millis, 1998, Phys. Rev. B 58, 14572.
- Fretwell et al. (2000) Fretwell, H. M., A. Kaminski, J. Mesot, J. C. Campuzano, M. R. Norman, M. Randeria, T. Sato, R. Gatt, T. Takahashi, and K. Kadowaki, 2000, Phys. Rev. Lett. 84, 4449.
- Fulde (1995) Fulde, P., 1995, Electron Correlations in Molecules and Solids (Springer-Verlag, Berlin).
- Furukawa and Rice (1998) Furukawa, N., and T. M. Rice, 1998, J. Phys. Cond. Matt. 10, L381.
- Furukawa et al. (1998) Furukawa, N., T. M. Rice, and M. Salmhofer, 1998, Phys. Rev. Lett. 81, 3195.
- Gadzuk and Šunjić (1975) Gadzuk, J. W., and M. Šunjić, 1975, Phys. Rev. B 12, 524.
- Garnier et al. (1997) Garnier, M., K. Breuer, D. Purdie, M. Hengsberger, Y. Baer, and B. Delley, 1997, Phys. Rev. Lett. 78, 4127.
- Gavaler (1973) Gavaler, J. R., 1973, Appl. Phys. Lett. 23, 480.
- Gobeli et al. (1964) Gobeli, G. W., F. G. Allen, and E. O. Kane, 1964, Phys. Rev. Lett. 12, 94.
- Gofron et al. (1994) Gofron, K., J. C. Campuzano, A. A. Abrikosov, M. Lindroos, A. Bansil, H. Ding, D. Koelling, and B. Dabrowski, 1994, Phys. Rev. Lett. 73, 3302.
- Gofron et al. (1993) Gofron, K., J. C. Campuzano, H. Ding, C. Gu, R. Liu, B. Dabrowski, B. W. Veal, W. Cramer, and G. Jennings, 1993, J. Phys. Chem. Solids 54, 1193.
- Golden et al. (2001) Golden, M. S., C. Dürr, A. Koitzsch, S. Legner, Z. Hu, S. Borisenko, M. Knupfer, and J. Fink, 2001, J. Electron Spectr. Relat. Phenom. 117-118, 203.
- Greber et al. (1997) Greber, T., T. J. Kreutz, and J. Osterwalder, 1997, Phys. Rev. Lett. 79, 4465.
- Greven et al. (1994) Greven, M., R. J. Birgeneau, Y. Endoh, M. A. Kastner, B. Keimer, M. Matsuda, G. Shirane, and T. R. Thurston, 1994, Phys. Rev. Lett. 72, 1096.
- Grioni (2001) Grioni, M., 2001, J. Electron Spectr. Relat. Phenom. 117-118, special issue on Strongly Correlated Systems.
- Gromko et al. (2000) Gromko, A. D., Y.-D. Chuang, D. S. Dessau, K. Nakamura, and Y. Ando, 2000, eprint cond-mat/0003017.
- Gromko et al. (2002a) Gromko, A. D., Y.-D. Chuang, A. V. Fedorov, Y. Aiura, Y. Yamaguchi, K. Oka, Y. Ando, and D. S. Dessau, 2002a, eprint cond-mat/0205385.
- Gromko et al. (2002b) Gromko, A. D., A. V. Fedorov, Y.-D. Chuang, J. D. Koralek, Y. Aiura, Y. Yamaguchi, K. Oka, Y. Ando, and D. S. Dessau, 2002b, eprint cond-mat/0202329.
- Guinea et al. (2002) Guinea, F., R. S. Markiewicz, and M. A. H. Vozmediano, 2002, eprint cond-mat/0206208.
- Gweon et al. (2001) Gweon, G.-H., J. D. Denlinger, J. W. Allen, R. Claessen, C. G. Olson, H. Höchst, J. Marcus, C. Schlenker, and L. F. Schneemeyer, 2001, J. Electron Spectr. Relat. Phenom. 117-118, 481.
- Haas et al. (1995) Haas, S., A. Moreo, and E. Dagotto, 1995, Phys. Rev. Lett. 74, 4281.
- Haffner et al. (2001) Haffner, S., D. M. Brammeier, C. G. Olson, L. L. Miller, and D. W. Lynch, 2001, Phys. Rev. B 63, 212501.
- Haffner et al. (2000) Haffner, S., C. G. Olson, L. L. Miller, and D. W. Lynch, 2000, Phys. Rev. B 61, 14378.
- Han et al. (2000) Han, J. H., Q.-H. Wang, and D.-H. Lee, 2000, eprint cond-mat/0006046.
- Hansen et al. (1997a) Hansen, E. D., T. Miller, and T.-C. Chiang, 1997a, Phys. Rev. Lett. 78, 2807.
- Hansen et al. (1997b) Hansen, E. D., T. Miller, and T.-C. Chiang, 1997b, Phys. Rev. B 55, 1871.
- Hardy et al. (1993) Hardy, W. N., D. A. Bonn, D. C. Morgan, R. Liang, and K. Zhang, 1993, Phys. Rev. Lett. 70, 3999.
- Harima et al. (2002) Harima, N., A. Fujimori, T. Sugaya, and I. Terasaki, 2002, eprint cond-mat/0203154.
- Harima et al. (2001) Harima, N., J. Matsuno, A. Fujimori, Y. Onose, Y. Taguchi, and Y. Tokura, 2001, Phys. Rev. B 64, 220507.
- Harris et al. (1996) Harris, J. M., Z.-X. Shen, P. J. White, D. S. Marshall, M. C. Schabel, J. N. Eckstein, and I. Bozovic, 1996, Phys. Rev. B 54, 15665.
- Harris et al. (1997) Harris, J. M., P. J. White, Z.-X. Shen, H. Ikeda, R. Yoshizaki, H. Eisaki, S. Uchida, W. D. Si, J. W. Xiong, Z.-X. Zhao, and D. S. Dessau, 1997, Phys. Rev. Lett. 79, 143.
- He et al. (2001) He, H., Y. Sidis, P. Bourges, G. D. Gu, A. Ivanov, N. Koshizuka, B. Liang, C. T. Lin, L. P. Regnault, E. Schoenherr, and B. Keimer, 2001, Phys. Rev. Lett. 86, 1610.
- Hedin and Lundqvist (1969) Hedin, L., and S. Lundqvist, 1969, in Solid State Physics: Advances in Research and Applications, edited by H. Ehrenreich, F. Seitz, and D. Turnbull (Academic, New York), volume 23.
- Hengsberger et al. (1999a) Hengsberger, M., R. Fresard, D. Purdie, P. Segovia, and Y. Baer, 1999a, Phys. Rev. B 60, 10796.
- Hengsberger et al. (1999b) Hengsberger, M., D. Purdie, P. Segovia, M. Garnier, and Y. Baer, 1999b, Phys. Rev. Lett. 83, 592.
- Hermanson (1977) Hermanson, J., 1977, Solid State Commun. 22, 9.
- Hertz (1887) Hertz, H., 1887, Ann. Phys. 17, 983.
- Himpsel (1983) Himpsel, F. J., 1983, Adv. Phys. 32, 1.
- Hiroi et al. (1994) Hiroi, Z., N. Kobayashi, and M. Takano, 1994, Nature 371, 139.
- Hiroi et al. (1996) Hiroi, Z., N. Kobayashi, and M. Takano, 1996, Physica C 266, 191.
- Hodges et al. (1971) Hodges, C., H. Smith, and J. W. Wilkins, 1971, Phys. Rev. B 4, 302.
- Hofmann et al. (1998) Hofmann, P., Y. Q. Cai, C. Grütter, and J. H. Bilgram, 1998, Phys. Rev. Lett. 81, 1670.
- Hollenstein et al. (2001) Hollenstein, U., R. Seiler, H. Schmutz, M. Andrist, and F. Merkt, 2001, J. Chem. Phys. 115, 5461.
- Honerkamp et al. (2001) Honerkamp, C., M. Salmhofer, N. Furukawa, and T. M. Rice, 2001, Phys. Rev. B 63, 035109.
- Huang et al. (1990) Huang, Q., J. F. Zasadzinski, N. Tralshawala, K. E. Gray, D. G. Hinks, J. L. Peng, and R. L. Greene, 1990, Nature 347, 369.
- Hubbard (1964a) Hubbard, J., 1964a, Proc. R. Soc. London A 277, 237.
- Hubbard (1964b) Hubbard, J., 1964b, Proc. R. Soc. London A 281, 401.
- Hüfner (1995) Hüfner, S., 1995, Photoelectron Spectroscopy (Springer-Verlag, Berlin).
- Hwu et al. (1991) Hwu, Y., L. Lozzi, M. Marsi, S. La Rosa, M. Winokur, P. Davis, M. Onellion, H. Berger, F. Gozzo, F. Levy, and G. Margaritondo, 1991, Phys. Rev. Lett. 67, 2573.
- Ichioka and Machida (1999) Ichioka, M., and K. Machida, 1999, J. Phys. Soc. Jpn. 68, 4020.
- Imada (1993) Imada, M., 1993, J. Phys. Soc. Jpn. 62, 1105.
- Imada et al. (1998) Imada, M., A. Fujimori, and Y. Tokura, 1998, Rev. Mod. Phys. 70, 1039.
- Inglesfield and Holland (1981) Inglesfield, J. E., and B. W. Holland, 1981, in The Chemical Physics of Solid Surfaces and Heterogeneous Catalysis, edited by D. A. King and D. P. Woodruff (Elsevier Scientific Publishing Co., Amsterdam), volume 1.
- Ino et al. (1999) Ino, A., C. Kim, T. Mizokawa, Z.-X. Shen, A. Fujimori, M. Takaba, K. Tamasaku, H. Eisaki, and S. Uchida, 1999, J. Phys. Soc. Jpn. 68, 1496.
- Ino et al. (2002) Ino, A., C. Kim, M. Nakamura, T. Yoshida, T. Mizokawa, A. Fujimori, Z.-X. Shen, T. Kakeshita, H. Eisaki, and S. Uchida, 2002, Phys. Rev. B 65, 094504.
- Ino et al. (2000) Ino, A., C. Kim, M. Nakamura, T. Yoshida, T. Mizokawa, Z.-X. Shen, A. Fujimori, T. Kakeshita, H. Eisaki, and S. Uchida, 2000, Phys. Rev. B 62, 4137.
- Ino et al. (1997) Ino, A., T. Mizokawa, A. Fujimori, K. Tamesaku, H. Eisaki, S. Uchida, T. Kimura, T. Sasagawa, and K. Kishio, 1997, Phys. Rev. Lett. 79, 2101.
- Ino et al. (1998) Ino, A., T. Mizokawa, K. Kobayashi, A. Fujimori, T. Sasagawa, T. Kimura, K. Kishio, K. Tamasaku, H. Eisaki, and S. Uchida, 1998, Phys. Rev. Lett. 81, 2124.
- Ioffe and Millis (1996) Ioffe, L. B., and A. J. Millis, 1996, Phys. Rev. B 54, 3645.
- Jacobs et al. (1995) Jacobs, T., S. Sridhar, Q. Li, G. D. Gu, and N. Koshizuka, 1995, Phys. Rev. Lett. 75, 4516.
- Jahn and Teller (1937) Jahn, H. A., and E. Teller, 1937, Proc. R. Soc. London A 61, 220.
- Johnson et al. (2001a) Johnson, P. D., A. V. Fedorov, and T. Valla, 2001a, J. Electron Spectr. Relat. Phenom. 117-118, 153.
- Johnson et al. (2001b) Johnson, P. D., T. Valla, A. V. Fedorov, Z. Yusof, B. O. Wells, Q. Li, A. R. Moodenbaugh, G. D. Gu, N. Koshizuka, C. Kendziora, S. Jian, and D. G. Hinks, 2001b, Phys. Rev. Lett. 87, 177007.
- Jorgensen et al. (1987) Jorgensen, J. D., M. A. Beno, D. G. Hinks, L. Soderholm, K. J. Volin, R. L. Hitterman, J. D. Grace, I. K. Schuller, C. U. Segre, K. Zhang, and M. S. Kleefisch, 1987, Phys. Rev. B 36, 3608.
- Joyce et al. (1992) Joyce, J. J., A. J. Arko, J. Lawrence, P. C. Canfield, Z. Fisk, R. J. Bartlett, and J. D. Thompson, 1992, Phys. Rev. Lett. 68, 236.
- Kaindl et al. (1992) Kaindl, G., M. Domke, C. Laubschat, E. Weschke, and C. Xue, 1992, Rev. Sci. Instrum. 63, 1234.
- Kaminski et al. (2000) Kaminski, A., J. Mesot, H. Fretwell, J. C. Campuzano, M. R. Norman, M. Randeria, H. Ding, T. Sato, T. Takahaski, T. Mochiku, K. Kadowaki, and H. Hoechsts, 2000, Phys. Rev. Lett. 84, 1788.
- Kaminski et al. (2001) Kaminski, A., M. Randeria, J. C. Campuzano, M. R. Norman, H. Fretwell, J. Mesot, T. Sato, T. Takahashi, and K. Kadowaki, 2001, Phys. Rev. Lett. 86, 1070.
- Kaminski et al. (2002) Kaminski, A., S. Rosenkranz, H. M. Fretwell, J. C. Campuzano, Z. Li, H. Raffy, W. G. Cullen, H. You, C. G. Olson, C. M. Varma, and H. Höchst, 2002, Nature 416, 610.
- Kampf and Schrieffer (1990a) Kampf, A., and J. R. Schrieffer, 1990a, Phys. Rev. B 41, 6399.
- Kampf and Schrieffer (1990b) Kampf, A. P., and J. R. Schrieffer, 1990b, Phys. Rev. B 42, 7967.
- Kevan (1992) Kevan, S. D., 1992, Angle Resolved Photoemission-Theory and Current Applications (Elsevier Science, Amsterdam).
- Kevan and Rotenberg (2001) Kevan, S. D., and E. Rotenberg, 2001, J. Electron Spectr. Relat. Phenom. 117-118, 57.
- Kim (2001) Kim, C., 2001, J. Electron Spectr. Relat. Phenom. 117-118, 503.
- Kim et al. (1996) Kim, C., A. Y. Matsuura, Z.-X. Shen, N. Motoyama, H. Eisaki, S. Uchida, T. Tohyama, and S. Maekawa, 1996, Phys. Rev. Lett. 77, 4054.
- Kim et al. (2002) Kim, C., F. Ronning, A. Damascelli, D. L. Feng, Z.-X. Shen, B. O. Wells, Y. J. Kim, R. J. Birgeneau, M. A. Kastner, L. L. Miller, H. Eisaki, and S. Uchida, 2002, Phys. Rev. B 65, 174516.
- Kim et al. (1997) Kim, C., Z.-X. Shen, N. Motoyama, H. Eisaki, S. Uchida, T. Tohyama, and S. Maekawa, 1997, Phys. Rev. B 56, 15589.
- Kim et al. (1998) Kim, C., P. J. White, Z.-X. Shen, T. Tohyama, Y. Shibata, S. Maekawa, B. O. Wells, Y. J. Kim, R. J. Birgeneau, and M. A. Kastner, 1998, Phys. Rev. Lett. 80, 4245.
- Kimura et al. (2000) Kimura, H., K. Hirota, C.-H. Lee, K. Yamada, and G. Shirane, 2000, J. Phys. Soc. Jpn. 69, 851.
- King et al. (1995) King, D. M., D. S. Dessau, A. G. Loeser, Z.-X. Shen, and B. O. Wells, 1995, J. Phys. Chem. Solids 56, 1865.
- King et al. (1993) King, D. M., Z.-X. Shen, D. S. Dessau, B. O. Wells, W. E. Spicer, A. J. Arko, D. S. Marshall, J. DiCarlo, A. G. Loeser, C. H. Park, E. R. Ratner, J. L. Peng, et al., 1993, Phys. Rev. Lett. 70, 3159.
- Kipp et al. (1999) Kipp, L., K. Rossnagel, C. Solterbeck, T. Strasser, W. Schattke, and M. Skibowski, 1999, Phys. Rev. Lett. 83, 5551.
- Kittel (1996) Kittel, C., 1996, Introduction to Solid State Physics (John Wiley & Sons, New York).
- Kivelson et al. (1998) Kivelson, S. A., E. Fradkin, and V. J. Emery, 1998, Nature 393, 550.
- Koch et al. (1991) Koch, E.-E., G. V. Marr, G. S. Brown, D. E. Moncton, S. Ebashi, M. Koch, and E. Rubenstein (eds.), 1991, Handbook on Synchrotron Radiation (Elsevier Science, Amsterdam).
- Kohsaka et al. (2001) Kohsaka, Y., T. Sasagawa, F. Ronning, T. Yoshida, C. Kim, T. Hanaguri, M. Azuma, M. Takano, Z.-X. Shen, and H. Takagi, 2001, preprint.
- Kokales et al. (2000) Kokales, J. D., P. Fournier, L. V. Mercaldo, V. V. Talanov, R. L. Greene, and S. M. Anlage, 2000, Phys. Rev. Lett. 85, 3696.
- Kordyuk et al. (2002) Kordyuk, A. A., S. V. Borisenko, M. S. Golden, S. Legner, K. A. Nenkov, M. Knupfer, J. Fink, H. Berger, L. Forro, and R. Follath, 2002, Phys. Rev. B 66, 014502.
- Kordyuk et al. (2001) Kordyuk, A. A., S. V. Borisenko, T. K. Kim, K. Nenkov, M. Knupfer, M. S. Golden, J. Fink, H. Berger, and R. Follath, 2001, eprint cond-mat/0110379.
- Kotliar and Liu (1988) Kotliar, G., and J. Liu, 1988, Phys. Rev. Lett. 61, 1784.
- Krakauer and Pickett (1988) Krakauer, H., and W. E. Pickett, 1988, Phys. Rev. Lett. 60, 1665.
- Kuroda and Varma (1990) Kuroda, Y., and C. M. Varma, 1990, Phys. Rev. B 42, 8619.
- Kusko et al. (2002) Kusko, C., R. S. Markiewicz, M. Lindroos, and A. Bansil, 2002, eprint cond-mat/0201117.
- Kyung and Ferrell (1996) Kyung, B., and R. A. Ferrell, 1996, Phys. Rev. B 54, 10125.
- La Rosa et al. (1997) La Rosa, S., I. Vobornik, F. Zwick, H. Berger, M. Grioni, G. Margaritondo, R. J. Kelley, M. Onellion, and A. Chubukov, 1997, Phys. Rev. B 56, 525.
- Landau (1956) Landau, L. D., 1956, Sov. Phys. JETP 3, 920.
- Landau (1957) Landau, L. D., 1957, Sov. Phys. JETP 5, 101.
- Landau (1959) Landau, L. D., 1959, Sov. Phys. JETP 8, 70.
- Lanzara (2002) Lanzara, A., 2002, preprint.
- Lanzara et al. (2001) Lanzara, A., P. V. Bogdanov, X. J. Zhou, S. A. Kellar, D. L. Feng, E. D. Lu, T. Yoshida, H. Elsaki, A. Fujimori, K. Kishio, J. Shimoyama, T. Noda, et al., 2001, Nature 412, 510.
- LaShell et al. (2000) LaShell, S., E. Jensen, and T. Balasubramanian, 2000, Phys. Rev. B 61, 2371.
- Laughlin (1995) Laughlin, R. B., 1995, J. Low Temp. Phys. 99, 443.
- Laughlin (1997) Laughlin, R. B., 1997, Phys. Rev. Lett. 79, 1726.
- Leckey (1982) Leckey, R. C. G., 1982, Appl. Surf. Sci. 13, 125.
- Lee (2000) Lee, D.-H., 2000, Phys. Rev. Lett. 84, 2694.
- Lee and Nagaosa (1992) Lee, P. A., and N. Nagaosa, 1992, Phys. Rev. B 46, 5621.
- Lee and Shih (1997) Lee, T. K., and C. T. Shih, 1997, Phys. Rev. B 55, 5983.
- Lema and Aligia (1997) Lema, F., and A. A. Aligia, 1997, Phys. Rev. B 55, 14092.
- Leung et al. (1997) Leung, P. W., B. O. Wells, and R. J. Gooding, 1997, Phys. Rev. B 56, 6320.
- Levi (1990) Levi, B. G., 1990, Phys. Today 43(3), 20.
- Levi (1993) Levi, B. G., 1993, Phys. Today 46(5), 17.
- Levi (1996) Levi, B. G., 1996, Phys. Today 49(1), 19.
- Ley and Cardona (1979) Ley, L., and M. Cardona, 1979, Photoemission in Solids, volume II (Springer-Verlag, Berlin).
- Liang et al. (1998) Liang, R., D. A. Bonn, and W. N. Hardy, 1998, Physica C 304, 105.
- Lieb and Wu (1968) Lieb, E. H., and F. Y. Wu, 1968, Phys. Rev. Lett. 20, 1445.
- Liebsch (1976) Liebsch, A., 1976, Phys. Rev. B 13, 544.
- Liebsch (1978) Liebsch, A., 1978, in Electron and Ion Spectroscopy of Solids, edited by L. Fiermans, J. Vennik, and W. Dekeyser (Plenum Press, New York).
- Liechtenstein et al. (1996) Liechtenstein, A. I., O. Gunnarsson, O. K. Andersen, and R. M. Martin, 1996, Phys. Rev. B 54, 12505.
- Limonov et al. (2000) Limonov, M. F., A. I. Rykov, S. Tajima, and A. Yamanaka, 2000, Phys. Rev. B 61, 12412.
- Lindau and Spicer (1980) Lindau, I., and W. E. Spicer, 1980, in Synchrotron Radiation Research, edited by H. Winick and S. Doniach (Plenum Press, New York).
- Lindroos and Bansil (1995) Lindroos, M., and A. Bansil, 1995, Phys. Rev. Lett. 75, 1182.
- Lindroos and Bansil (1996) Lindroos, M., and A. Bansil, 1996, Phys. Rev. Lett. 77, 2985.
- Lindroos et al. (2002) Lindroos, M., S. Sahrakorpi, and A. Bansil, 2002, Phys. Rev. B 65, 054514.
- Littlewood and Varma (1991) Littlewood, P. B., and C. M. Varma, 1991, J. Appl. Phys. 69, 4979.
- Liu et al. (1995) Liu, R., B. W. Veal, C. Gu, A. P. Paulikas, P. Kostic, and C. G. Olson, 1995, Phys. Rev. B 52, 553.
- Liu and Manousakis (1992) Liu, Z., and E. Manousakis, 1992, Phys. Rev. B 45, 2425.
- Loeser et al. (1996) Loeser, A. G., Z.-X. Shen, D. S. Dessau, D. S. Marshall, C. H. Park, P. Fournier, and A. Kapitulnik, 1996, Science 273, 325.
- Loeser et al. (1997) Loeser, A. G., Z.-X. Shen, M. C. Schabel, C. Kim, M. Zhang, A. Kapitulnik, and P. Fournier, 1997, Phys. Rev. B 56, 14185.
- Lu et al. (2001) Lu, D. H., D. L. Feng, N. P. Armitage, K. M. Shen, A. Damascelli, C. Kim, F. Ronning, Z.-X. Shen, D. A. Bonn, R. Liang, W. N. Hardy, A. I. Rykov, et al., 2001, Phys. Rev. Lett. 86, 4370.
- Lu et al. (1996) Lu, D. H., M. Schmidt, T. R. Cummins, S. Schuppler, F. Lichtenberg, and J. G. Bednorz, 1996, Phys. Rev. Lett. 76, 4845.
- Luttinger (1960) Luttinger, J. M., 1960, Phys. Rev. 119, 1153.
- Luttinger (1961) Luttinger, J. M., 1961, Phys. Rev. 121, 942.
- Lynch and Olson (1999) Lynch, D. W., and C. G. Olson, 1999, Photoemission Studies of High-Temperature Superconductors (Cambridge University Press, Cambridge).
- Mackenzie et al. (1996) Mackenzie, A. P., S. R. Julian, A. J. Diver, G. J. Mcmullan, M. P. Ray, G. G. Lonzarich, Y. Maeno, S. Nishizaki, and T. Fujita, 1996, Phys. Rev. Lett. 76, 3786.
- Maekawa et al. (1988) Maekawa, S., T. Matsuura, Y. Isawa, and H. Ebisawa, 1988, Physica C 152, 133.
- Mahan (1970) Mahan, G. D., 1970, Phys. Rev. B 2, 4334.
- Mahan (1978) Mahan, G. D., 1978, in Electron and Ion Spectroscopy of Solids, edited by L. Fiermans, J. Vennik, and W. Dekeyser (Plenum Press, New York).
- Mahan (1981) Mahan, G. D., 1981, Many-Particle Physics (Plenum Press, New York).
- Makinson (1949) Makinson, R. E. B., 1949, Phys. Rev. 75, 1908.
- Margaritondo and Weaver (1983) Margaritondo, G., and J. H. Weaver, 1983, in Methods of Experimental Physics: Surfaces, edited by M. G. Legally and R. L. Park (Academic Press, New York).
- Markiewicz (1991) Markiewicz, R. S., 1991, Int. J. Mod. Phys. B 5, 2037.
- Markiewicz (1997) Markiewicz, R. S., 1997, J. Phys. Chem. Solids 58, 1179.
- Markiewicz (2000) Markiewicz, R. S., 2000, Phys. Rev. B 62, 1252.
- Marshall et al. (1996) Marshall, D. S., D. S. Dessau, A. G. Loeser, C.-H. Park, A. Y. Matsuura, J. N. Eckstein, I. Bozovic, P. Fournier, A. Kapitulnik, W. E. Spicer, and Z.-X. Shen, 1996, Phys. Rev. Lett. 76, 4841.
- Martensson et al. (1994) Martensson, N., P. Baltzer, P. A. Bruhwiler, J.-O. Forsell, A. Nilsson, A. Stenborg, and B. Wannberg, 1994, J. Electron Spectr. Relat. Phenom. 70, 117.
- Massidda et al. (1988) Massidda, S., J. Yu, and A. J. Freeman, 1988, Physica C 152, 251.
- Mattheiss (1987) Mattheiss, L. F., 1987, Phys. Rev. Lett. 58, 1028.
- Matzdorf et al. (2000) Matzdorf, R., Z. Fang, Ismail, J. Zhang, T. Kimura, Y. Tokura, K. Terakura, and E. W. Plummer, 2000, Science 289, 746.
- Mazin and Singh (1997) Mazin, I. I., and D. J. Singh, 1997, Phys. Rev. Lett. 79, 733.
- McQueeney et al. (1999) McQueeney, R. J., Y. Petrov, T. Egami, M. Yethiraj, G. Shirane, and Y. Endoh, 1999, Phys. Rev. Lett. 82, 628.
- Meinders (1994) Meinders, M. B. J., 1994, Ph.D. Thesis (University of Groningen, The Netherlands).
- Mesot et al. (2001a) Mesot, J., M. Boehm, M. R. Norman, M. Randeria, N. Metoki, A. Kaminski, S. Rosenkranz, A. Hiess, H. M. Fretwell, J. C. Campuzano, and K. Kadowaki, 2001a, eprint cond-mat/0102339.
- Mesot et al. (1999) Mesot, J., M. R. Norman, H. Ding, M. Randeria, J. C. Campuzano, A. Paramekanti, H. M. Fretwell, A. Kaminski, T. Takeuchi, S. Yokoya, T. Sato, T. Takahashi, et al., 1999, Phys. Rev. Lett. 83, 840.
- Mesot et al. (2001b) Mesot, J., M. Randeria, M. R. Norman, A. Kaminski, H. M. Fretwell, J. C. Campuzano, H. Ding, T. Takeuchi, T. Sato, T. Yokoya, T. Takahashi, I. Chong, et al., 2001b, Phys. Rev. B 63, 224516.
- Miller et al. (1996) Miller, T., W. E. McMahon, and T.-C. Chiang, 1996, Phys. Rev. Lett. 77, 1167.
- Millis (1999) Millis, A. J., 1999, Nature 398, 193.
- Mitchell (1934) Mitchell, K., 1934, Proc. Roy. Soc. London A 146, 442.
- Mitton (1995) Mitton, S., 1995, Science Watch 6(1), 1.
- Mitton (1998) Mitton, S., 1998, Science Watch 9(2), 1.
- Molegraaf et al. (2002) Molegraaf, H. J. A., C. Presura, D. van der Marel, P. H. Kes, and M. Li, 2002, Science 295, 2239.
- Moler et al. (1998) Moler, K. A., J. R. Kirtley, D. G. Hinks, T. W. Li, and M. Xu, 1998, Science 279, 1193.
- Molodtsov et al. (2000) Molodtsov, S. L., S. V. Halilov, V. D. P. Servedio, W. Schneider, S. Danzenbächer, J. J. Hinarejos, M. Richter, and C. Laubschat, 2000, Phys. Rev. Lett. 85, 4184.
- Mook et al. (1998) Mook, H. A., F. Doan, and B. C. Chakoumakos, 1998, eprint cond-mat/9811100.
- Mook et al. (1993) Mook, H. A., M. Yethiraj, G. Aeppli, T. E. Mason, and T. Armstrong, 1993, Phys. Rev. Lett. 70, 3490.
- Moraghebi et al. (2001) Moraghebi, M., C. Buhler, S. Yunoki, and A. Moreo, 2001, Phys. Rev. B 63, 214513.
- Mori et al. (2001) Mori, M., T. Tohyama, and S. Maekawa, 2001, eprint cond-mat/0110050.
- Mott (1949) Mott, N. F., 1949, Proc. Phys. Soc. London A 62, 416.
- Mott (1956) Mott, N. F., 1956, Canad. J. Phys. A 34, 1356.
- Mott (1974) Mott, N. F., 1974, Metal Insulator Transition (Taylor and Francis, London).
- Müller et al. (2002) Müller, R., C. Janowitz, M. Schneider, R.-S. Unger, A. Krapf, H. Dwelk, A. Müller, L. Dudy, R. Manzke, and H. Hoechst, 2002, J. Supercond. 15, 147.
- Nagamatsu et al. (2001) Nagamatsu, J., N. Nakagawa, T. Muranaka, Y. Zenitani, and J. Akimitsu, 2001, Nature 410, 63.
- Nagaosa and Lee (2000) Nagaosa, N., and P. A. Lee, 2000, Phys. Rev. B 61, 9166.
- Nakano et al. (1998) Nakano, T., N. Momono, M. Oda, and M. Ido, 1998, J. Phys. Soc. Jpn. 67, 2622.
- Nazarenko et al. (1995) Nazarenko, A., K. J. E. Vos, S. Haas, E. Dagotto, and R. J. Gooding, 1995, Phys. Rev. B 51, 8676.
- Nemoshkalenko and Aleshin (1979) Nemoshkalenko, V. V., and V. G. Aleshin, 1979, Electron Spectroscopy of Crystals (Plenum Press, New York).
- Norman (2001) Norman, M. R., 2001, Phys. Rev. B 63, 092509.
- Norman and Ding (1998) Norman, M. R., and H. Ding, 1998, Phys. Rev. B 57, 11089.
- Norman et al. (1997) Norman, M. R., H. Ding, J. C. Campuzano, T. Takeuchi, M. Randeria, T. Yokoya, T. Takahashi, T. Mochiku, and K. Kadowaki, 1997, Phys. Rev. Lett. 79, 3506.
- Norman et al. (1999) Norman, M. R., H. Ding, H. Fretwell, M. Randeria, and J. C. Campuzano, 1999, Phys. Rev. B 60, 7585.
- Norman et al. (1998a) Norman, M. R., H. Ding, M. Randeria, J. C. Campuzano, T. Yokoya, T. Takeuchi, T. Takahashi, T. Mochiku, K. Kadowaki, P. Guptasarma, and D. G. Hinks, 1998a, Nature 392, 157.
- Norman et al. (2001a) Norman, M. R., M. Eschrig, A. Kaminski, and J. C. Campuzano, 2001a, Phys. Rev. B 64, 184508.
- Norman et al. (2001b) Norman, M. R., A. Kaminski, J. Mesot, and J. C. Campuzano, 2001b, Phys. Rev. B 63, 140508.
- Norman et al. (1998b) Norman, M. R., M. Randeria, H. Ding, and J. C. Campuzano, 1998b, Phys. Rev. B 57, 11093.
- Nozières (1964) Nozières, P., 1964, Theory of Interacting Fermi Systems (Benjamin, New York).
- Oguchi (1995) Oguchi, T., 1995, Phys. Rev. B 51, 1385.
- Olson et al. (1990) Olson, C. G., R. Liu, D. W. Lynch, R. S. List, A. J. Arko, B. W. Veal, Y. C. Chang, P. Z. Jiang, and A. P. Paulikas, 1990, Phys. Rev. B 42, 381.
- Olson et al. (1989) Olson, C. G., R. Liu, A.-B. Yang, D. W. Lynch, A. J. Arko, R. S. List, B. W. Veal, Y. C. Chang, P. Z. Jiang, and A. P. Paulikas, 1989, Science 245, 731.
- Orenstein and Millis (2000) Orenstein, J., and A. J. Millis, 2000, Science 288, 468.
- Orgad et al. (2001) Orgad, D., S. A. Kivelson, E. W. Carlson, V. J. Emery, X. J. Zhou, and Z.-X. Shen, 2001, Phys. Rev. Lett. 86, 4362.
- Osterwalder et al. (1995) Osterwalder, J., P. Aebi, P. Schwaller, L. Schlapbach, M. Shimoda, T. Mochiku, and K. Kadowaki, 1995, Appl. Phys. A A60, 247.
- Patthey et al. (1990) Patthey, F., J.-M. Imer, W.-D. Schneider, H. Beck, Y. Baer, and B. Delley, 1990, Phys. Rev. B 42, 8864.
- Pendry (1975) Pendry, J. B., 1975, J. Phys. Solid State Phys. 8, 2413.
- Pendry (1976) Pendry, J. B., 1976, Surf. Sci. 57, 679.
- Petrov et al. (2000) Petrov, Y., T. Egami, R. J. McQueeney, M. Yethiraj, H. A. Mook, and F. Doan, 2000, eprint cond-mat/0003414.
- Pickett (1989) Pickett, W. E., 1989, Rev. Mod. Phys. 61, 433.
- Pines (1997) Pines, D., 1997, Zeit. Phys. B 103, 129.
- Pines and Nozires (1966) Pines, D., and P. Nozires, 1966, The Theory of Quantum Liquids, volume 1 (Benjamin, New York).
- Plummer and Eberhardt (1982) Plummer, E. W., and W. Eberhardt, 1982, in Advances in Chemical Physics, edited by I. Prigogine and S. A. Rice (John Wiley & Sons, New York), volume XLIV.
- Polturak et al. (1993) Polturak, E., G. Koren, D. Cohen, and E. Aharoni, 1993, Phys. Rev. B 47, 5270.
- Presland et al. (1991) Presland, M. R., J. L. Tallon, R. G. Buckley, R. S. Liu, and N. E. Flower, 1991, Physica C 176, 95.
- Preuss et al. (1995) Preuss, R., W. Hanke, and W. von der Linden, 1995, Phys. Rev. Lett. 75, 1344.
- Prozorov et al. (2000) Prozorov, R., R. W. Giannetta, P. Fournier, and R. L. Greene, 2000, Phys. Rev. Lett. 85, 3700.
- Puchkov et al. (1996) Puchkov, A. V., D. N. Basov, and T. Timusk, 1996, J. Phys. Cond. Matt. 8, 10049.
- Puchkov et al. (1998) Puchkov, A. V., Z.-X. Shen, T. Kimura, and Y. Tokura, 1998, Phys. Rev. B 58, 13322.
- Randeria and Campuzano (1997) Randeria, M., and J.-C. Campuzano, 1997, eprint cond-mat/9709107.
- Randeria et al. (1995) Randeria, M., H. Ding, J. C. Campuzano, A. Bellman, G. Jennings, T. Tokoya, T. Takahashi, H. Katayama-Yoshida, T. Mochiku, and K. Kadowaki, 1995, Phys. Rev. Lett. 74, 4951.
- Rao and Raveau (1995) Rao, C. N. R., and B. Raveau, 1995, Transition Metal Oxides (VCH Publishers, New York).
- Rickayzen (1991) Rickayzen, G., 1991, Green’s Functions and Condensed Matter in Techniques of Physics, volume Vol. 7 (Academic Press, London).
- Ronning et al. (1998) Ronning, F., C. Kim, D. L. Feng, D. S. Marshall, A. G. Loeser, L. L. Miller, J. N. Eckstein, L. Bozovic, and Z.-X. Shen, 1998, Science 282, 2067.
- Ronning et al. (2002a) Ronning, F., C. Kim, K. M. Shen, N. P. Armitage, A. Damascelli, D. H. Lu, D. L. Feng, Z.-X. Shen, L. L. Miller, Y.-J. Kim, F. Chou, and I. Terasaki, 2002a, preprint.
- Ronning et al. (2002b) Ronning, F., T. Sasagawa, Y. Kohsaka, K. M. Shen, A. Damascelli, C. Kim, T. Yoshida, N. P. Armitage, D. H. Lu, D. L. Feng, L. L. Miller, H. Takagi, et al., 2002b, preprint.
- Rossat-Mignod et al. (1991) Rossat-Mignod, J., L. P. Regnault, C. Vettier, P. Bourges, P. Burlet, J. Bossy, J. Y. Henry, and G. Lapertot, 1991, Physica C 185-189, 86.
- Rossnagel et al. (2001) Rossnagel, K., L. Kipp, M. Skibowski, C. Solterbeck, T. Strasser, W. Schattke, D. VoS, P. Krüger, A. Mazur, and J. Pollmann, 2001, Phys. Rev. B 63, 125104.
- Rotenberg et al. (2000) Rotenberg, E., J. Schaefer, and S. D. Keven, 2000, Phys. Rev. Lett. 84, 2925.
- Sachdev (2000) Sachdev, S., 2000, Science 288, 475.
- Sachdev and Ye (1992) Sachdev, S., and J. Ye, 1992, Phys. Rev. Lett. 69, 2411.
- Saini et al. (1997) Saini, N. L., J. Avila, A. Bianconi, A. Lanzara, M. C. Asensio, S. Tajima, G. D. Gu, and N. Koshizuka, 1997, Phys. Rev. Lett. 79, 3467.
- Saitoh et al. (1998) Saitoh, Y., T. Nakatani, T. Matsushita, T. Miyahara, M. Fujisawa, K. Soda, T. Muro, S. Ueda, H. Harada, A. Sekiyama, S. Imada, H. Daimon, et al., 1998, J. Synchrotron Rad. 5, 542.
- Salkola et al. (1996) Salkola, M. I., V. J. Emery, and S. A. Kivelson, 1996, Phys. Rev. Lett. 77, 155.
- Sato et al. (2001a) Sato, T., T. Kamiyama, Y. Naitoh, T. Takahashi, I. Chong, T. Terashima, and M. Takano, 2001a, Phys. Rev. B 63, 132502.
- Sato et al. (2001b) Sato, T., T. Kamiyama, T. Takahashi, K. Kurahashi, and K. Yamada, 2001b, Science 291, 1517.
- Sato et al. (2001c) Sato, T., T. Kamiyama, T. Takahashi, J. Mesot, A. Kaminski, J. C. Campuzano, H. M. Fretwell, T. Takeuchi, H. Ding, I. Chong, T. Terashima, and M. Takano, 2001c, Phys. Rev. B 64, 054502.
- Sato et al. (2001d) Sato, T., H. Matsui, S. Nishina, T. Takahashi, T. Fujii, T. Watanabe, and A. Matsuda, 2001d, eprint cond-mat/0108415.
- Sato et al. (1999) Sato, T., L. T. Yokoya, Y. Naitoh, T. Takahashi, K. Yamada, and Y. Endoh, 1999, Phys. Rev. Lett. 83, 2254.
- Sawatzky (1989) Sawatzky, G. A., 1989, Nature 342, 480.
- Scalapino (1969) Scalapino, D. J., 1969, in Superconductivity, edited by R. D. Park (Marcel Decker, New York), volume 1.
- Scalapino (1995) Scalapino, D. J., 1995, Phys. Rep. 250, 330.
- Schabel et al. (1997) Schabel, M. C., C.-H. Park, A. Matsuura, Z.-X. Shen, D. A. Bonn, R. Liang, and W. N. Hardy, 1997, Phys. Rev. B 55, 2796.
- Schabel et al. (1998b) Schabel, M. C., C.-H. Park, A. Matsuura, Z.-X. Shen, D. A. Bonn, R. Liang, and W. N. Hardy, 1998b, Phys. Rev. B 57, 6107.
- Schabel et al. (1998a) Schabel, M. C., C. H. Park, A. Matsuura, Z.-X. Shen, D. A. Bonn, R. X. Liang, and W. N. Hardy, 1998a, Phys. Rev. B 57, 6090.
- Schaich and Ashcroft (1971) Schaich, W. L., and N. W. Ashcroft, 1971, Phys. Rev. B 3, 2452.
- Schilling et al. (1993) Schilling, A., M. Cantoni, J. D. Guo, and H. R. Ott, 1993, Nature 363, 56.
- Schmalian et al. (1998) Schmalian, J., D. Pines, and B. Stojković, 1998, Phys. Rev. Lett. 80, 3839.
- Schrieffer (1964) Schrieffer, J. R., 1964, Theory of Superconductivity (Addison-Wesley, New York).
- Schwaller et al. (1995) Schwaller, P., P. Aebi, H. Berger, C. Beeli, J. Osterwalder, and L. Schlapbach, 1995, J. Electron Spectr. Relat. Phenom. 76, 127.
- Seah and Dench (1979) Seah, M. P., and W. A. Dench, 1979, Surf. Interface Anal. 1, 2.
- Sekiyama et al. (2000) Sekiyama, A., T. Iwasaki, K. Matsuda, Y. Saitoh, Y. Onuki, and S. Suga, 2000, Nature 403, 396.
- Senthil and Fisher (1999) Senthil, T., and M. P. A. Fisher, 1999, eprint cond-mat/9912380.
- Shen et al. (2001a) Shen, K. M., A. Damascelli, D. H. Lu, N. P. Armitage, F. Ronning, D. L. Feng, C. Kim, Z.-X. Shen, D. J. Singh, I. I. Mazin, S. Nakatsuji, Z. Q. Mao, et al., 2001a, Phys. Rev. B 64, 180502.
- Shen and Dessau (1995) Shen, Z.-X., and D. S. Dessau, 1995, Phys. Rep. 253, 1.
- Shen et al. (1993) Shen, Z.-X., D. S. Dessau, B. O. Wells, D. M. King, W. E. Spicer, A. J. Arko, D. Marshall, L. W. Lombardo, A. Kapitulnik, P. Dickinson, S. Doniach, J. DiCarlo, et al., 1993, Phys. Rev. Lett. 70, 1553.
- Shen et al. (1997) Shen, Z.-X., J. M. Harris, and A. G. Loeser, 1997, Hyperfine Interact. 105, 13.
- Shen et al. (2001b) Shen, Z.-X., A. Lanzara, S. Ishihara, and N. Nagaosa, 2001b, eprint cond-mat/0108381.
- Shen and Sawatzky (1999) Shen, Z.-X., and G. A. Sawatzky, 1999, Phys. Stat. Sol. B 215, 523.
- Shen and Schrieffer (1997) Shen, Z.-X., and J. R. Schrieffer, 1997, Phys. Rev. Lett. 78, 1771.
- Shen et al. (1998) Shen, Z.-X., P. J. White, D. L. Feng, C. Kim, G. D. Gu, H. Ikeda, R. Yoshizaki, and N. Koshizuka, 1998, Science 280, 259.
- Shirley (1972) Shirley, D. A., 1972, Phys. Rev. B 5, 4709.
- Siegbahn et al. (1969) Siegbahn, K., K. Siegbahn, C. Nordling, G. Johansson, J. Hedman, P. F. Heden, K. Hamrin, U. I. Gelius, T. Bergmark, L. O. Werme, R. Manne, and Y. Baer, 1969, ESCA Applied to Free Molecules (North Holland, Amsterdam).
- Singh (1995) Singh, D. J., 1995, Phys. Rev. B 52, 1358.
- Singh and Pickett (1995) Singh, D. J., and W. E. Pickett, 1995, Phys. Rev. B 51, 3128.
- Smith and Kevan (1991) Smith, K. E., and S. D. Kevan, 1991, Prog. Solid State Chem. 21, 49.
- Smith (1971) Smith, N. V., 1971, Crit. Rev. Solid State Sci. 2, 45.
- Smith and Himpsel (1983) Smith, N. V., and F. J. Himpsel, 1983, in Handbook on Synchrotron Radiation, edited by E.-E. Koch (North-Holland, Amsterdam), volume Ib.
- Smith et al. (1993) Smith, N. V., P. Thiry, and Y. Petroff, 1993, Phys. Rev. B 47, 15476.
- Sokol and Pines (1993) Sokol, A., and D. Pines, 1993, Phys. Rev. Lett. 71, 2813.
- Sonier et al. (2001) Sonier, J. E., J. H. Brewer, R. F. Kiefl, R. I. Miller, G. D. Morris, C. E. Stronach, J. S. Gardner, S. R. Dunsiger, D. A. Bonn, W. N. Hardy, R. Liang, and R. H. Heffner, 2001, Science 292, 1692.
- Sonier et al. (1999) Sonier, J. E., J. H. Brewer, R. F. Kiefl, G. D. Morris, R. I. Miller, D. A. Bonn, J. Chakhalian, R. H. Heffner, W. N. Hardy, and R. Liang, 1999, Phys. Rev. Lett. 83, 4156.
- Stadlober et al. (1995) Stadlober, B., G. Krug, R. Nemetschek, R. Hackl, J. L. Cobb, and J. T. Markert, 1995, Phys. Rev. Lett. 74, 4911.
- Steeneken (2001) Steeneken, P., 2001, preprint.
- Straub et al. (1997) Straub, T., R. Claessen, P. Steiner, S. Hüfner, V. Eyert, K. Friemelt, and E. Bucher, 1997, Phys. Rev. B 55, 13473.
- Strocov et al. (1998) Strocov, V. N., R. Claessen, G. Nicolay, S. Hüfner, A. Kimura, A. Harasawa, S. Shin, A. Kakizaki, P. O. Nilsson, H. I. Starnberg, and P. Blaha, 1998, Phys. Rev. Lett. 81, 4943.
- Strocov et al. (1997) Strocov, V. N., H. I. Starnberg, P. O. Nilsson, H. E. Brauer, and L. J. Holleboom, 1997, Phys. Rev. Lett. 79, 467.
- Sushkov et al. (1997) Sushkov, O. P., G. A. Sawatzky, R. Eder, and H. Eskes, 1997, Phys. Rev. B 56, 11769.
- Suzuki et al. (1998) Suzuki, T., T. Goto, K. Chiba, T. Shinoda, T. Fukase, H. Kimura, K. Yamada, M. Ohashi, and Y. Yamaguchi, 1998, Phys. Rev. B 57, 3229.
- Suzumura et al. (1988) Suzumura, Y., Y. Hasegawa, and H. Fukuyama, 1988, J. Phys. Soc. Jpn. 57, 2768.
- Takahashi et al. (1988) Takahashi, T., H. Matsuyama, H. Katayama-Yoshida, Y. Okabe, S. Hosoya, K. Seki, H. Fujimoto, M. Sata, and H. Inokuchi, 1988, Nature 334, 691.
- Takeuchi et al. (2001) Takeuchi, T., T. Yokoya, S. Shin, K. Jinno, M. Matsuura, T. Kondo, H. Ikuta, and U. Mizutani, 2001, J. Electron Spectr. Relat. Phenom. 114-116, 629.
- Tallon et al. (1995) Tallon, J. L., C. Bernhard, H. Shaked, R. L. Hitterman, and J. D. Jorgensen, 1995, Phys. Rev. B 51, 12911.
- Tallon and Loram (2001) Tallon, J. L., and J. W. Loram, 2001, Physica C 349, 53.
- Tallon et al. (1999) Tallon, J. L., J. W. Loram, G. V. M. Williams, J. R. Cooper, I. R. Fisher, J. D. Johnson, M. P. Staines, and C. Bernhard, 1999, Phys. Stat. Sol. B 215, 531.
- Tallon et al. (2000) Tallon, J. L., G. V. M. Williams, and J. W. Loram, 2000, Physica C 338, 9.
- Tanamoto et al. (1992) Tanamoto, T., H. Kohno, and H. Fukuyama, 1992, J. Phys. Soc. Jpn. 61, 1886.
- Tarascon et al. (1988) Tarascon, J. M., W. R. McKinnon, P. Barboux, D. M. Hwang, B. G. Bagley, L. H. Greene, G. W. Hull, Y. LePage, N. Stoffel, and M. Giroud, 1988, Phys. Rev. B 38, 8885.
- Testardi et al. (1974) Testardi, L. R., J. H. Wernick, and W. A. Royer, 1974, Solid State Commun. 15, 1.
- Tinkham (1996) Tinkham, M., 1996, Introduction to Superconductivity (McGraw-Hill, New York).
- Tjeng et al. (2001) Tjeng, L. H., N. B. Brookes, and B. Sinkovic, 2001, J. Electron Spectr. Relat. Phenom. 117-118, 189.
- Tohyama and Maekawa (2000) Tohyama, T., and S. Maekawa, 2000, Supercond. Sci. Technol. 13, R17.
- Tohyama et al. (1999) Tohyama, T., S. Nagai, Y. Shibata, and S. Maekawa, 1999, Phys. Rev. Lett. 82, 4910.
- Tohyama et al. (2000) Tohyama, T., Y. Shibata, S. Maekawa, Z.-X. Shen, N. Nagaosa, and L. L. Miller, 2000, J. Phys. Soc. Jpn. 69, 9.
- Tokura and Nagaosa (2000) Tokura, Y., and N. Nagaosa, 2000, Science 288, 462.
- Tranquada et al. (1995) Tranquada, J. M., B. J. Sternlieb, J. D. Axe, Y. Nakamura, and S. Uchida, 1995, Nature 375, 561.
- Tsuei and Kirtley (2000a) Tsuei, C. C., and J. R. Kirtley, 2000a, Rev. Mod. Phys. 72, 969.
- Tsuei and Kirtley (2000b) Tsuei, C. C., and J. R. Kirtley, 2000b, Phys. Rev. Lett. 85, 182.
- Tsvetkov et al. (1998) Tsvetkov, A. A., D. van der Marel, K. A. Moler, J. R. Kirtley, J. L. de Boer, A. Meetsma, Z. F. Ren, N. Koleshnikov, D. Dulić, A. Damascelli, M. Grüninger, J. Schützmann, et al., 1998, Nature 395, 360.
- Uemura et al. (1991) Uemura, Y. J., L. P. Le, G. M. Luke, B. J. Sternlieb, W. D. Wu, J. H. Brewer, T. M. Riseman, C. L. Seaman, M. B. Maple, M. Ishikawa, D. G. Hinks, J. D. Jorgensen, et al., 1991, Phys. Rev. Lett. 66, 2665.
- Valla et al. (1999a) Valla, T., A. V. Fedorov, P. D. Johnson, and S. L. Hulbert, 1999a, Phys. Rev. Lett. 83, 2085.
- Valla et al. (2000) Valla, T., A. V. Fedorov, P. D. Johnson, Q. Li, G. D. Gu, and N. Koshizuka, 2000, Phys. Rev. Lett. 85, 828.
- Valla et al. (1999b) Valla, T., A. V. Fedorov, P. D. Johnson, B. O. Wells, S. L. Hulbert, Q. Li, G. D. Gu, and N. Koshizuka, 1999b, Science 285, 2110.
- Varma (1997) Varma, C. M., 1997, Phys. Rev. B 55, 14554.
- Varma (1999) Varma, C. M., 1999, Phys. Rev. Lett. 83, 3538.
- Varma (2000) Varma, C. M., 2000, Phys. Rev. B 61, 3804.
- Varma et al. (1989) Varma, C. M., P. B. Littlewood, S. Schmitt-Rink, E. Abrahams, and A. E. Ruckenstein, 1989, Phys. Rev. Lett. 63, 1996.
- Varma et al. (1990) Varma, C. M., P. B. Littlewood, S. Schmitt-Rink, E. Abrahams, and A. E. Ruckenstein, 1990, Phys. Rev. Lett. 64, 497.
- Varma et al. (1987a) Varma, C. M., S. Schmitt-Rink, and E. Abrahams, 1987a, in Novel Mechanisms of Superconductivity, edited by S. A. Wolf and V. Z. Kresin (Plenum Press, New York), p. 355.
- Varma et al. (1987b) Varma, C. M., S. Schmitt-Rink, and E. Abrahams, 1987b, Solid State Commun. 62, 681.
- van Veenendaal et al. (1994) van Veenendaal, M. A., G. A. Sawatzky, and W. A. Groen, 1994, Phys. Rev. B 49, 1407.
- Venturini et al. (2002) Venturini, F., R. Hackl, and U. Michelucci, 2002, eprint cond-mat/0205415.
- Wang et al. (1990) Wang, S. H., Q. Song, B. P. Clayman, J. L. Peng, L. Zhang, and R. N. Shelton, 1990, Phys. Rev. Lett. 64, 1067.
- Wells et al. (1992) Wells, B. O., Z.-X. Shen, D. S. Dessau, W. E. Spicer, D. B. Mitzi, L. Lombardo, A. Kapitulnik, and A. J. Arko, 1992, Phys. Rev. B 46, 11830.
- Wells et al. (1995) Wells, B. O., Z.-X. Shen, A. Matsuura, D. M. King, M. A. Kastner, M. Greven, and R. J. Birgeneau, 1995, Phys. Rev. Lett. 74, 964.
- Wen and Lee (1996) Wen, X.-G., and P. A. Lee, 1996, Phys. Rev. Lett. 76, 503.
- Wendin (1981) Wendin, G., 1981, Breakdown of the One-Electron Pictures in Photoelectron Spectroscopy (Springer-Verlag, Berlin).
- Wenger and Östlund (1993) Wenger, F., and S. Östlund, 1993, Phys. Rev. B 47, 5977.
- Wertheim (1978) Wertheim, G., 1978, in Electron and Ion Spectroscopy of Solids, edited by L. Fiermans, J. Vennik, and W. Dekeyser (Plenum Press, New York).
- Weschke et al. (1991) Weschke, E., C. Laubschat, T. Simmons, M. Domke, O. Strebel, and G. Kaindl, 1991, Phys. Rev. B 44, 8304.
- White et al. (1999) White, P. J., Z.-X. Shen, D. L. Feng, C. Kim, M. Z. Hasan, J. M. Harris, A. G. Loeser, H. Ikeda, R. Yoshizaki, G. D. Gu, and N. Koshizuka, 1999, eprint cond-mat/9901349.
- White et al. (1996) White, P. J., Z.-X. Shen, C. Kim, J. M. Harris, A. G. Loeser, P. Fournier, and A. Kapitulnik, 1996, Phys. Rev. B 54, 15669.
- White and Scalapino (2000) White, S. R., and D. J. Scalapino, 2000, Phys. Rev. B 61, 6320.
- Williams et al. (1980) Williams, R. H., G. P. Srivastava, and I. T. McGovern, 1980, Rep. Prog. Phys. 43, 1357.
- Withers et al. (1988) Withers, R. L., J. S. Anderson, B. G. Hyde, J. G. Thompson, L. R. Wallenberg, J. D. FitzGerald, and A. M. Stewart, 1988, J. Phys. Solid State Phys. 21, L417.
- Won and Maki (1994) Won, H., and K. Maki, 1994, Phys. Rev. B 49, 1397.
- Wu et al. (1993) Wu, D. H., J. Mao, S. N. Mao, J. L. Peng, X. X. Xi, T. Venkatesan, R. L. Greene, and S. M. Anlage, 1993, Phys. Rev. Lett. 70, 85.
- Wu et al. (1987) Wu, M. K., J. R. Ashburn, C. J. Torng, P. H. Hor, R. L. Meng, L. Gao, Z. J. Huang, Y. Q. Wang, and C. W. Chu, 1987, Phys. Rev. Lett. 58, 908.
- Wu (2002) Wu, W. C., 2002, Phys. Rev. B 65, 052508.
- Xiang and Wheatley (1996) Xiang, T., and J. M. Wheatley, 1996, Phys. Rev. B 54, 12653.
- Xu et al. (1987) Xu, J.-H., T. J. Watson-Yang, J. Yu, and A. J. Freeman, 1987, Phys. Lett. A 120, 489.
- Yamada et al. (1995) Yamada, K., S. Wakimoto, G. Shirane, C. H. Lee, M. A. Kastner, S. Hosoya, M. Greven, Y. Endoh, and R. J. Birgeneau, 1995, Phys. Rev. Lett. 75, 1626.
- Yamamoto et al. (1990) Yamamoto, A., M. Onoda, E. Takayama-Muromachi, F. Izumi, T. Ishigaki, and H. Asano, 1990, Phys. Rev. B 42, 4228.
- Yeh and Lindau (1985) Yeh, J. J., and I. Lindau, 1985, Atom. Data Nucl. Data Tabl. 32, 1.
- Yokoya et al. (1996a) Yokoya, T., A. Chainani, T. Takahashi, H. Ding, J. C. Campuzano, H. Katayama-Yoshida, M. Kasai, and Y. Tokura, 1996a, Phys. Rev. B 54, 13311.
- Yokoya et al. (1996b) Yokoya, T., A. Chainani, T. Takahashi, H. Kayatama-Yoshida, M. Kasai, and Y. Tokura, 1996b, Phys. Rev. Lett. 76, 3009.
- Yokoya et al. (2000) Yokoya, T., T. Kiss, T. Watanabe, S. Shin, M. Nohara, H. Takagi, and T. Oguchi, 2000, Phys. Rev. Lett. 85, 4952.
- Yoshida (2001) Yoshida, T., 2001, Ph.D. Thesis (University of Tokyo, Japan).
- Yoshida et al. (2001) Yoshida, T., X. J. Zhou, M. Nakamura, S. A. Kellar, P. V. Bogdanov, E. D. Lu, A. Lanzara, Z. Hussain, A. Ino, T. Mizokawa, A. Fujimori, H. Eisaki, et al., 2001, Phys. Rev. B 63, 220501.
- Yoshida et al. (2002) Yoshida, T., X. J. Zhou, T. Sasagawa, W. L. Yang, P. V. Bogdanov, A. Lanzara, Z. Hussain, T. Mizokawa, A. Fujimori, H. Eisaki, Z.-X. Shen, T. Kakeshita, et al., 2002, eprint cond-mat/0206469.
- Yusof et al. (2002) Yusof, Z. M., B. O. Wells, T. Valla, A. V. Fedorov, P. D. Johnson, Q. Li, C. Kendziora, S. Jian, and D. G. Hinks, 2002, Phys. Rev. Lett. 88, 167006.
- Zaanen (1999) Zaanen, J., 1999, Science 286, 251.
- Zaanen and Gunnarsson (1989) Zaanen, J., and O. Gunnarsson, 1989, Phys. Rev. B 40, 7391.
- Zaanen et al. (1985) Zaanen, J., G. A. Sawatzky, and J. W. Allen, 1985, Phys. Rev. Lett. 55, 418.
- Zacher et al. (2000a) Zacher, M. G., R. Eder, E. Arrigoni, and W. Hanke, 2000a, Phys. Rev. Lett. 85, 2585.
- Zacher et al. (2000b) Zacher, M. G., W. Hanke, E. Arrigoni, and S.-C. Zhang, 2000b, Phys. Rev. Lett. 85, 824.
- Zhang and Rice (1988) Zhang, F. C., and T. M. Rice, 1988, Phys. Rev. B 37, 3759.
- Zhang (1997) Zhang, S.-C., 1997, Science 275, 1089.
- Zhou (2001) Zhou, X. J., 2001, preprint.
- Zhou et al. (1999) Zhou, X. J., P. Bogdanov, S. A. Kellar, T. Noda, H. Eisaki, S. Uchida, Z. Hussain, and Z.-X. Shen, 1999, Science 286, 268.
- Zhou et al. (2001) Zhou, X. J., T. Yoshida, S. A. Kellar, P. V. Bogdanov, E. D. Lu, A. Lanzara, M. Nakamura, T. Noda, T. Kakeshita, H. Eisaki, S. Uchida, A. Fujimori, et al., 2001, Phys. Rev. Lett. 86, 5578.