Statistics of the contact network in frictional and frictionless granular packings
Abstract
Simulated granular packings with different particle friction coefficient are examined. The distribution of the particle-particle and particle-wall normal and tangential contact forces are computed and compared with existing experimental data. Here is the contact force normalized by the average value . exhibits exponential-like decay at large forces, a plateau/peak near , with additional features at forces smaller than the average that depend on . Computations of the force-force spatial distribution function and the contact point radial distribution function indicate that correlations between forces are only weakly dependent on friction and decay rapidly beyond approximately three particle diameters. Distributions of the particle-particle contact angles show that the contact network is not isotropic and only weakly dependent on friction. High force-bearing structures, or force chains, do not play a dominant role in these three dimensional, unloaded packings.
pacs:
45.70.Cc,46.25.-y,83.80.FgI Introduction
The properties of granular materials, even static sandpiles, continue to perplex engineers and physicists alike [1]. Processing of granular materials play a central role in the pharmaceuticals industry as well as engineering communities, such as ceramic component design. For example, one may wish to evenly distribute the ingredients in a tablet or pill, or reduce the likelihood of component failure. However as yet there is no clear indication of how the individual particle properties determine the final state of the system.
Although packings of frictionless, monodisperse, cohesionless, hard spheres have been well studied [2], little is known about the effect of including particle friction. Recent discrete element simulations of granular materials, where packings were generated for particles for different static coefficients of friction between individual particle pairs, showed that the local particle coordination of the packing varied strongly as a function of friction [3]. From a different perspective, experimental studies of static granular assemblies have shown many interesting facets of the stress state of these systems. One method of analysis appears to dominate in describing the statistics of granular packings: computations of the distributions of normal forces are de rigeur.
Experimental studies on granular packings use a variety of techniques to measure the distribution of normal contact forces between particles and container walls [4, 5, 6, 7, 8, 9], where - all measured normal forces are normalized with respect to the average force . The Chicago group [4, 5, 6, 7] utilized carbon paper to measure at the base and sides of a cylindrical container packed with glass spheres with a normal load applied at the top of the packing. Forces several times the average force were observed, with resolution down to the weight of a few particles. Blair et al. [6] measured for amorphous and ordered granular packings for particles with different values of , which varied by a factor of approximately three. These experiments demonstrated that is indiscriminate towards the effects of particle friction and structure of the packing, and the general form of remained robust within the resolution of the experiment.
In a different experimental set up, Lvoll et al. [8] used a pressure transducer device to measure at the bottom of an unloaded granular packing under its own weight, on a fixed substrate of particles glued to the supporting base. This experiment was able to resolve forces down to the weight of a few grain masses and showed that the spatial distribution of contact forces were correlated over a few particle diameters. Using a novel modification of the carbon paper technique, Tsoungui et al. [9] actually measured inside the bulk of a 2D packing. Despite the poorer statistics of this study, the results agreed well with Blair et al. [6] and Lvoll et al. [8]. Experimental studies on static granular packings show that exhibits several generic features; an approximately exponential tail at large and a plateau or peak near .
Computational studies, such as contact dynamics or molecular dynamics, of compressed packings provide good comparison with the experimental data [10, 11]. However, as yet, there has been no systematic study of the effects of particle friction on the force distributions within a granular assembly. Here we show how the effects of friction change the behaviour of in the small force region but only weakly affect the large- region. We show that the local contact geometry of the packing is not isotropic and only weakly influenced by friction. We also discuss aspects of the force network whereby high force-bearing structures, or force chains, do not seem to be a dominant feature of these unloaded packings.
We computed in the bulk of various packings (which is presently inaccessible in 3D experiments) that had settled onto either a rough bed or a planar base. We compared these results with for particles in contact with the flat base (similar to experiment) of a periodic packing and with the generated at the side walls of a cylindrical packing. We resolve the components of the contact force that are normal () and tangential () to the line of centres between two particles in contact.
In the next section we briefly describe the model, though a more thorough description of the technique is available elsewhere [3, 12]. In section III, we present results for the force distributions, force correlations, and the contact geometry. We also discuss some aspects of the force network with respect to a force cut-off scheme, highlighting some pros and cons of this method. In section IV we summarize and conclude this work.
II Model and Method
We performed three dimensional (3D) molecular dynamics simulations with monodisperse, cohesionless, inelastic spheres that interact only on contact via a Hooke (linear) spring or a Hertz contact law and static friction [13, 14]. Contacting particles and positioned at and experience a relative normal compression , where , which results in a force . The normal and tangential contact forces are given by,
| (1) |
| (2) |
where , with , and are the normal and tangential components of the relative surface velocity, and and are elastic and viscoelastic constants respectively. for Hookean springs and for Hertzian contacts. is the elastic tangential displacement between spheres, obtained by integrating surface relative velocities during elastic deformation of the contact. The magnitude of is truncated as necessary to satisfy a local Coulomb yield criterion , where and , and is the particle-particle friction coefficient. For the present simulations we set , , . For Hookean springs we set while for Hertzian springs, . For Hookean springs the coefficient of restitution , is related to through,
where the collision time is determined by the contact frequency between two particles. For the parameters chosen, for Hookean springs. For Hertzian contacts is velocity dependent[15]. We chose a time-step , where and is the gravitational acceleration.
Amorphous packings (with packing fraction ) were generated by allowing an initially dilute system to settle under gravity acting in the vertical direction. Particles settled onto a bottom wall that was either a planar base or a bumpy bed of particles frozen into a close packed random configuration. This process was run until the kinetic energy of the system was much smaller than the potential energy [3]. The base had the same frictional and elastic properties as the particles being poured.
Most of our results are for packings that are spatially periodic in the horizontal plane, i.e. we ignored the effects of sidewalls. Because of this, the pressure in a packing does not saturate with depth. Therefore, to make a direct comparison with experiment, our definition of the average force , was normalized by , the average contact force at a depth in the packing. The generation of these packings is fully discussed in Ref. [3]. We also compared results for packings poured into a cylindrical container with ‘flat’ walls and the same properties as the particles. In this case, there is no need for depth-average normalisation, as the walls carry a significant fraction of the weight of the system [16]. Results for the periodic packings with depth-average normalisation are consistent with the cylindrically confined packings and experiment. As a consequence, the depth-average normalisation proves to be the correct method for dealing with periodic packings.
III Results
A Force Distributions
Force distributions in all granular packings exhibit several general features. Measurements of the distribution of normal contact forces , for granular packings that are either free-standing under the influence of gravity [8] (as we simulate here), confined packings that have been loaded (as in experiments) [4, 6, 9], or axially compressed systems (as in previous simulation studies and experiment) [10, 17, 18], as well as a lattice model [5], all purport exponential tails in at large forces (typically for ). Mueth et al. [4] used an empirical fit to their experimental data of the form,
| (3) |
and found , , and for loaded glass spheres confined in a cylindrical container.
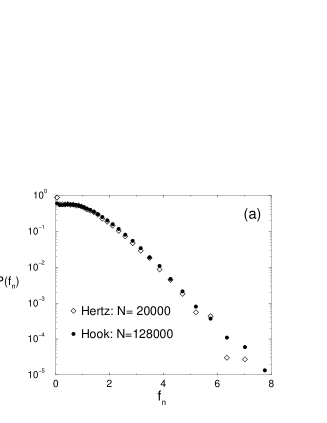
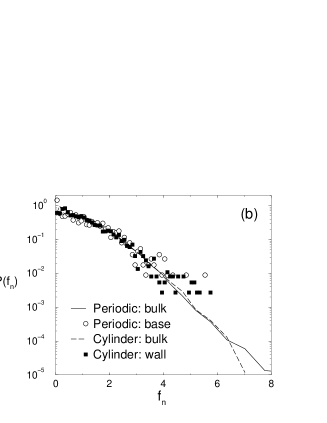
In Fig. 1 we show our computations of the force distributions for the normal contact force for different systems. In Fig. 1(a) we see that the form of is the same for both Hookean or Hertzian contact force laws. Varying the system size has no effect (other than improving the statistics of the data). Similarly, in Fig. 1(b) computations of in the bulk of a periodic or confined system, at the base of the periodic system, or at the sidewalls of the cylinder are indistinguishable. Recent 2D simulations have shown that at the base can depend on the properties and geometry of the base [19]. Computations of for those particles in contact with the flat base and at the side walls also show the generic form seen in the other data although the statistics here are poor due to the number of contacts in the plane () compared with the number of particle-particle contacts in the bulk ().
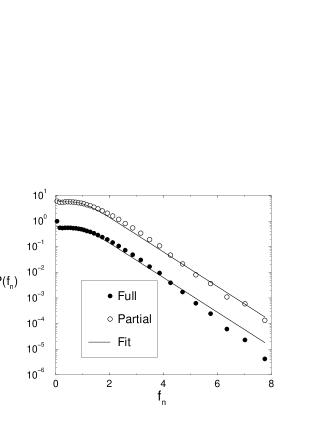
To compare with existing experimental data, we fit Eq. 3 to our data for the largest system. We show this comparison in Fig. 2. The computed over all contact forces is denoted by the solid circles in Fig. 2 with best fit parameters , , and , agreeing well with Eq. 3 up to , but falling off more quickly than Eq. 3 for large . We find a better fit to Eq. 3 if we exclude the data for , i.e. ignoring all data in the limit , essentially mimicking the finite resolution in experiment. This alters the average value such that our original data set has now been ‘squeezed’ together. We denote this data as the partial set in Fig. 2. The fit to Eq. 3 with , , and , is much better than when data for small forces is included. Our simulation data is in good qualitative and quantitative agreement with previous experimental results [4] and similar to Radjai et al. [10].
The empirical fit of Eq. 3 is poor for the total bulk over a large range of the data and we only achieve agreement by renormalising our data, using the partial data set in Fig. 2. We also note that on closer inspection of existing simulation and experimental data, whether the tails of are truly exponential or not is questionable and may be an indication of the averaging technique used in computational studies [20].
The distribution of tangential forces is shown in Fig. 3. In comparison with the normal forces, decays more slowly than . Fitting Eq. 3 to the bulk data for the largest system (), we find good agreement with , , and .

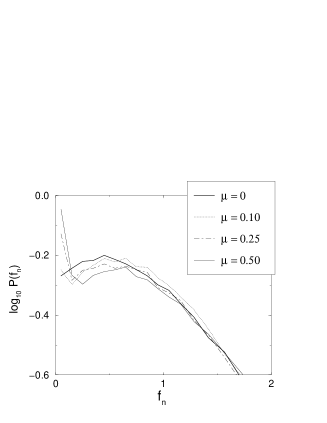
While there is clearly some agreement on the behaviour of for large , the characteristic nature of the small force region of remains in dispute. Experimental data show that approaches a finite value as . However, some numerical works have suggested that for small [21]. In Fig. 4 we show the small force region of for packings identically prepared but with different particle friction coefficients. We do not show the full curve as friction only weakly influences the behaviour of the large- region. However, our large system size data suggests that the exponential tail becomes slightly steeper with decreasing friction, i.e. increases as decreases. The defining feature of these packings is that for purely frictionless systems, shows a well-defined peak at small forces, while for , has an upturn at very small forces. The amplitude of this upturn increases with increasing friction coefficient.
The Chicago group [6] studied different particle packings where varied by a factor of approximately three. Within the resolution of their experiment they did not find any systematic trend with friction. Because of the higher resolution in simulation, the following comments are relevant to such studies: the fraction of particle-particle contacts, or bonds, experiencing small forces increases with increasing even though the total number of contacts decreases with increasing [3]. Further study shows that the fraction of particles that are close to the Coulomb yield criterion , i.e. those particle pairs that are most likely to undergo local plastic rearrangement, increase as . Indeed, we have previously reported [3] that frictionless packings are always isostatic, whereas frictional packings are hyperstatic and this may be related to the behaviour of at small .
For completeness we show the corresponding distributions , for the tangential forces in Fig. 5. In this case, we do not find any significant systematic trend with . The role of in the determination of , is subtle. In frictionless packings, does not show an upturn at small , therefore the generation of this upturn in frictional packings comes from the very presence of the frictional forces , which influence the nature of particle contacts such that itself observes an upturn at small forces.

B Force Correlations
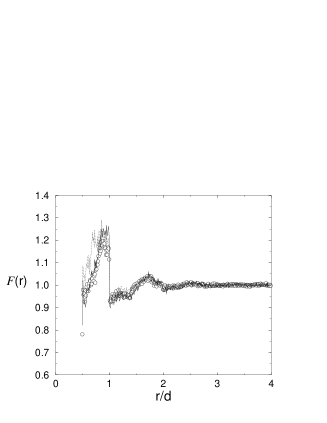
The spatial force-force correlation function measures spatial correlations between forces separated by a distance . We use the same definition as in Refs. [4, 8],
| (4) |
where is the distance between particle contacts and , and is the normalized contact force acting at contact . In experiment, spatial force correlations can, at present, only be measured at container walls: the points of force contact coincide with particle contacts at the container surface lying in a 2D plane. The minimum separation between measurements in experiment is coincident with the particle size, . In a 3D packing, contact forces transmitted at the points of particle-particle contacts are only restricted by excluded volume effects. For monodisperse spheres in 3D the minimum separation, . A locally four-particle pyramid configuration would give this minimum separation. Mueth et al. [4] found no evidence for spatial correlations between the contact forces within the resolution of their measurements. Lvoll et al. [8], using a different measuring technique, resolved their force data showing weak force correlations at the base of their packings which extend out to approximately five particle diameters [8]. This may only come about from the induced order of the sample at the container wall.
Because of the restricted geometry of experimental measurements, we found it instructive to compare our computations of for the normal contact forces within the bulk of amorphous packings, and see how these might depend on . For comparison we also computed the correlation function between tangential contact forces for . In Fig. 6 we present the spatial force correlation function for a frictionless packing () and a frictional packing (). Within the bulk of the packing, forces are correlated, but only over short distances, extending to less than three particle diameters in the bulk, indicative of the diffuse nature of the force transmission network. However, the effect of friction on these correlations is very weak, with the frictional packing exhibiting only a very slight increase in local correlation.
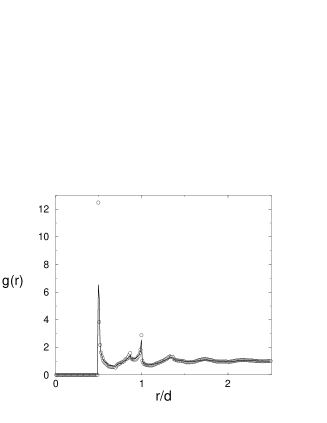
Similar to Mueth et al. [4], in Fig. 7 we also show the radial distribution function , between contact points inside the bulk of a frictionless () and a frictional packing (). Clearly, the frictionless packing has a higher first peak, representative of the higher coordination of the frictionless packing compared with the frictional one [3], and also local correlations between the positions of the contact points are stronger in the case of the zero friction packing indicating a more ordered distribution of contact points in the system.
C Contact Geometry
We have so far shown that computations of for various particle parameters yield essentially the same data, except for small . It is ironic then, that although the generic features of are a signature of the granularity of the system, it offers little distinctive information on the grain-level properties of the packing. Keeping in the spirit of particle pair information, in Fig. 8 we show the probability distributions for particle-particle contact angles defined in the local spherical coordinate system that bonds make with respect to the vertical (parallel to gravity direction). In Fig. 8 we compare packings with different (=0, 0.1, 0.5) and found that the distribution of contact angles has only a weak dependence on friction indicating that all the systems locally appear similar. In all cases, the majority of contact angles lie in the range .

It is a simple exercise to further compute only between particles that carry a large force, i.e. to identify or distinguish between “weak” and “strong” forces, as Radjai and co-workers have done for compressed systems [11, 22]. In Fig. 9, we compare computed between all contacting particle pairs and computed for the subset of particles in contact whose normal contact force , where is some given threshold value. Here we set , i.e. all particles whose normal contact force is greater than the twice the average. Resolving the contact angle distribution according to a force cut-off as in Fig. 9 reveals that high force-bearing clusters are more directional and the anisotropy grows with increasing (not shown here).

D Contact Network
The existence of heterogeneous force networks is supported by experimental visualisation. Photoelastic particle packings [23] or piles subject to local force perturbations [24, 25], demonstrate inhomogeneity in the magnitude of the forces propagating through granular assemblies - “force chains”. However, it is still not clear how relevant these structures are in determining the stress state of the system. The 2D simulations of Radjai et al. [11] suggested for compressed granular packings, a distinction can be made between the “strong” force network, those particles in contact that carry a force greater than the average normal contact force, and the “weak” force network, the network of particles that experience a force smaller than the average. In some theoretical approaches, the strong force network is assumed to support all the stress in the system, with the weak force network acting merely as a supporting framework to this which can essentially be neglected [26].
To investigate the relative importance of the force networks, we computed the normal force that sub-networks of force chains contribute to the bulk average contact normal force. In Fig. 10, we varied and then computed the fraction of bonds remaining in the force network whose contact force was greater than (‘strong’ force network), and computed the contribution that this network made to the average force. The computation of the relative force network contributions in Fig. 10 indicates only a weak distinction between the ‘strong’ force network for particle contacts with , and a weak force network with , say. Therefore it is questionable whether the so-called strong network actually does carry most, if not all, of the stress in the system. For example, by going from one curve to the other as indicated by the arrow in Fig. 10, we find of contacts contribute approximately to the average contact force. This is a small distinction, and not nearly an order of magnitude difference between the two networks that one might expect if the strong forces dominated the weak phase.

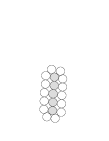
A related question is the stability of the relative networks. The concept of fragility [27] suggests in the limit one can clearly distinguish the strong network from the weak network, the strong phase should be a minimally coordinated, particle network. For a 3D frictional packing this suggests a coordination number [28]. To calculate the network-averaged coordination number of a subset of particles, the contacting neighbours of the chosen network need to be included. In Fig. 11 we draw a schematic for determining the coordination number given a sub-network of particles (denoted by the grey particles), knowing the list of network neighbours (white particles).
Computation of the coordination number for packings with different , over a range of cut-off values is shown in Fig. 12. The network-averaged coordination number of particle clusters, based on the forces that they carry, decreases monotonically from the bulk averaged coordination to approximately . It appears that , represents some limit in the system in the sense that for , the average size of particle clusters contributing are particle pairs, i.e. the largest cluster that propagates large forces is only of size two.

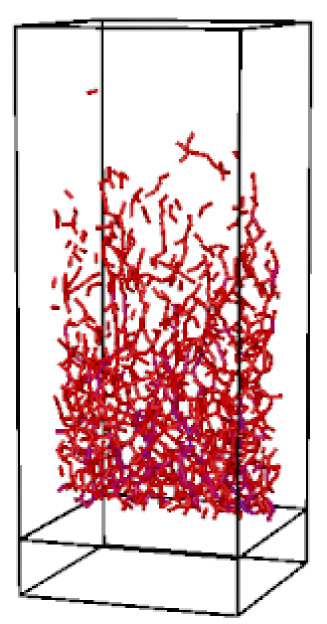
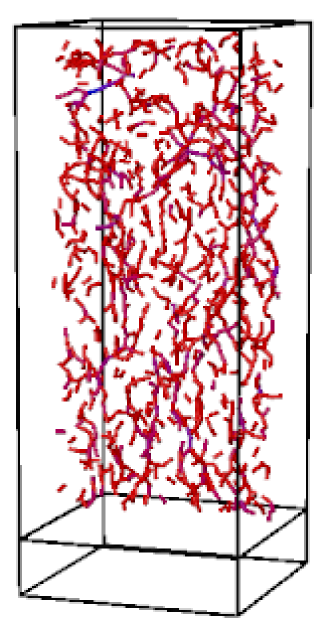
Additionally, we provide examples of force network realizations. In Fig. 13 we show two force network configurations of a slice approximately four particle diameters thick taken from the centre of the large, frictional, periodic system ( and ). We only show bonds whose force is greater than twice the average. Figure 13(a) is the force network for the absolute normal contact forces F without depth normalisation for . This corresponds to a section through the middle of a wide sandpile. Figure 13(a) can be compared to the 2D experimental realization in Refs. [23, 29]. If we show all bonds, the force network is dense with many weak forces. This may be an indication of the relative sensitivity of the experimental visualisation technique which clearly cannot resolve the smallest forces. The number of large forces increases with depth giving a clear indication of the propagation of weight down the pile.
Figure 13(b) is the force network for the depth-normalized normal contact forces with . We find similar configurations for the cylindrically confined packing. Therefore this is the equivalent force network for a confined, frictional, unloaded packing. Because of the weight of the particles have been renormalized out of the force (mimicking walls that support forces), forces of all magnitudes are seen throughout the pack. In both cases, we find that extended force-bearing structures exist over a range of length scales, but do not necessarily transmit the largest forces only.
IV Conclusions
We have demonstrated that large scale simulations of granular packings offer insight into the effects of particle friction on measurements of the distribution of particle-particle and particle-wall contact forces . Our detailed comparison between simulation and empirical fits, obtained from experiments [4], showed moderate agreement. However, we were only able to fit our data over the full range in after renormalising our data by neglecting the smallest forces in the system (using the partial data set). We reason that this is an appropriate way to account for the limited resolution in experiment. We also reiterate the fact that many simulation and numerical studies of force distributions do not show a clear exponential tail either at large and we believe this may partly be due to the resolution of very small forces in such computer experiments that affect the total normalisation parameters.
We were able to discern the influence that friction plays on in the small force region. The fraction of particle-particle contacts that experience very small forces increases with friction even though the total number of contacts decreases with increasing [3]. Excluded volume effects rather than the functional form of the force law appear to dominate the bulk behaviour of the system for dense packings. Our studies of very large systems show that the tails of become marginally steeper with decreasing friction, i.e. in Eq. 3 increases as decreases. Our ongoing work on simulating confined packings will investigate some of these issues further [16].
The force-force spatial distribution function and contact point radial distribution function indicate that spatial correlations between the contact forces and the positions of the contact extends out only to approximately three particle diameters. This shows that force correlations dissipate quickly in the bulk and that the force transmission network propagates locally but becomes diffuse rapidly. On introducing a force cut-off scheme to analyse force-bearing structures, we found no clear evidence for distinct ‘weak’ and ‘strong’ force phases.
In general this discussion was only concerned with unloaded or unperturbed amorphous granular packings. In this sense we have provided information on the “reference state” of a granular material from a microstructural point of view. This state is rather insensitive to friction and is primarily determined by construction history [30]. Although we have not investigated the perturbed state or response function of these systems [24], it is likely that particle properties play a much more significant role in the response of a granular system than in the static state. Some theoretical treatments [26, 31] on force chain analysis may benefit from the information of this unperturbed system when calculating the resulting response of such a system under some force perturbation. In fact, the contact angle distribution in Fig. 8 seems to suggest that the ‘splitting angle’ , in the language of Ref. [31], does seem lie predominantly in the range . Comparing the experimental visualisation in Ref. [24] and the theoretical model in Ref. [31], the force chain analysis can be thought of as a superposition of force chains on top of the background force network.
This work was supported by the Division of Materials Science and Engineering, Office of Science, U.S. Department of Energy. This collaboration was performed under the auspices of the DOE Center of Excellence for the Synthesis and Processing of Advanced Materials. Sandia is a multiprogram laboratory operated by Sandia Corporation, a Lockheed Martin Company, for the United States Department of Energy under Contract DE-AC04-94AL85000.
REFERENCES
- [1] H. M. Jaeger and S. R. Nagel, Science 255, 1523 (1992).
- [2] A. S. Clarke and H. Jonsson, Phys. Rev. E 47, 3975 (1993); R. Jullien, P. Jund, and D. Caprion, Phys. Rev. E 54, 6035 (1996); S. Torquato and F. H. Stillinger, J. Phys. Chem. B 105, 11849 (2001).
- [3] L. E. Silbert, D. Ertaş, G. S. Grest, T. C. Halsey, and D. Levine, Phys. Rev. E 65, 031304 (2002).
- [4] D. M. Mueth, H. M. Jaeger, and S. R. Nagel, Phys. Rev. E 57, 3164 (1998).
- [5] S. N. Coppersmith, C. h. Liu, S. Majumdar, O. Narayan, and T. A. Witten, Phys. Rev. E 53, 4673 (1996).
- [6] D. L. Blair, N. W. Mueggenburg, A. H. Marshall, H. M. Jaeger, and S. R. Nagel, Phys. Rev. E 63, 041304 (2001).
- [7] N. W. Mueggenburg, H. M. Jaeger, and S. R. Nagel, cond-mat/0204533 (unpublished).
- [8] G. Lvoll, K. J. Mȧly, and E. G. Flekky, Phys. Rev. E 60, 5872 (1999).
- [9] O. Tsoungui, D. Vallet, and J.-C. Charmet, Gran. Matter 1, 65 (1998).
- [10] F. Radjai, M. Jean, J.-J. Moreau, and S. Roux, Phys. Rev. Lett. 77, 274 (1996).
- [11] F. Radjai, D. E. Wolf, M. Jean, and J.-J. Moreau, Phys. Rev. Lett. 80, 61 (1998).
- [12] L. E. Silbert, D. Ertaş, G. S. Grest, T. C. Halsey, D. Levine, and S. J. Plimpton, Phys. Rev. E 64, 051302 (2001).
- [13] P. A. Cundall and O. D. L. Strack, Gotechnique 29, 47 (1979).
- [14] O. R. Walton, Mech. Mat. 16, 239 (1993).
- [15] J. Schafer, S. Dippel, and D. E. Wolf, J. Phys. I France 6, 5 (1996).
- [16] J. W. Landry, L. E. Silbert, G. S. Grest, and S. J. Plimpton, in preparation (unpublished).
- [17] F. Radjai, S. Roux, and J. J. Moreau, Chaos 9, 544 (1999).
- [18] C. Thornton, Kona Powder and Particle 15, 81 (1997).
- [19] J. H. Snoeijer, M. van Hecke, E. Somfai, and W. van Saarloos, cond-mat/0204277 (unpublished).
- [20] C. S. O’Hern, S. A. Langer, A. J. Liu, and S. R. Nagel, Phys. Rev. Lett. 88, 075507 (2002).
- [21] C. h. Liu, S. R. Nagel, D. A. Schecter, S. N. Coppersmith, S. Majumdar, O. Narayan, and T. A. Witten, Science 269, 513 (1995).
- [22] F. Radjai and D. E. Wolf, Gran. Matter 1, 3 (1998).
- [23] L. Vanel, D. Howell, D. Clark, R. P. Behringer, and E. Clement, Phys. Rev. E 60, R5040 (1999).
- [24] J. G. Geng, D. W. Howell, E. Longhi, R. P. Behringer, G. Reydellet, L. Vanel, and E. Clement, Phys. Rev. Lett. 87, 035506 (2001).
- [25] T. Aste, T. DiMatteo, and E. G. d’Agliano, J. Phys.:Condens. Matter 14, 2391 (2002).
- [26] J. E. S. Socolar, D. G. Schaeffer, and P. Claudin, Eur. Phys. J. E 7, 353 (2002).
- [27] M. E. Cates, J. P. Wittmer, J.-P. Bouchaud, and P. Claudin, Phys. Rev. Lett. 81, 1841 (1998).
- [28] S. F. Edwards, Physica A 249, 226–231 (1998).
- [29] J. G. Geng, E. Longhi, R. P. Behringer, and D. W. Howell, Phys. Rev. E 64, 060301 (2001).
- [30] J. P. Wittmer, M. E. Cates, and P. Claudin, J. Phys. I France 7, 39 (1997).
- [31] J.-P. Bouchaud, P. Claudin, D. Levine, and M. Otto, Eur. Phys. J. E 4, 451 (2001).