Cytoskeleton confinement of red blood cell membrane fluctuations
Abstract
We analyze both the static and dynamic fluctuation spectrum of the red-blood cell in a unified manner, using a simple model of the composite membrane. In this model, the two-dimensional spectrin network that forms the cytoskeleton is treated as a rigid shell which is located at some constant average separation from the lipid bilayer. The cytoskeleton thereby confines both the static and dynamic fluctuations of the lipid bilayer. The predictions of the model account for the wavevector and frequency dependence of the experimental data. The observed amplitude of the thermal fluctuations is related to effects of ATP-driven fluctuations.
A long-standing problem in the study of red blood cell (RBC) structure is the simultaneous softness of its membrane observed by thermal fluctuations sackman95 , and the strong shear elasticity found in static deformation experiments, such as micropipette aspiration pipette and electrodeformation sackman84 . The membrane itself is a composite structure sackman94 with an outer, gel-like extracellular network of long sugar molecules (thought to be irrelevant to the structural strength), a mixed lipid/protein bilayer and an attached, intracellular network. Previous theoretical models of this membrane treated it as a single, polymerized network with the combined curvature bending modulus of the lipid bilayer and the shear rigidity of the cytoskeleton peterson92 . Such models were successful in describing the response of the membrane in static deformation experiments, which give J/m2 pipette ; sackman84 ; discher01 . However, comparing these models to the fluctuation data, leads to the conclusion that the membrane behaves as if the shear modulus vanishes brochard ; peterson92 . This surprising conclusion comes from the shape and amplitude analysis of the longest wavelength shape fluctuations sackman92 ; sackman95 . Various ideas have been raised in order to account for this observation, the main suggestion being that ATP-driven structural rearrangement in the spectrin network discher01 ; sackman94 ; sackman95 relaxes the shear-like deformations.
The previous studies were concerned with the shape fluctuations of largest wavelength. Here, we focus on the fluctuation spectrum, at the length-scales of m, where the effect of the cytoskeleton is observed sackman87 . The important question is to what extent the cytoskeleton effects are distinguishable from the fluctuations of a free, closed bilayer. We show that for a consistent description of both the static and the dynamic fluctuation spectrum we must include the confining effects of the cytoskeleton. A simple model where the only significant effect of the spectrin network is to confine the lipid bilayer membrane, consistently describes both the spatial and temporal spectra of the thermal fluctuations of the RBC membrane. We discuss how active processes that effectively increase the temperature of the membrane, can be accounted for within this description.
The curvature bending modulus of the lipid bilayer seifert is deduced from measurements of the amplitude of thermal fluctuations at the smallest measured wavelengths sackman87 J. The RBC cytoskeleton is a two-dimensional, roughly triangular, network of spectrin proteins bennett , that is attached to the lipid bilayer at the nodes and at additional, random sites along the spectrin polymers. The cytoskeleton is well described as a network of entropic springs, of length nm bennett ; sackmangreenbook , with an effective spring constant: J/m2, which is close to the measured static shear modulus: J/m2 pipette . Compared with the lipid bilayer bending modulus , the curvature bending modulus of the cytoskeleton is negligible sackman95 ; landaumcdonald01discher98 : J for a cytoskeleton thickness of Å.
We now begin by analyzing the measured spatial correlations of the fluctuations sackman87 , and describe the effects of the cytoskeleton on the bilayer in terms of continuum mechanics. This is feasible since the cytoskeleton forms a rather open mesh that is attached to the bilayer at discrete points with a contact area that is small (nm) compared to the inter-node distance (nm). In a coarse grained picture, we can describe the thermal fluctuations of the bilayer using a continuum model of the free energy functional
| (1) |
that includes the bending and effective surface tension energy of the bilayer (see for example safran ) in terms of the normal displacement . The surface tension coefficient arises from the constraint of constant surface area of the bilayer in the closed geometry of the RBC sackman97 ; seifert : J/m2 (taking m as the RBC radius, ). The constant can vary .
The last term in (1) is mathematically equivalent to a Lagrange multiplier that constrains the mean square amplitude of bilayer fluctuations to be equal to: , for an infinite bilayer. This term describes the effect of the cytoskeleton on the bilayer through a harmonic potential that maintains an average separation (of order ) between the lipid bilayer and the cytoskeleton safran , here treated as a separated, infinitely rigid shell, that does not participate in the thermal fluctuations. The discrete contacts that maintain the constant average separation are not specifically described in this continuum model; in a coarse-grained picture, these contacts are the physical origin of the constraint (potential) that determines the average membrane-spectrin network separation.
The attachment of the cytoskeleton to the bilayer also causes stretching and undulations of the bilayer sackman90 , partly due to steric repulsion between the spectrin and the bilayer around the point of attachment lipowsky . Balancing the spectrin stretching with a local curvature of the bilayer, results in a membrane with undulations of wavelength sackman90 ; steric nm and amplitude nm() sackman95 ; landaumcdonald01discher98 . In our confining-shell model this length-scale is related to the potential-induced persistence length of the bilayer safran , i.e. the wavelength below which the bilayer is freely fluctuating.
We now calculate the spatial correlations for a two-dimensional, flat bilayer, since for all but the largest wavelengths , the surface of the RBC is relatively flat: m. We determine the values of and by fitting to the experimental data. From Eq. (1) the equal-time (static) correlations of the normal deflections of the bilayer can be written safran ; sackman92
| (2) |
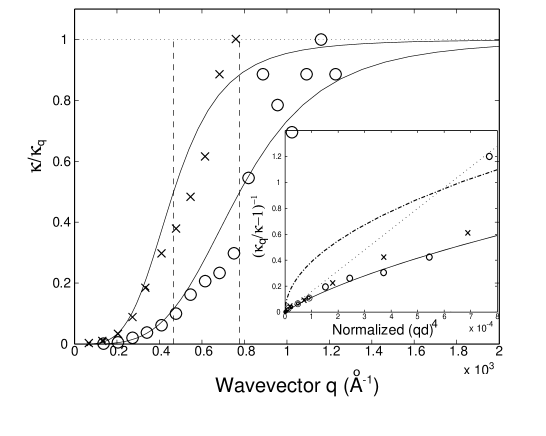
In the inset of Fig.1 we plot the measured value of sackman87 in the form as a function of the normalized wavevector (where is determined by fitting the data to obtain ). From the linear slope in the limit of we find the values of the parameter J/m4, for the two cells measured. These values correspond to mean amplitudes Å and nm respectively. At larger values of there is a noticeable deviation from a straight line, which arises from the effective surface tension J/m2 for the two cells. Note that surface tension alone, without the confining effect of the cytoskeleton (i.e. ), does not fit the data (dash-dot line, Fig.1 inset). In addition, there is a rather abrupt change at the crossover wavevector (indicated by the vertical dashed lines in Fig.1), above which the data are better described using J/m2 (solid lines in Fig.1).
The measured surface tension is consistent with: (of order ). This expression gives the effect of bilayer shape constraint due to the static undulations of lateral size , described above. Indeed at length-scales shorter then , there is no stretching of the cytoskeleton (Fig.1). Note that the effective surface tension of a closed bilayer is a very sensitive function of the excess area of the bilayer seifert ; sens , which is affected by the induced undulations. The spread in the measured parameters may be due to natural variations in the cytoskeleton network of normal RBC cells.
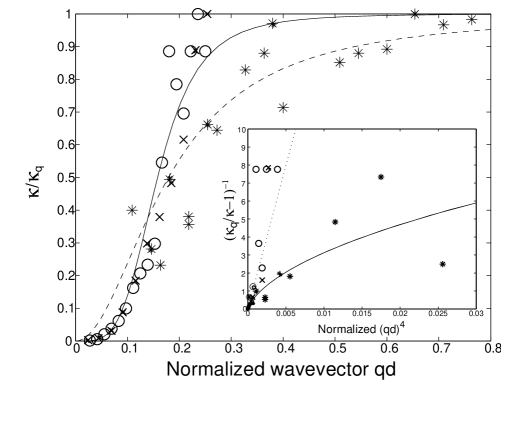
There is a qualitative difference in power-law of the wavevector dependence of for RBC and empty vesicles sackman97 . The vesicles are well described (Fig.2) by equations (1,2) with , and an effective surface tension: J/m2, where m and J are the vesicle radius and bending modulus respectively. Both the RBC’s and vesicles data collapse when the wavelength is scaled by the r.m.s amplitude (Fig.2). For the vesicles of diameter m sackman97 the r.m.s. thermal amplitudes are m (note that here is not related to confinement). The good scaling of the data indicates that there is indeed a single important length-scale in the problem, namely the persistence length , that determines all the parameters appearing in the free energy ( and ) and the r.m.s amplitude .
We now use the same simple model of spectrin confinement of the bilayer to describe the temporal correlations of the membrane fluctuations. The shape fluctuations of the RBC membrane are driven by both thermal and metabolic energies. The active fluctuations have a frequency spectrum that is confined to the range 0.3-1Hz atprafi . For higher frequencies, our analysis shows that the active processes can be accounted for by an increase in the effective temperature of the fluctuations atprafi ; prost . The temporal height-height correlation function brochard ; anton for a flat bilayer at a distance from a rigid wall, is
| (3) |
where is given in (2). The hydrodynamic interaction (Oseen interaction kernel landauhyd ) has a modified form: ( for a free bilayer), so that the relaxation frequency is
| (4) |
where is some average viscosity of the cytoplasm and external solution. In the limit of short wavelengths () we recover the free bilayer frequency: .
The mean square amplitude of the normal fluctuations, as a function of frequency , is the Fourier transform
| (5) | |||||
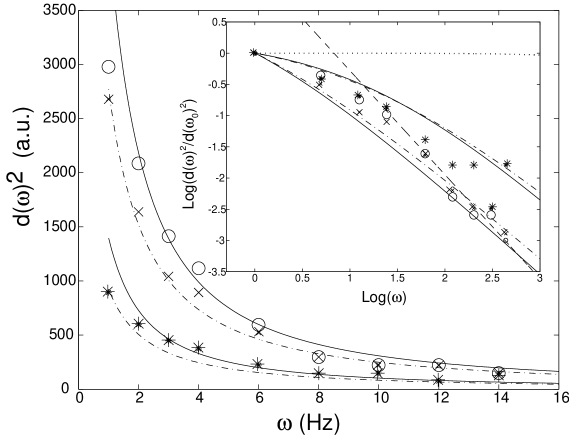
For a free bilayer this expression (5) gives an anomalous frequency dependence anton : . We integrate the expression (5) numerically in the range (Å), and compare with the experimental data atprafi . In the inset of Fig.3 we plot using the parameters of the two cells of Fig.1, and both the high and low values of the effective surface tension ( and respectively). We find a reasonable agreement between the calculation and the measurements, when taking . The similar magnitude of the bilayer-rigid shell separation from both static and dynamic experiments, shows the overall consistency of our confinement model.
In the limit of high frequencies, the earlier result of Brochard et.al. brochard , gave . Since in the measured range, we find in this limit (4): , leading to . It is difficult to distinguish between these two values using the newer data atprafi . Our calculation has the advantage of consistently describing both the static (spatial) and dynamic (temporal) fluctuation data. Note that the case of a pure bilayer with large effective surface tension , but without the effect of the rigid wall, is in complete disagreement with the data (dotted line, Fig.3 inset).
In Fig.3 we show that the normal RBC, ATP depleted RBC and RBC ghost, are all well described by the same expression (5) (using the softer cell from Fig.1, i.e. the smaller and ), differing by an effective temperature factor of up to . This is similar to the amplitude enhancement factor of found in a previous study prost .
The largest effect of the rigid shell is to increase the effective viscosity of the water near the bilayer, by constraining its flow. Defining an effective viscosity by: , we get from (4): . At the crossover wavevector this function has its peak: , depending on the value of . These values are in close agreement with the value found from the relaxation times of an electrodeformed RBC peterson92 ; sackman84 . In these experiments, the cytoplasm flows through the cytoskeleton mesh, setting up a flow field at the crossover wavevector . Thus, a rigid cytoskeletal wall, separated by a fixed distance from the bilayer, accounts for the larger effective viscosity required to fit these dynamical experiments.
While this model accounts for the wavevector dependence of the statics and the frequency dependence of the dynamics, the absolute amplitude of the fluctuations and the different values observed in active and ATP-depleted cells, must still be explained. One possibility is that ATP driven fluctuations completely determine the amplitude of the largest wavelength fluctuations atprafi through the process of spectrin-actin disconnections and reconnections atprafi ; sackman95 ; bennett . These ATP-driven conformational changes give rise to defects in the triangular spectrin network, resulting in nodes with more or less than 6 spectrin bonds. The local curvature of the cytoskeleton may change at the site of a defect, from being locally flat (6 bonds) to having a nm deviation out of the plane of the flat cytoskeleton (5-fold node). The effect of this random buckling is to increase the mean bilayer-rigid shell separation by a factor of . According to our model, this will increase the amplitude of the modes by a factor of , as measured peterson92 .
Acknowledgements.
We thank R. Korenstein, E. Sackmann and H. Strey for useful discussions. This work was supported by the ISF grant for Center on Self-Assembly. The authors are grateful to the donors of the Petroleum Research Fund administered by the American Chemical Society and to the Schmidt Minerva Center for their support. N.G.’s research is being supported by the Louis L. and Anita M. Perlman Postdoctoral Fellowship.References
- (1) H. Strey, M. Peterson and E. Sackmann, Biophys. J. 69 (1995) 478.
- (2) D. Discher, N. Mohandas and E.A. Evans, Science 266 (1994) 1032; V. Heinrich, K. Ritchie, N. Mohandas, and E. Evans, Biophys J 81 (2001) 1452.
- (3) H. Engelhardt, H. Gaub and E. Sackmann, Nature 307 (1984) 378.
- (4) E. Sackmann, FEBS Letters 346 (1994) 3.
- (5) M.A. Peterson, Phys. Rev. A 45 (1992) 4116.
- (6) J.C-M Lee and D.E. Discher, Biophys. J. 81 (2001) 3178.
- (7) F. Brochard and J.F. Lennon, J. de Physique 36 (1975) 1035.
- (8) M. Peterson, H. Strey and E. Sackmann, J. Phys. II France 2 (1992) 1273.
- (9) A. Zilker, H. Engelhardt and E. Sackmann, J. de Physique 48 (1987) 2139.
- (10) U. Seifert and R. Lipowsky, Structure and Dynamics of Membranes,Vol.1A,p.403,Eds: R. Lipowsky and E. Sackmann, Elsevier (1995).
- (11) V. bennett, Bioch. Biophys. Acta 988 (1989) 107.
- (12) E. Sackmann, Structure and Dynamics of Membranes,Vol.1A,p.1,Eds: R. Lipowsky and E. Sackmann, Elsevier (1995).
- (13) L.D. Landau and E.M. Lifshitz, Theory of Elasticity, Pergamon Press (1981); A.H. Swihart, J.M. Mikrut, J.B. Ketterson and R.C. Macdonald, J. Microscopy 204 (2001) 212; S.K. Boey, D.H. Boal and D.E. Discher, Biophys. J. 75 (1998) 1573.
- (14) S.A. Safran, Statistical Thermodynamics of Surfaces, Interfaces and Membranes,Frontiers in physics v.90, Addison-Wesley Publishing Company (1994).
- (15) W. Hackl, U. Seifert and E. Sackmann, J. Phys. II France 7 (1997) 1141.
- (16) K. Zeman, H. Engelhardt and E. Sackmann, Euro. Biophys. J. 18 (1990) 203.
- (17) M. Breidenich, R.R. Netz and R. Lipowsky, Europhys. Lett. 49 (2000) 431; R. Lipowsky, H-G. Dobereiner, C. Hiergeist and V. Indrani, Physica A 249 (1998) 536.
- (18) Another way to derive the amplitude of the spontaneous bilayer undulations is to compare the steric repulsion of the bilayer thermal fluctuations per area with the areal modulus of the cytoskeleton: nm [see J.O. Radler, T.J. Feder, H.H. Strey and E. Sackmann, Phys. Rev. E. 51 (1995) 4526].
- (19) P.Sens and S.A. Safran, Europhys. Lett. 43 (1998) 95.
- (20) S. Tuvia, S. Levin, A. Bitler and R. Korenstein, J. of Cell Bio. 141 (1998) 1551; S. Levin and R. Korenstein, Biophys. J. 60 (1991) 733.
- (21) J.-B. Manneville, P. Bassereau, D. Levy and J. Prost, Phys. Rev. Lett. 82 (1999) 4356.
- (22) A.G. Zilman and R. Granek, Phys. Rev. Lett. 77 (1996) 4788.
- (23) L.D. Landau and E.M. Lifshitz, Fluid Mechanics , Pergamon Press (1987); A. Zilman and R. Granek, in preparation.