COLE-COLE ANALYSIS OF THE SUPERSPIN GLASS SYSTEM Co80Fe20/Al2O3
Abstract
Ac susceptibility measurements were performed on discontinuous magnetic multilayers Co80Fe/Al2O3(3nm)10, and 1.0 nm, by Superconducting Quantum Interference Device (SQUID) magnetometry. The CoFe forms nearly spherical ferromagnetic single-domain nanoparticles in the diamagnetic Al2O3 matrix. Due to dipolar interactions and random distribution of anisotropy axes the system exhibits a spin-glass phase. We measured the ac susceptibility as a function of temperature K at different dc fields and as a function of frequency Hz. The spectral data were successfully analysed by use of the phenomenological Cole-Cole model, giving a power-law temperature dependence of the characteristic relaxation time and a high value for the polydispersivity exponent, , typical of spin glass systems.
Keywords: Multilayers, Ac susceptibility, Polydispersivity, Dipolar interactions, Spin glass behavior
INTRODUCTION
The dynamic and static magnetic properties of spin glasses (SG) are still a subject of intense experimental and theoretical research. In the field of experiments a vast variety of different spin glass systems (Young, 1997) have yet been found and investigated. A rather new class are the so-called superspin glass (SSG) systems (Kleemann, Petracic, Binek, Kakazei et al., 2001). Here the sample is composed of an ensemble of dipolarly interacting nanoparticles, each having a superspin moment in the order of 1000 . The spin glass properties are due to frustration, a natural property of dipolar interaction, and to randomness of the anisotropy axis directions, frequently also of the spin sizes. Two different types of realisations of SSG systems exist, frozen ferrofluids (Dormann, Fiorani and Tronc, 1997, 1999; Djurberg, Svedlindh, Nordblad, Hansen et al., 1997; Mamiya, Nakatani and Furubayashi, 1999) and discontinuous magnetic multilayers (Sankar, Dender, Borchers, Smith et al., 2000; Sousa, Kakazei, Pogorelov, Santos et al., 2001; Kleemann, Petracic, Binek, Kakazei et al., 2001; Petracic, Kleemann, Binek, Kakazei et al., 2002; Sahoo, Petracic, Binek, Kleemann et al., 2002a).
It is widely accepted that 3-dimensional (3D) nanoparticle systems with high enough density of the particles and sufficiently narrow particle size distribution do have spin glass properties, i.e. there exists a phase transition temperature, , where the characteristic relaxation time and the static non-linear susceptibility diverge (Djurberg, Svedlindh, Nordblad, Hansen et al., 1997; Kleemann, Petracic, Binek, Kakazei et al., 2001; Petracic, Kleemann, Binek, Kakazei et al., 2002; Sahoo, Petracic, Binek, Kleemann et al., 2002a). In order to observe SSG properties the collective glass temperature, , has to be larger than the so-called blocking temperature, , at which the relaxation time of the individual moments (Néel, 1949; Brown, 1963)
| (1) |
reaches the order of the timescale of the experiment. Here is the effective anisotropy constant of one nanoparticle, the volume and s the relaxation time at . Below the particle moments are ”blocked”.
The condition is met in our discontinuous metal-insulator multilayers (DMIMs) Co80Fe/Al2O3(3nm)n, where nm is the nominal thickness of the ferromagnetic CoFe layers and the number of bilayers. The CoFe does not form a continuous layer but forms nearly spherical particles embedded in the diamagnetic Al2O3 matrix (Kakazei, Pogorelov, Lopes, Sousa et al., 2001). One finds self-organized arrangements of particles in each layer (Stappert, Dumpich, Sahoo, Petracic et al., 2002), i.e. the inter-particle distances are nearly constant. While SSG behavior is found for relatively small values of nm and (Kleemann, Petracic, Binek, Kakazei et al., 2001; Petracic, Kleemann, Binek, Kakazei et al., 2002; Sahoo, Petracic, Binek, Kleemann et al., 2002a), for higher values of the nominal thickness, nm, superferromagnetism (SFM) is observed (Kleemann, Petracic, Binek, Kakazei et al., 2001; Sahoo, Sichelschmidt, Petracic, Binek et al., 2002b; Chen, Sichelschmidt, Kleemann, Petracic et al., 2002).
In this article we will focus on the SSG systems Co80Fe/ Al2O3(3nm)10, with and nm. The existence of a spin glass phase was evidenced by means of dynamic criticality, static criticality of the non-linear susceptibililty and dynamical scaling (Kleemann, Petracic, Binek, Kakazei et al., 2001; Petracic, Kleemann, Binek, Kakazei et al., 2002; Sahoo, Petracic, Binek, Kleemann et al., 2002a). All three methods yield convincing values for the glass transition temperature and the dynamical critical exponents, respectively, K, , and for nm and K, , and for nm. and are the error weighted average values obtained from different methods.
While characterizes the divergence of the relaxation time of the largest ordered cluster as , there is a wide distribution of shorter relaxation times due to non-percolating clusters. They are characteristic of the glassy nature of the system and deserve a focused investigation, which will be described in the present paper. To this end we analyse the results of measurements of the complex ac susceptibility carried out at different ac amplitudes and bias fields and frequencies . In particular the so-called Cole-Cole presentation, vs , will be discussed in terms of appropriate empirical models of relaxational polydispersivity.
EXPERIMENTAL
The DMIM samples Glass/Al2O3(3nm)/Co80Fe/ Al2O3(3nm)10 ( and nm) are prepared by sequential Xe ion beam sputtering from two seperate targets (Kakazei, Pogorelov, Lopes, Sousa et al., 2001). The CoFe forms nearly spherical granules of approximately 3 nm diameter and 2 nm inter-particle spacing as found from transmission electron microscopy (TEM) studies (Stappert, Dumpich, Sahoo, Petracic et al., 2002).
The measurements were performed by use of a commercial Superconducting Quantum Interference Device (SQUID) magnetometer (MPMS-5S, Quantum Design). The ac susceptibility, , is extracted from the linear response of the sample on an oscilllating ac field, or mT at different ac frequencies, Hz. The constant dc field was either mT or mT.
RESULTS AND DISCUSSION
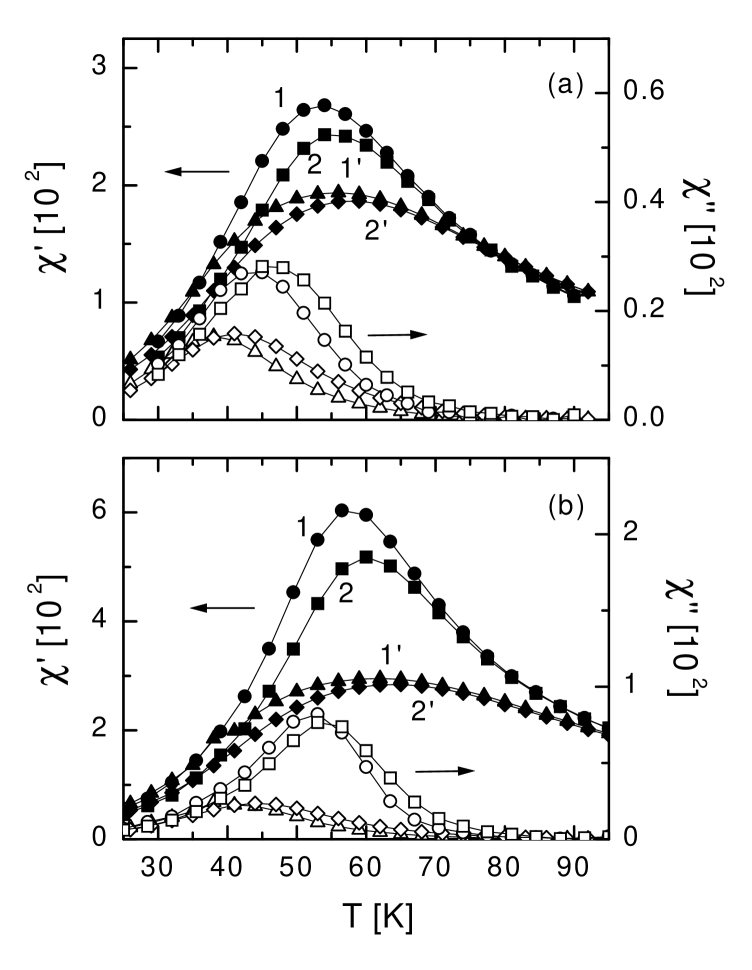
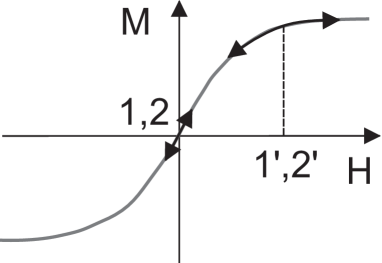
Figure 1 shows the real and the imaginary parts of the ac susceptibility vs temperature for the samples nm (a) and nm (b) under four different conditions. Curves 1 and 1’ are measured at the ac frequency and curves 2 and 2’ at 1 Hz, whereas for curves 1 and 2 an ac field amplitude of mT and a dc field of mT were applied. For curves 1’ and 2’ an ac field amplitude of mT and a dc field of mT were used (see Figure 2 for an illustration). For both samples a similar behavior is encountered. Both the increase of the probing ac field amplitude and the application of a bias field result in a supression of the amplitude of the real part and a shift of the peak to higher temperatures. Quantitatively the shift is K and K for nm, respectively. The imaginary part is also suppressed, but the inflection point at is shifted to lower temperatures, K and K for nm, respectively. This behavior is well known from other SG systems and model calculations (Canella and Mydosh, 1972; Barbara, Malozemoff and Imry, 1981) and can be explained in terms of a competition between the non-critical linear susceptibility and the critical non-linear susceptibility. In other words, the suppression of both the real and the imaginary parts reflects the obvious fact that the curve becomes increasingly non-linear when increasing the ac amplitude and/or the bias field (see Fig. 2).
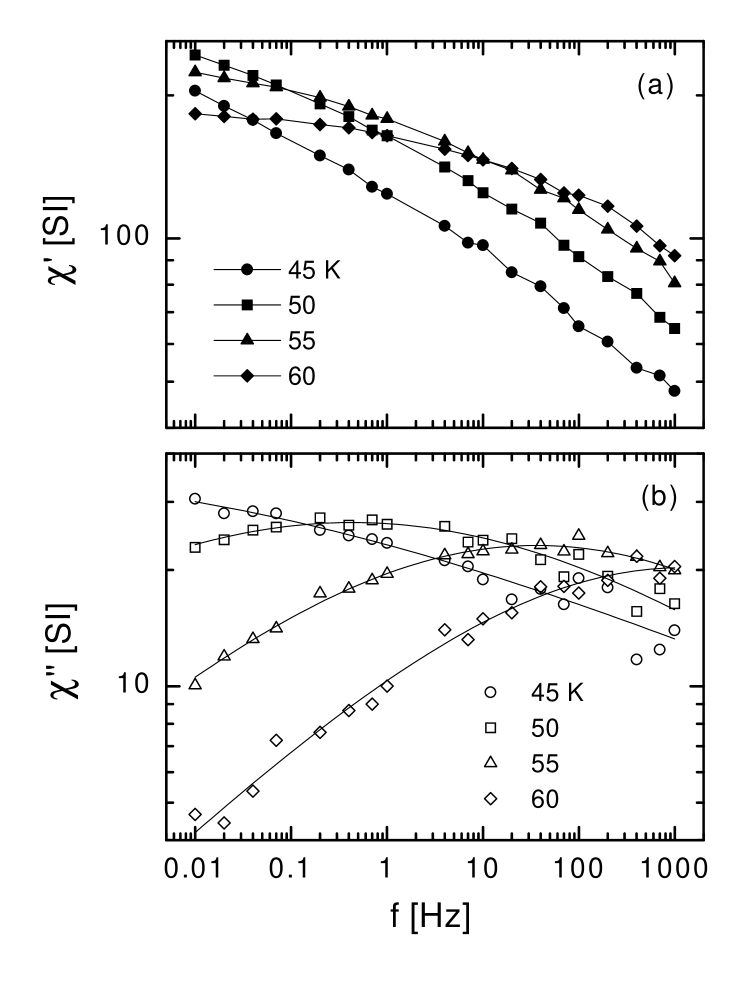
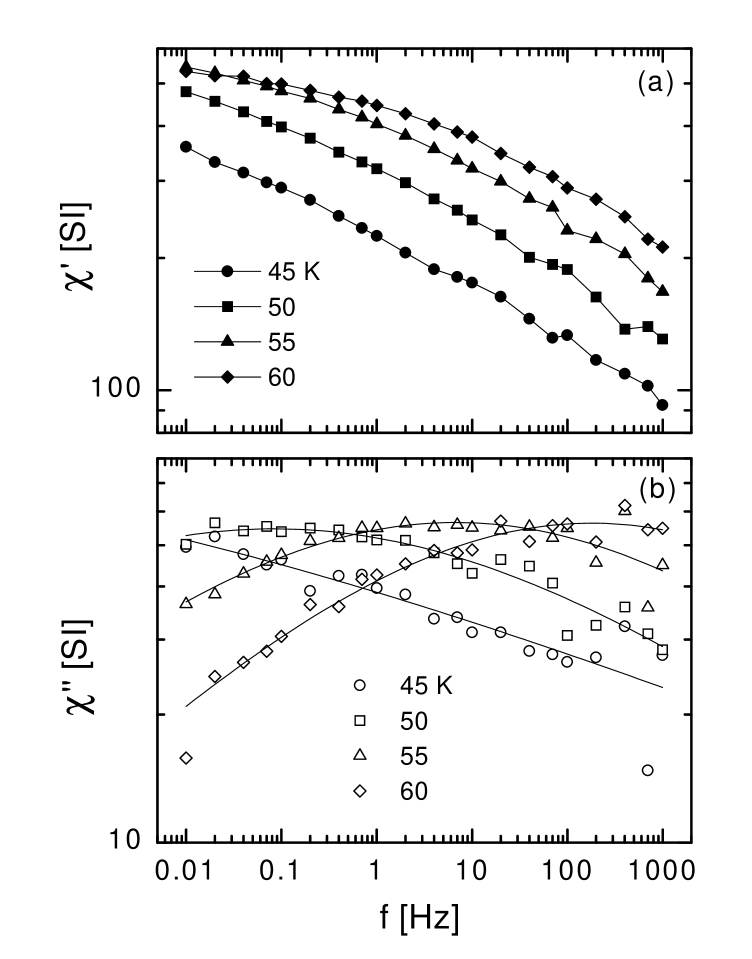
Next we studied the frequency spectra, and . Figure 3 and Fig. 4 ( and nm respectively) show the real (a) and the imaginary part (b) as functions of the ac frequency for different temperatures 45, 50, 55 and 60 K in zero-field and mT. While some negative curvature still indicates a well-defined dispersion step at Hz for K, this step becomes gradually broadened as decreases. At low the real parts show nearly constant negative slopes, thus corresponding to an extremely broad dispersion step. The imaginary parts reveal extremely broad peaks, which strongly shift to lower frequencies with decreasing temperature. Obviously our SSG system exhibits a very wide distribution of relaxation times with a pronounced temperature dependence.
A satisfactory description of the data is provided by the phenomenological Cole-Cole model (Cole and Cole, 1941; Jonscher, 1983) and was successfully applied e.g. to 2-dimensional (2D) (Dekker, Arts, de Wijn and van Duyneveldt, 1989; Hagiwara, 1998) or pseudo-1-dimensional SG systems (Ravindran, Rubenacker, Haines and Drumheller, 1989). The complex ac susceptibility, , is written in the Cole-Cole model as (Jonscher, 1983)
| (2) |
where and are the isothermal (low-f) and adiabatic (high-f) susceptibilities, respectively, is the characteristic relaxation time and a measure of the polydispersivity of the system. The case yields the standard Debye-type relaxator with one single relaxation frequency, as found, e.g., in the case of a monodisperse ensemble of non-interacting superparamagnetic particles obeying Eq. 1. The limiting case corresponds to an infinitely wide distribution of relaxation times. In SG systems one expects values of near to 1.
After decomposing Eq. 2 into its real and imaginary parts it is possible to perform a fit to the data as shown in Fig. 3 and 4. One finds (compare to Dekker et al., 1989; Ravindran et al., 1989)
| (3) | |||||
| (4) |
where . Best results are obtained, when fitting to the imaginary part , since only three parameters, , and are needed in this case.
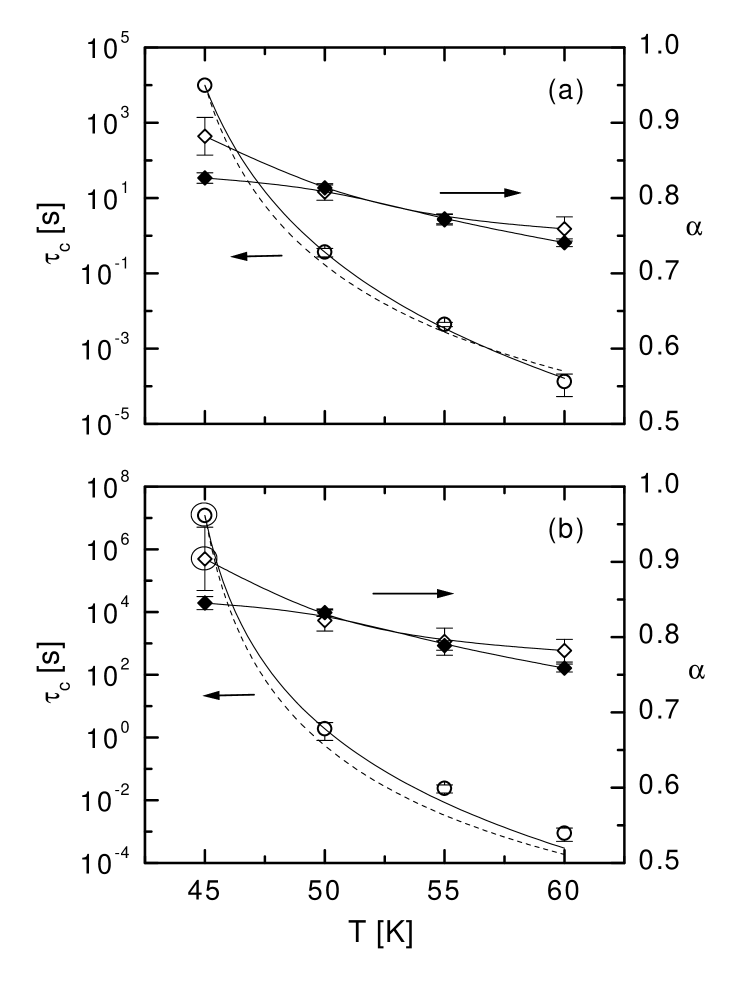
Figure 5 shows the results from the fitting, (open circles) and vs (open diamonds) for both samples, (a) and nm (b). One finds that the characteristic relaxation time is increasing with decreasing temperature. It changes by eight (a) or ten orders (b) of magnitude, respectively. By this kind of extraction of one has access to an extremely wide timescale and is, hence, more advantageous compared to the standard method of extracting from the data. It is straightforward to perform a fit of the data to a critical power-law, which was already used in previous publications (Kleemann, Petracic, Binek, Kakazei et al., 2001; Petracic, Kleemann, Binek, Kakazei et al., 2002), (solid line). It yields reasonable results, but the value of must be kept restricted or even fixed to . Then we obtain s, K and ( nm) and s, K and fixed ( nm), respectively. In the case of nm the values for and correspond well to the values obtained previously (Kleemann, Petracic, Binek, Kakazei et al., 2001; Petracic, Kleemann, Binek, Kakazei et al., 2002). This does not apply to the nm sample, where K differs strongly from the value shown above, K. Interestingly the Cole-Cole fit to the K data for nm does not converge (encircled data points in Fig. 5 (b)) leading to the conclusion that the data emerge from the non-ergodic regime, . It is worth to mention that the fit to the modified power law according to (Souletie and Tholence, 1985), , (broken line) yields similar values, i.e. s, K and fixed ( nm) and s, K and fixed ( nm), respectively. It is not possible to judge about the advantage of this method here.
The exponent increases, as expected, with decreasing temperature (Fig. 5. Its high value () meets the expectation, that a SG system should have a very broad distribution of relaxation times (Mydosh, 1993).
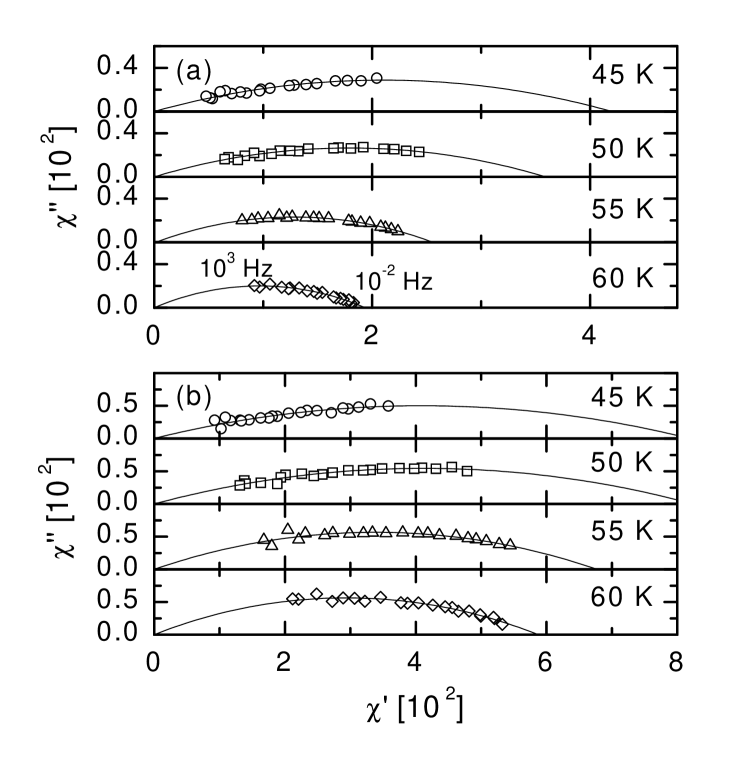
Often suscpetibility data are presented in a way, where the imaginary part is plotted against the real part (Cole-Cole plot), (Cole and Cole, 1941; Jonscher, 1983), where a classic Debye-relaxator should yield a perfect semicircle, centered on the -axis at and with radius . The apex of the semi-circle corresponds to . Non-zero has the effect to depress the semi-circle such that the angles between the -axis and the tangents at and are , respectively. Figure 6 shows the susceptibility data for (a) and nm at different temperatures , 50, 55 and 60 K. The above derived expressions for the real and imaginary parts (Eq. 3 and 4) can be expressed in the form (Hagiwara, 1998)
| (5) |
The fit yields similar results for compared to those from the fit to the imaginary part (Fig. 5, solid versus open diamonds). It should be noticed that in all cases, i.e. no measurable response is expected at frequencies above single particle flip frequencies. This corroborates the model of ferromagnetic order within each superparamagnetic particle.
CONCLUSION
The dynamical susceptibility of the SSG system
Co80Fe/Al2O3(3nm)10
( and 1.0 nm)
was studied under the
influence of a bias field and in view of its polydispersivity within the
framework of a Cole-Cole description.
Cole-Cole fits yield reasonable values for the characteristic
relaxation time of the system and for its polydispersivity
exponent . The relaxation time can be well described by a
critical power-law dependence.
One should note that by this kind of extraction of one has
access to an extremely wide timescale of eight or ten orders of
magnitude. Reasonably large values,
, are obtained, which are
typical of SG systems. The Cole-Cole plots of
the susceptibility data confirm the SG characteristic, i.e. one observes
a strongly flattened semi-circle.
Acknowledgements
The authors acknowledge financial support by DFG (Graduiertenkolleg ”Struktur und Dynamik heterogener Systeme”).
References
- Barbara et al. (1981) Barbara, B., A. Malozemoff and Y. Imry (1981). Field-dependence of the dc susceptibility of spin glasses. Physica B & C 108, 1289.
- Brown (1963) Brown, W. (1963). Thermal fluctuations of a single-domain particle. Phys. Rev. 130, 1677.
- Canella and Mydosh (1972) Canella, V. and J. Mydosh (1972). Magnetic ordering in gold-iron alloys. Phys. Rev. B 6, 4220.
- Chen et al. (2002) Chen, X., O. Sichelschmidt, W. Kleemann, O. Petracic et al. (2002). Domain wall relaxation, creep, sliding and switching in superferromagnetic discontinuous Co80Fe20-Al2O3 multilayers. Phys. Rev. Lett., submitted .
- Cole and Cole (1941) Cole, K. and R. Cole (1941). Dispersion and absorption in dielectrics. J. Chem. Phys. 9, 341.
- Dekker et al. (1989) Dekker, C., A. Arts, H. de Wijn and A. van Duyneveldt (1989). Activated dynamics in a two-dimensional Ising spin glass: Rb2Cu1-xCoxF4. Phys. Rev. B 40, 11243.
- Djurberg et al. (1997) Djurberg, C., P. Svedlindh, P. Nordblad, M. Hansen et al. (1997). Dynamics of an interacting particle system: evidence of critical slowing down. Phys. Rev. Lett. 79, 5154.
- Dormann et al. (1999) Dormann, J., D. Fiorani, R. Cherkaoui, E. Tronc et al. (1999). From pure superparamagnetism to glass collective state in -Fe2O3 nanoparticle assemblies. J. Magn. Magn. Mater. 203, 23.
- Dormann et al. (1997) Dormann, J., D. Fiorani and E. Tronc (1997). Magnetic relaxation in fine-particle systems. Adv. Chem. Phys. 98, 283.
- Hagiwara (1998) Hagiwara, M. (1998). Cole-Cole plot analysis of the spin-glass system NiC2OMIzH20. J. Magn. Magn. Mater. 177-181, 89.
- Jonscher (1983) Jonscher, A. (1983). In Dielectric relaxation in solids. Chelsea Dielectrics Press, London.
- Kakazei et al. (2001) Kakazei, G., Y. Pogorelov, A. Lopes, J. Sousa et al. (2001). Tunnel magnetoresistance and magnetic ordering in ion-beam sputtered Co80Fe20/Al2O3 discontinuous multilayers. J. Appl. Phys. 90, 4044.
- Kleemann et al. (2001) Kleemann, W., O. Petracic, C. Binek, G. Kakazei et al. (2001). Interacting ferromagnetic nanoparticles in discontinuous Co80Fe20/Al2O3 multilayers: from superspin glass to reentrant superferromagnetism. Phys. Rev. B 63, 134423.
- Mamiya et al. (1999) Mamiya, H., I. Nakatani and T. Furubayashi (1999). Slow dynamics for spin-glass-like phase of a ferromagnetic fine particle system. Phys. Rev. Lett. 82, 4332.
- Mydosh (1993) Mydosh, J. (1993). In Spin glasses: an experimental introduction. Taylor & Francis, London.
- Néel (1949) Néel, L. (1949). Théorie du trainage magnétique des ferromagnétiques en grains fins avec applications aux terres cuites. Ann. Geophys. 5, 99.
- Petracic et al. (2002) Petracic, O., W. Kleemann, C. Binek, G. Kakazei et al. (2002). Superspin glass behavior of interacting ferromagnetic nanoparticles in discontinuous magnetic multilayers. Phase Transitions 75, 73.
- Ravindran et al. (1989) Ravindran, K., G. Rubenacker, D. Haines and J. Drumheller (1989). Spin-cluster relaxation times in the spin-glass CHNH Co0.4 Ni0.6Cl2H2O. Phys. Rev. B 40, 9431.
- Sahoo et al. (2002a) Sahoo, S., O. Petracic, C. Binek, W. Kleemann et al. (2002a). Superspin-glass nature of discontinuous Co80Fe20/Al2O3 multilayers. Phys. Rev. B 65, 134406.
- Sahoo et al. (2002b) Sahoo, S., O. Sichelschmidt, O. Petracic, C. Binek et al. (2002b). Magnetic states of discontinuous Co80Fe20-Al2O3 multilayers. J. Magn. Magn. Mater. 240, 433.
- Sankar et al. (2000) Sankar, S., D. Dender, J. Borchers, D. Smith et al. (2000). Magnetic correlations in non-percolated Co-SiO2 granular films. J. Magn. Magn. Mater. 221, 1.
- Souletie and Tholence (1985) Souletie, J. and J. Tholence (1985). Critical slowing down in spin glasses and other glasses : Fulcher versus power law. Phys. Rev. B 32, 516.
- Sousa et al. (2001) Sousa, J., G. Kakazei, Y. Pogorelov, J. Santos et al. (2001). Magnetic states of granular layered CoFe-Al2O3 system. IEEE Trans. Mag. 37, 2200.
- Stappert et al. (2002) Stappert, S., G. Dumpich, S. Sahoo, O. Petracic et al. (2002). Transmission electron microscopy studies on ion-beam sputtered Co80Fe20/Al2O3 discontinuous bilayers. unpublished .
- Young (1997) Young, A. (1997). (Editor), Spin glasses and random fields. In Series on directions in condensed matter physics, Vol. 12. World Scientific, Singapore.