KMC-MD Investigations of Hyperthermal Copper Deposition on Cu(111)
Abstract
Detailed KMC-MD (kinetic Monte Carlo-molecular dynamics) simulations of hyperthermal energy (10-100 eV) copper homoepitaxy have revealed a re-entrant layer-by-layer growth mode at low temperatures (50K) and reasonable fluxes (1 ML/s). This growth mode is the result of atoms with hyperthermal kinetic energies becoming inserted into islands when the impact site is near a step edge. The yield for atomic insertion as calculated with molecular dynamics near (111) step edges reaches a maxima near 18 eV. KMC-MD simulations of growing films find a minima in the RMS roughness as a function of energy near 25 eV. We find that the RMS roughness saturates just beyond 0.5 ML of coverage in films grown with energies greater than 25 eV due to the onset of adatom-vacancy formation near 20 eV. Adatom-vacancy pairs increase the island nuclei density and the step edge density, which increases the number of sites available to insert atoms. Smoothest growth in this regime is achieved by maximizing island and step edge densities, which consequently reverses the traditional roles of temperature and flux: low temperatures and high fluxes produce the smoothest surfaces in these films. Dramatic increases in island densities are found to persist at room temperature, where island densities increase an order of magnitude from 20 to 150 eV.
pacs:
61.72.Ji,68.55.-a,81.15.-zI Introduction
Recent technological advances have resulted in wide-ranging implementation of devices which utilize hyperthermal energy particles for thin-film and nano-scale device growthMinv . While these advances have propelled production efforts, a detailed understanding of the relevant physical mechanisms has not been fully developed. It has become increasingly apparent that even hyperthermal energetic particles can stimulate a variety of thermal and non-thermal processes, ranging from strain relaxationKarr to sputter erosionMich2 , enhanced nuclei densitiesEsch , and improved composite layer adhesionFlad1 .
Efforts to model crystal surfaces during deposition have provided detailed information about the nature of surface kinetics. For example, molecular dynamics has allowed accurate predictions of many energy barriers for surface diffusion processesStolze . Many of these predictions have been carefully addressed experimentallyMorg1 ; Rosen3 ; Geis1 , but most efforts use deposition techniques with thermally generated constituents arriving at the substrate with less than a tenth of an eV.
Many of these studies have identified the “Ehrlich-Schwöebel” ehrl1 ; schw1 barrier for interlayer diffusion as the source of three dimensional growth modes. The resulting “uphill” current produced by this interlayer diffusion barrier can be reduced by increasing temperature to surmount this barrierRosen1 ; Wulf1 or sufficiently decreasing step-step separationgeis2 . However, in hetero-structures and nano-structures, elevated temperatures result in inter-diffusion, chemical reaction, and thermodynamic relaxation, making nano-scale patterns difficult to retain.
Physical vapor deposition (PVD) techniques utilizing hyperthermal energy constituents produce smoother epitaxial films in many systems with finite Ehrlich-Schwöebel barriersEsch2 ; Got1 . It has been proposed that a “peening” effect known for building-up stress at medium energiesSun ; Wind1 ; Wind2 may act as a relaxation mechanism at low and hyperthermal energiesKoster .
Progress toward understanding hyperthermal energy collisions has been hindered by a lack of models which both accurately describe the collision process and the kinetic processes at realistic deposition rates ( ML/s). The KMC-MD method allows the complexity of the atomic collision to be modeled uniquely with molecular dynamics for each atom without prior bias. Between deposition events, the kinetic Monte Carlo evolves the system using well understood kinetics, until the next deposition event. Previous KMC-MD studies of platinum and silver were able to provided new insights into the role of the hyperthermal atom collision during growthJJ .
This paper presents results for energetic collisions on the Cu(111) surface: first, isolated molecular dynamics studies of atom impacts, and, second, KMC-MD simulations of entire films grown with hyperthermal energy atoms. A brief description of the simulation, improvements, and the energy barriers used for our simulations is presented first. The yields for various atomistic mechanisms resulting from molecular dynamics simulations of isolated impacts is presented next. The results of the full KMC-MD growth model at 50 K are then discussed. Finally, simulations of sub-monolayer films at room temperature are presented.
II Simulation Details
| Terrace Diffusion | meV | |||
|---|---|---|---|---|
| Adatom diffusion | 54 | |||
| Diffusion away from a step | 525 | |||
| Diffusion of dimers | 117 | |||
| Diffusion of vacancies | 618 | |||
| Dissociation from 1 NN | 318 | |||
| Edge Diffusion | Step | |||
| Corner of “A” island | 1 | B | 1 | 179 |
| Corner of “B” island | 1 | A | 1 | 60 |
| Corner diffusion | 1 | A | 1 | 44 |
| Corner diffusion | 1 | B | 1 | 108 |
| Step to Corner | 2 | A | 1 | 271 |
| Step to Corner | 2 | B | 1 | 351 |
| Step diffusion | 2 | A | 228 | |
| Step diffusion | 2 | B | 329 | |
| Kink to corner | 3 | A | 1 | 496 |
| Kink to corner | 3 | B | 1 | 580 |
| Kink to step | 3 | A | 436 | |
| Kink to step | 3 | B | 525 | |
| Interlayer diffusion | ||||
| Descent at straight step | 167 | |||
| Descent at B step kink | 229 |
| B Step | |||
|---|---|---|---|
| Start | End | meV | (if different) |
| 5NN | 5 NN | 606 | |
| 5NN | 4 NN | 644 | |
| 5NN | 3 NN | 692 | |
| 5NN | 2 NN | 748 | |
| 4NN | 5NN | 448 | |
| 4NN | 4 NN | 470 | |
| 4NN | 3 NN | 502 | |
| 4NN | 2 NN | 695 | |
| 4NN | 1 NN | 681 | |
| 3NN | 5 NN | 214 | |
| 3NN | 4 NN | 291 | |
| 3NN | 3 NN | 322 | |
| 3NN | 2 NN | 436 | 525 |
| 3NN | 1 NN | 496 | 580 |
| 3 NN | 0 NN | 748 | |
| 2NN | 5 NN | 127 | |
| 2NN | 4 NN | 300 | |
| 2NN | 3 NN | 300 | |
| 2NN | 2 NN | 228 | 329 |
| 2NN | 1 NN | 271 | 351 |
Accurate modeling of crystal growth with hyperthermal energy atoms requires accurately modeling two classes of events active at times scales separated by about six orders of magnitude. The hyperthermal atom impact and subsequent thermalization process is complete in about four picoseconds. On the other hand, the surface kinetics are active on the microsecond time scale. The technical challenge of accurate modeling sub-picosecond events for microseconds has been resolved by coupling two techniques, one appropriate for each time scale. Molecular dynamics is used to simulate the hyperthermal atom collisions, but is not feasible for modeling surface diffusion at realistic deposition rates. For surface diffusion we use kinetic Monte Carlo, which passes atomic configurations at selected impact sites to the molecular dynamics, and accepts the new configurations following an impact. The full details of these simulations have been detailed elsewhere JJ .
We use a bowl-shaped molecular dynamics cluster with three classes of atoms: fully dynamic atoms nearest to the site of the impact, surrounded by three layers of dynamic Langevin atoms, and finally, an outer shell with four layers of static atoms. The Langevin coefficients and cell size are tuned to dissipate energy which can reflect from the boundary and lead to unrealistic rates for energetic reflection and adatom/vacancy formation.
We have found it useful to model isolated hyperthermal atom collisions with a few selected atomic configurations to develop a general picture of which atomic mechanisms are important at various energies. Many atomic configurations on the surface can be classified according to the distance to a step edge, so we have selected several positions near a (111) step edge. We model 100 collisions in each of five atomic cells above a step edge, at the step edge, and five cells below the step edge for each energy of interest. For each collision, impact parameters are randomly selected, and the cluster evolved until the Langevin atoms have thermalized the system. The configuration is then frozen into a final state for analysis and saved. Once satisfactory statistics are developed at one position, the impact site is moved one atomic cell, and the process is repeated. We have found that the statistics for the fifth cell above or below is representative of all cells further from the step.
The role of the molecular dynamics during KMC-MD is the same, except that the configuration of atoms in the molecular dynamics cell is determined by the local environment of the impact site. The KMC uses a hexagonal lattice with in-plane periodic boundary conditions and a compliment of 23 pre-defined thermal moves. Interstitial and HCP lattice positions are not allowed. The activation energies for these moves were calculated using ARTworkartwork and are listed in Table 1. (For the 273 K simulations the barriers in Table 2 are included as well.) Included in the KMC rate table is a flux weighted choice for adding new atoms. When the algorithm chooses to introduce a new atom, an impact site is randomly selected. The local configuration of atoms is then copied into the molecular dynamics cluster, which simulates the collision. Once the final configuration is determined, it is returned to the KMC, and thermal evolution continues.
II.1 Modifications to the KMC-MD algorithm
One of the trickier parts of the KMC-MD method involves moving atoms from the continuous MD space to the discrete lattice of the KMC. During collisions involving many atoms on the surface, clusters of atoms occasionally freeze into HCP rather than FCC lattice positions. (HCP and FCC lattice positions are energetically equivalent on the (111) face using the EMT potential for copper.) In the previous studies of platinum and silverJJ , these clusters rarely exceeded five atoms. As the algorithm encountered atoms in HCP sites it would place them on the nearest available FCC site. During simulations of copper, these clusters are sometimes as large as eight atoms, and this previous technique did not always preserve the shape of the cluster. In some cases, atoms near the middle of a cluster could not be placed at all, since all nearby sites would already be filled.
Our modified algorithm creates a list of atoms in HCP sites, then sorts the list from highest coordination to lowest. As each atom in the list is selected for placement, the three fcc sites surrounding that HCP site are checked for occupancy. The wayward atom is then placed into the unoccupied fcc site with the highest coordination (a random selection occurs if multiple sites have the highest coordination.) Since atoms near the center of a cluster get placed first, all atoms have an available FCC position. This change preserves the cluster and has successfully placed all the atoms in supported FCC sites.
III Results for MD Collisions
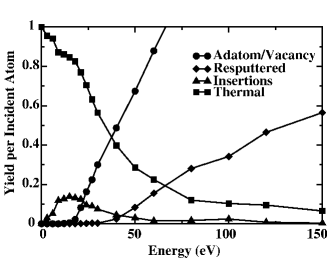
Simulating individual atomic collisions in a pre-selected environment can provide a general insight into the yields for atomic mechanisms at different energies. Once an impact has been simulated, the final atomic configuration is classified according to the change in the population of the atomic layers. If the impact site is above the step edge, and the atom incident atom is incorporated into the step, the event is considered an insertion. We do not distinguish between an atom that is actually inserted, and one which just bounces over the step edge. A decrease in the population of a layer requires the formation of a vacancy. The formation of vacancies usually provides additional adatoms (adatom-vacancy pairs) that can contribute to surface relaxation through enhanced lateral diffusion. If the total number of atoms in the cluster decreases, this is considered a sputtering event. (Spontaneous thermodynamic re-evaporation is negligible.)
The yields averaged from many simulated collisions at several different atomic configurations are presented in Figure 1. The hyperthermal atomic mechanisms observed in platinum and silver are present in copper, but the specific energies of activation varying somewhat. The insertion mechanism is active at the first position above the step edge as low as 3 eV. As the energy increases, atoms are inserted deeper into the island, which increases the yield. By 9 eV insertion events are observed four lattice positions into an island. The fifth atomic position into the step is not susceptible to insertion, so the insertion probability reaches a maxima at 15 eV. Above this energy, insertions continue to dominate beyond the first position above the step, but positions near the step become unstable and often form adatom-vacancy pairs.
Adatom-vacancy formation on the flat terrace begins abruptly near 20 eV, and the total yield increases at a rapid rate, reaching a yield of one by 60 eV. On average, more than two adatom-vacancy pairs are created per incident atom by 150 eV. By 80 eV, adatom-vacancy has a higher probability at all the step positions considered than any other mechanism.
At about 40 eV we begin to observe atoms escaping from the system, with some preference for positions close to the atomic step edge. At low energies, an atom incident just above a step could shift the registry of atoms and become incorporated, but at higher energies the transverse momentum provided by the incident atom can eject step atoms from the system. The rapid increase in yields for adatom-vacancy pairs and sputtered atoms combine to double the number of dislodged atoms between 60 an 100 eV, greatly increasing the surface mobility and reducing the net growth rate to 65% of the incident flux. More comprehensive studies of re-sputtering have been reported elsewhereWad2 .
IV Results and Discussion of 50K KMC-MD deposition
While the molecular dynamics simulations of isolated impacts estimates the relative yields of different atomic mechanisms at various energies, the effect on a dynamically growing film requires the more sophisticated KMC-MD simulation. We have used KMC-MD to grow copper thin films on a Cu(111) surface using energies ranging from thermal to 40 eV. All the mechanisms identified with the isolated molecular dynamics in the previous section are active, but the yield for re-sputtering below 40 eV is negligible.
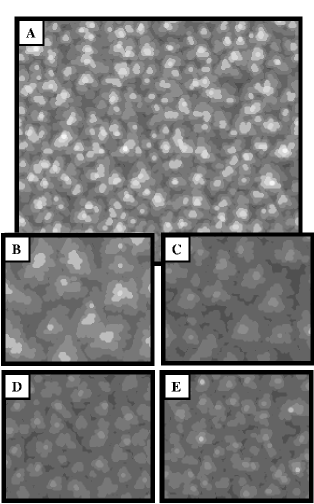
Five examples of copper thin films grown with the KMC-MD are presented in Figure 2. The films shown were grown with a wide range of energies: thermal (A), 12 eV (B), 21 eV (C), 30 eV (D), and 40 eV (E). All films described in this section are grown at 50∘ K at 1 monolayer/s deposition rate on an 80x80 lattice, except thermal deposition, which had a 150x150 lattice. System sizes are selected to avoid finite size effects, but all the images have the same lateral length scale, and the same color map for ease of comparison (the size of an atom is the same in all the images, and the layer depths have the same color sequence in all images). While four mono-layers of copper has been deposited in all cases, the films grown at 21 eV and 30 eV do not have any atoms in the seventh and eighth layers. The thermally deposited film has a large population of atoms in these upper two layers and is rougher than those grown with energetic deposition. The step density in the thermal films is much higher at 0.74 than the 21 eV or 30 eV films (0.39 and 0.45, respectively), corresponding to a shorter lateral length scale (step densities are discussed in more detail later).
A common way of representing smooth growth that establishes a connection with experimental effortsPoels ; Mich1 is to plot the simulated anti-phase Bragg intensities associated with refelection high energy electron diffraction or x-ray diffraction. Anti-phase intensities will exhibit complete oscillations between 0 and 1 for perfect layer-by-layer growth, and a monotonic decay for three-dimensional roughening. Due to space constraints, we have limited the presentation of simulated anti-phase intensity to our discussion of temperature and flux in Section V. With the exception of thermally deposited films, all the films studied exhibited layer-by-layer oscillations of varying strengths. The anti-phase intensity of the thermally grown film decays monotonically in this low-temperature regime, consistent with experimental observation Rosen2 . The anti-phase intensity oscillations are strongest between 20-30 eV, corresponding with the minima in roughness shown in Fig 3.
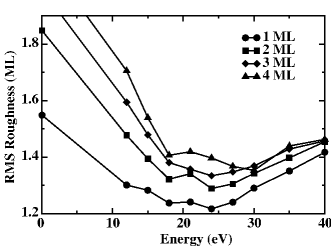
The roughness of the KMC-MD films is quantified by calculating the RMS roughness at the completion of each of the four mono-layers deposited. This roughness data as a function of the deposition energy is shown in Figure 3. Even after depositing only one monolayer, the films grown with atoms in the 20 eV range have a much lower roughness than those grown with higher or lower energies. As the film progresses, this minimum roughness appears to shift toward higher energies. The roughness of films grown with less than 25 eV grows more quickly after 1 monolayer of coverage than the roughness of the films grown with energies greater than 25 eV. Careful examination of the 40 eV data reveals very little change in the surface roughness after the first monolayer.
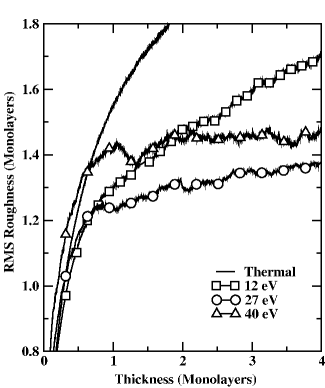
The time evolution of the RMS roughness is shown in greater detail for a few selected energies in Figure 4. The RMS roughness for the thermally deposited film diverges as a power law, as expectedFam . For all the energies shown, the RMS roughness grows rapidly until about 0.5 ML. Below 0.5 ML, films deposited with energies greater than 20 eV actually develop roughness faster than the thermally deposited film. As the hyperthermal beam creates large numbers of adatom vacancy pairs, the surface width increases rapidly, but these extra adatoms in turn increase nuclei densities, which contribute to higher step densities, shown in Figure 5.
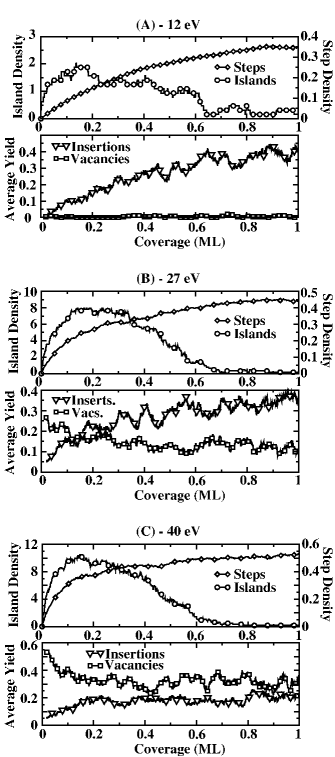
Island density and step density (top frames), as well as time averaged insertion and vacancy yields (bottom frames) are presented in Figure 5A-C for 12 eV, 27 eV, and 40 eV, respectively. As the energy increases from 12 eV to 40 eV, the saturation island density (approximately the density at 0.15 ML) increases by a factor of six. Since the island density and the average island size are related (, where is the coverage and is the average island size), one might naively expect a factor of six increase in island density to correspond with a increase in the step density at constant coverage. In actuality, the increase in island density does not translate directly to an increase in step edge density, the step edge density in Figure 5 increases by only about 50%, not . This is partly a consequence of our definition of island density. We define the step density as the number of atoms with empty neighbor sites, since the insertion mechanism relies on displacing an atom into an empty neighboring lattice position. This definition can decouple island density and step density. For example, if all islands were composed of four atoms, the step density would be 4 times the island density. But if all the islands were made from dimers, the step density would be the same, but the island density would increase by a factor of two.
Figure 5 also displays the dynamic yields for the insertion mechanism and the formation of vacancies at 12eV (A), 27 eV (B), and 40 eV (C) respectively. While the yields discussed in the previous section and presented in Figure 1 provide an average yield for insertions and vacancies at a given energy near a (111) step edge, the yields in Figure 5 are dynamic. Each line-shape is a running average a few hundreths of a monolayer in coverage. The yields for insertions and vacancy production is observed to be sensitive to fluctuations in the surface structure.
The insertion yields at 12 eV and 27 eV track the step density very closely. At very short times, while the surface is still very flat, the step density is very low and few sites are available for insertion. During these times, the vacancy yield is large, which in turn increases the island and step density. With increasing step density, more sites become available for insertion, increasing the insertion yield. At these energies, adatom-vacancy production is suppressed at step edges. So, as the surface becomes more populated with islands and fewer flat terraces, the vacancy yield decreases. At about 0.3 ML, islands begin to coalesce and decrease the number of first layer step edges. The formation of adatom-vacancy pairs on the second layer (atop islands) keeps the step edge density high, and the insertion mechanism does not suffer.
The increase in the island density and corresponding increase in the step density below 0.5 ML in the 27 and 40 eV simulations sets the stage for smooth growth at later times. The drop in the island density to a very low value by 0.7 ML indicates near completion of the first layer before second layer growth. The abrupt change in the RMS roughness (Figure 4) near 0.5 ML of coverage illustrates the predicted benefit of using hyperthermal energy particles. With increasing particle energy the RMS roughness grows more slowly until, by 40 eV, the RMS roughness does not perceptibly increase above 1 ML of coverage. This “saturated” roughness was observed in all films grown with energies at or above 30 eV. While the roughness does not noticeably increase above 1 ML in these films, higher incidence energies result in larger “saturation” roughnesses.
The effect of a saturated roughness is the result of the insertion yield and the vacancy yield both achieving saturation. At 27 eV, the first four lattice positions immediately above a step edge are available for insertion, which suppresses vacancy formation. As a result, insertions have a higher yield during growth above 0.5 ML than vacancies (Figure 5B), and the saturation roughness is less than at 40 eV. At higher energies, the first lattice position above the step is unstable upon impact. As a result, the balance of insertion and vacancy yields falls in favor of vacancies at 40 eV (see Figure 5C, and notice the scale differences between 12 (A), 27 (B), and 40 eV (C)).
While total insertions decrease at 40 eV, other energetic effects begin to compensate and keep the roughness from increasing dramatically. For example, the increasing atom energy can break islands into smaller pieces, preventing an additional layer from nucleating on top of it. Atom impacts on top of multiple layers can lead to collective downward mobility, e.g. at 40 eV two atoms or more were observed to fall in the layer beneath the impact site one time in twenty-five. These and other mechanisms which involve collective motion of multiple atoms have been discussed in detail elsewhereVoter1 ; Wad1 .
The large insertion yield effectively reduces the interlayer diffusion barrier by providing an alternative to thermal descent for crossing the step. We have performed KMC simulations using an reduced interlayer diffusion barrier to mimic this effect. This oversimplification fails to reproduce the correct line-shape for the RMS roughness and does not provide a layer-by-layer type growth, underscoring the importance of adatom-vacancy pairs. The adatom-vacancy pairs contribute to establishing a microscopically rough interface that sustains a macroscopically smooth growth front through high insertion yields.
To review, as a film begins to grow with atoms in the 25 eV energy range, the surface initially becomes pocked with vacancies. The deposited atoms combine with adatoms from adatom-vacancy pairs to develop high densities of small islands, which have low probabilities for second layer nucleation. The vacancies and the new islands both increase the step edge density, which leads to high insertion yields. As the islands grow from insertion and aggregation, some begin to form second layer islands and obtain vacancies prior to coalescence. This establishes an average distance between step edges of about three atomic positions, and the roughness saturates. As the vacancies are filled and new levels are nucleated, the surface grows smoothly with a constant roughness. This smooth growth relies on both the insertions to keep islands growing and the vacancies to provide additional adatoms and to reduce the area available for new layer nucleation.
V Non-intuitive Role of Temperature and Flux in Energetic Deposition
During thermal homoepitaxy, the roles of temperature and flux are well understood Rosen2 , smooth growth occurs when adatoms have enough time to diffuse to an existing island and the islands have time to coalesce before second layer nucleation occurs. This is most likely to occur when the temperature is increased to increase the diffusion length, and the flux decreased to reduce the probability of nucleating a new island before coalescence.
During hyperthermal energy deposition, this phenomenology reverses due to the strong dependence on step density. Other authors have found the best results for smooth growth with hyperthermal deposition can be obtained by maximizing the nuclei densityRosen1 ; Wulf1 . Since island densities scale as (F is flux, D is the temperature dependent diffusivity, and p depends on the critical nuclei size)venables , establishing a high density of islands requires decreasing the temperature and increasing the flux. A high island density also means a small average island size (, where is the film coverage and is the average island size), reducing the target area for second layer nucleation, and keeping the entire second layer surface close to a step edge. A hyperthermal atom incident on top one of these islands has a very high probability of inserting, rather than relying on kinetic diffusion to cross to the lower terrace.
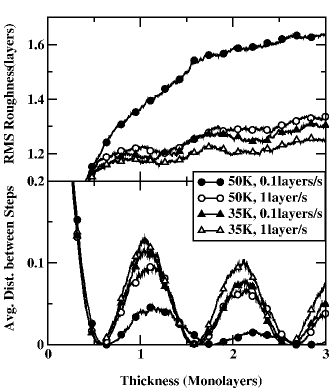
We have presented RMS roughness as a function of time and anti-phase intensity data for films grown with 24 eV atoms at various temperatures and flux in Figure 6. Contrary to thermal depositionRosen2 , the rougher films occur with the higher temperatures and lower fluxes. In addition, one can compensate for a decrease in flux by decreasing the temperature. For example, the surface grown at 50K and 0.1 ML/s was much rougher than the film grown at 50 K and 1 ML/s, but at 35 K with 0.1 ML/s flux, the film grows smoothly.
VI Hyperthermal Energy Induced Island Densities
While atomic insertion provides a compelling mechanism for controlling surface roughness, the extremely small island sizes and high step densities required for layer-by-layer behavior reduce the effectiveness at temperatures typical for film growth. At typical deposition temperatures, the average island size becomes large enough to reduce the number of sites available for insertion significantly, in turn reducing the average insertion yield. Even though the insertion yield drops, the adatom-vacancy pairs generated by hyperthermal energy ion beams provide additional adatoms that increase island densities.
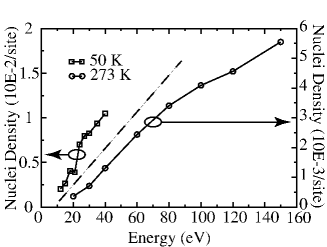
Island densities after the first layer reaches 0.15 ML of material are shown for films grown at 50 K and 273 K in Figure 7. The 273 K deposition is performed on a 400x400 lattice at 100 ML/s using all the diffusion moves listed in Tables 1 and 2. Increased adatom density due to adatom-vacancy production leads to dramatic increases in the island density at both temperatures. The onset of sputter erosion near 40 eV acts to slow the net growth speed relative to the nucleation rate, increasing the effective flux. As material in the substrate is lost to sputter erosion, saturation island densities (typically at about 0.15 ML of coverage) are reached as low as 0.05 ML. As atoms are deposited or displaced, the first layer collects most of the material, nucleating new islands while the additional vacancies produced by the sputter erosion reduces the net meterial deposited. For example, consider an energy at which two adatom-vacancy pairs are produced and the sputter yield is 0.5. On average, every incident atom will create 2.5 atoms in the first layer, while only depositing 0.5 atoms total. After 0.1 ML of net deposition, the first layer will have almost 0.25 ML coverage.
The data presented in Figure 7 is the density of islands after the first layer has reached 0.15 ML of coverage, not 0.15 ML of total deposition. The saturation island density depends on the coverage in the layer being considered, not on the total amount of material deposited. It may be surprising such a strong effect remains at 273 K, as the thermal activation of diffusion increases the probability for adatom-vacancy recombination. We find that the high adatom densities lead to rapid formation of dimers, which still move freely with only a 117 meV diffusion barrier. Dimer step crossing is negligible, and dimer breakup occurs infrequently.
We have also found that high island densities are maintained with unexpectedly low average island sizes due to islands being “chipped” by incident atoms. While large islands are occasionally broken into two smaller stable islands, breaking dimers and adatoms off of stable islands occurs with a relatively high yield, on the order of 1/10 impacts on an island. This contributes to additional nucleation of small islands and suppresses the growth of large islands.
The significance of enhanced nuclei densities has already been experimentally demonstrated by using an ion beam to increase the free adatom density at the beginning of each monolayer of growth while depositing copper on Cu(111)Wulf1 . (In this example, a separate 1.2 keV argon ion beam and a flux of thermal atoms were used.) The ability to dramatically increase nuclei densities using a single growth beam in the room temperature regime opens new possibilities for circumventing three-dimensional growth. It is possible that pulsing the final beam energy between a low energy (20 eV) and a high energy (100 eV) in manner similar to the previous exampleWulf1 can allow the benefits of high island density and atomic insertion to be utilized while using a single deposition source.
VII Acknowledgements
The authors would like to acknowledge Oana Malis, Markus Rauscher, and Joel Brock for their discussions and editorial contributions. This work was supported by the Cornell Center for Materials Research (CCMR), a Materials Research Science and Engineering Center of the National Science Foundation (DMR-0079992). Portions of this research were conducted using the resources of the Cornell Theory Center, which receives funding from Cornell University, New York State, Federal Agencies, and corporate partners. Additional support was provided by the AFOSR under grant number F49620-97-1-0020.
References
- (1) T. Minvielle, R. White, and R. Wilson, J. Appl. Phys. 79, 2750 (1996).
- (2) B. Karr et al., J. Appl. Phys. 80, 6699 (1996).
- (3) T. Michely and C. Teichert, Phys. Rev. B 50, 11156 (1994).
- (4) S. Esch et al., Surf. Sci. 365, 187 (1996).
- (5) H. Fladry, N. Tegen, and G. Wolf, Nucl. Inst. Meth. B 91, 575 (1994).
- (6) P. Stolze, J. Phys. Condens. Matter 6, 9495 (1994).
- (7) K. Morgenstern, G. Rosenfeld, and G. Comsa, Phys. Rev. Lett. 76, 2113 (1996).
- (8) G. Rosenfeld et al., Surf. Sci. 402-404, 401 (1998).
- (9) M. Geisen and G. S. Icking-Konert, Surf. Sci. 412/413, 645 (1998).
- (10) F. H. G. Ehrlich, J. of Chem. Phys. 44, 1039 (1966).
- (11) R. Schwoebel and E. Shipsey, J. of Appl. Phys. 37, 3682 (1966).
- (12) G. Rosenfeld et al., Appl. Phys. A 61, 455 (1995).
- (13) W. Wulfhekel et al., Surf. Sci. 348, 227 (1996).
- (14) M. Geisen and H. Ibach, Surf. Sci. 431, 109 (1999).
- (15) S. Esch, M. Bott, T. Michely, and G. Comsa, Appl. Phys. Lett. 67, 3209 (1995).
- (16) Y. Gotoh et al., Thin Solid Films 288, 300 (1996).
- (17) S.-S. Sun, J. Vac. Sci. Technol. A 4, 572 (1986).
- (18) H. Windischmann, J. App. Phys. 62, 1800 (1987).
- (19) H. Windischmann, Critical Reviews in Solid State and Materials Sciences 17, 547 (1992).
- (20) M. Koster and H. M. Urbassek, Phys. Rev. B 63, ONLINE (2001).
- (21) J. Jacobsen, B. Cooper, and J. Sethna, Phys. Rev. B 58, 15847 (1998).
- (22) P. Stolze, Simulation methods in atomic-scale materials physics (Polyteknisk Forlag, Anker Engelundsvej 1, DK-2800 Lyngby, Denmark, 1997), –Dr. Stolze has made code and manuals availiable online at the following web address: http://www.aue.auc.dk/stolze/art.html.
- (23) X. Zhou and H. Wadley, Surf. Sci. 431, 58 (1999).
- (24) B. Poelsema et al., in Surface Science Principles and Applications, edited by R. Howe, R. Lamb, and K. Wandelt (Springer-Verlag, Berlin, New York, 1993), p. 95.
- (25) T. Michely, M. Kalff, and G. Comsa, in Mechanisms and Principles of Epitaxial Growth in Metallic Systems, Vol. 278 of Proceeding of the Materials Research Society, Materials Research Society (Mater. Res. Soc, Warrendale, PA, 1998).
- (26) G. Rosenfeld, B. Poelsema, and G. Comsa, in The Chemical Physics of Solid Surfaces: Growth and Properties of Ultrathin Epitaxial Layers, edited by D. King and D. Woodruff (Elsevier Science, New York, 1997), Chap. 3: Epitaxial growth modes far from equilibrium.
- (27) F. Family, in Universalities in Condensed Matter (Springer-Verlag, Berlin, New York, 1988), p. 193.
- (28) A. Voter, J. of Chem. Phys. 106, 4665 (1997).
- (29) X. Zhou and H. Wadley, Surf. Sci. 430, 42 (1999).
- (30) J. Venables, G. Spiller, and M. Hanbücken, Rep. Prog. Phys. 47, 399 (1984).
- (31) J. Jacobsen, K. Jacobsen, and J. Norkskov, Surf. Sci. 359, 37 (1996).