Mid-Infrared Conductivity from Mid-Gap States Associated with Charge Stripes
Abstract
The optical conductivity of La2-xSrxNiO4 has been interpreted in various ways, but so far the proposed interpretations have neglected the fact that the holes doped into the NiO2 planes order in diagonal stripes, as established by neutron and X-ray scattering. Here we present a study of optical conductivity in La2NiO4+δ with , a material in which the charge stripes order three-dimensionally. We show that the conductivity can be decomposed into two components, a mid-infrared peak that we attribute to transitions from the filled valence band into empty mid-gap states associated with the stripes, and a Drude peak that appears at higher temperatures as carriers are thermally excited into the mid-gap states. The shift of the mid-IR peak to lower energy with increasing temperature is explained in terms of the Franck-Condon effect. The relevance of these results to understanding the optical conductivity in the cuprates is discussed.
pacs:
PACS: 71.27.+a, 75.40.Cx, 75.50.Ee, 71.45.LrI Introduction
Studies of optical conductivity can provide valuable information about electronic correlations in solids; however, the proper explanation for the frequency dependence of the conductivity is not always uniquely obvious. One system that has received considerable attention is La2-xSrxNiO4, a compound that is isostructural with superconducting cuprates.Bi et al. (1990); Ido et al. (1991); Bi and Eklund (1993); Crandles et al. (1993); Eagles et al. (1995); Calvani et al. (1996); Katsufuji et al. (1996); Bäuml et al. (1998); Tsutsui et al. (1999); Katsufuji et al. (1999); Pashkevich et al. (2000); Jung et al. (2001) The substitution of Sr2+ for La3+ dopes holes into the NiO2 plane. When the light polarization is parallel to the NiO2 planes, the electronic conductivity exhibits a broad peak at eV,Bi et al. (1990) whose intensity grows with the hole concentration.Ido et al. (1991) Katsufuji et al.Katsufuji et al. (1996) showed for La1.67Sr0.33NiO4 that spectacular changes occur on the scale of 1 eV as the temperature is changed from 10 K up to 480 K, the latter being twice the temperature at which the charge is know to order.Lee and Cheong (1997) The mid-infrared (MIR) conductivity peak has been variously interpreted in terms of polarons,Bi and Eklund (1993); Eagles et al. (1995); Calvani et al. (1996); Katsufuji et al. (1996); Bäuml et al. (1998); Jung et al. (2001) – excitations,Tsutsui et al. (1999); Jung et al. (2001) a doped-semiconductor,Crandles et al. (1993) and conventional charge-density-wave (CDW) orderingKatsufuji et al. (1996); however, none of these interpretations is particularly convincing.
When the first infrared reflectivity studies were performed,Bi et al. (1990); Ido et al. (1991) the nature of the electronic correlations in La2-xSrxNiO4 was a mystery. Today, however, it is firmly established by neutron and X-ray diffraction studies that the holes doped into the NiO2 planes tend to order in charge stripes, separating antiferromagnetic domains.Tranquada et al. (1994); Tranquada (1998); Yoshizawa et al. (2000) Recently it has been demonstrated that the charge stripes survive above the melting transition.Lee et al. (2002) It follows that the optical conductivity must derive from the electronic states associated with charge stripes.
To provide context for our interpretation, we present an infrared reflectivity study of a nickelate system that exhibits long-range, three-dimensional (3D) stripe orderTranquada et al. (1995); Wochner et al. (1998): La2NiO4+δ with . The 3D ordering of the oxygen interstitials creates a modulated potential that can couple to the stripes.Wochner et al. (1998) Based on measurements of the in-plane resistance, we argue that the stripe and interstitial orderings appear simultaneously at 317 K, an unusually high temperature for stripe order in the nickelates.
We analyze the optical conductivity in terms of two components: a damped-harmonic oscillator (corresponding to the MIR peak) whose resonance frequency shifts with temperature, and a Drude component. We attribute the MIR peak to transitions from filled valence states to empty mid-gap states associated with the charge stripes.Zaanen and Gunnarsson (1989); Poilblanc and Rice (1989); Schulz (1990); Zaanen and Oleś (1996); Tchernyshyov and Pryadko (2000); Granath et al. (2002); Lorenzana and Seibold (2002); Heeger et al. (1988) The temperature-dependent energy shift of the MIR peak is due to the Franck-Condon effect associated with lattice relaxation about the charge stripes; a greater excitation energy is required in the ordered state than in the melted state. The Drude peak appears at higher temperatures as the MIR shift is reduced and electrons are thermally excited into the mid-gap states. We argue that the excitation of carriers corresponds to local fluctuations of the charge stripes, so that dc conductivity competes with stripe order in this stripe insulator. Such competition would be less significant in a system with partially filled mid-gap states, as should be the case in certain cuprates with metallic stripes. Noda et al. (1999); Ichikawa et al. (2000); Tajima et al. (1999); Dumm et al. (2002)
The rest of this paper is organized as follows. A description of the experimental procedures in the next section is followed by a discussion of the nature of stripe ordering in La2NiO4+δ. In Sec. IV we describe our expectations for the optical conductivity associated with stripes based on available theoretical calculations. The experimental results for the optical conductivity are presented and analyzed in Sec. V. We conclude with a summary of our results and interpretation, and a discussion of the relevance of this picture to the interpretation of optical conductivity in cuprate superconductors.
II Experimental Procedures
The single crystal studied here was grown by radio-frequency skull melting.Buttrey et al. (1995); Rice and Buttrey (1993) After orienting the crystal by X-ray Laue diffraction, a surface was cut perpendicular to the axis (parallel to the NiO2 planes) and then polished. Subsequently, the oxygen concentration was selected by annealing at 464∘C for 5 days in flowing O2 (1 bar), followed by a quench to room temperature. The annealing conditions were chosen to give a nominal of 0.133, based on earlier work on the phase diagram.Rice and Buttrey (1993) A measurement of the magnetization vs. temperature, with the field applied parallel to the planes, yielded the characteristic ferrimagnetic response on cooling, with an abrupt drop at the magnetic ordering temperature of 110 K, observed in a previous study of the phase.Tranquada et al. (1997)
The in-plane resistance, measured by the four-probe method on a small slice of crystal, is plotted in Fig. 1. The effective cross-sectional area, required for the conversion to resistivity, could not be determined because of the presence of micro-cracks, observed by optical microscopy, that result from quenching. In an attempt to compensate for this problem, we have plotted in the same figure the in-plane resistivity of La1.725Sr0.275NiO4, a sample with a similar nominal hole concentration, normalized to cm. The normalization factor for the oxygen-doped crystal, , has been chosen so that the two curves nearly coincide.
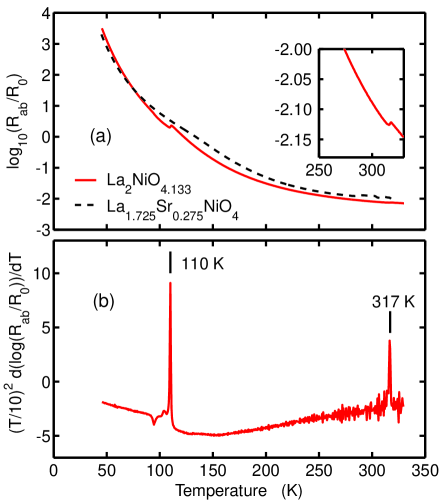
We expect the resistivities for the two samples, and , should be very similar since the hole density for each is , and there is clearly little difference between the temperature dependences. We will use this similarity to estimate the resistivity of the oxygen-doped sample: , with cm. This estimated resistivity will be used in Sec. V.
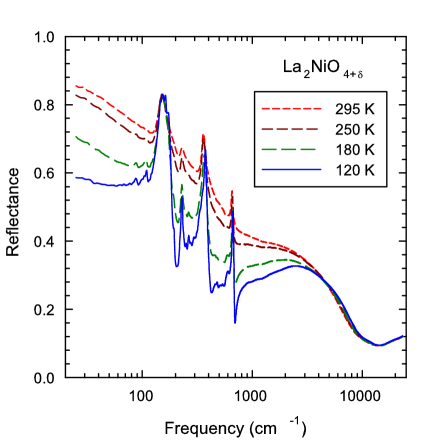
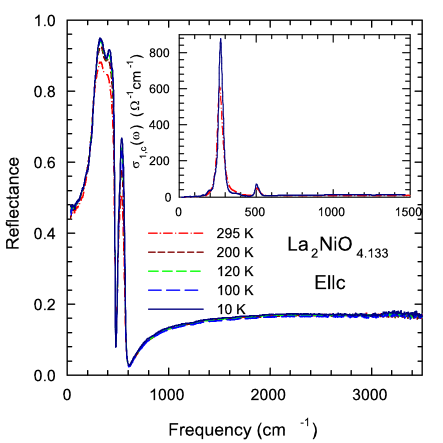
For the IR measurements, the crystal was mounted in a cryostat on an optically-black cone. The temperature dependence of the reflectance was measured at a near-normal angle of incidence from to over 24,000 cm-1 on a Bruker IFS 66v/S using an in situ overcoating technique, which has previously been described in detail elsewhere.Homes et al. (1993a) Examples of reflectance measurements with the light polarization perpendicular to and parallel to the -axis are shown in Figs. 2 and 3, respectively. For the in-plane polarization, little temperature dependence is observed above cm-1, and hence the reflectance was assumed to be temperature independent for cm-1. The optical conductivity has been determined from a Kramers-Kronig analysis of the reflectance, for which extrapolations are necessary for . For the in-plane polarization, a metallic low-frequency extrapolation, , was used for K; at lower temperatures the reflectance was assumed to continue smoothly to at zero frequency.
III Nature of Ordering in La2NiO4.133
The interstitial oxygen order and the spin and charge stripe order of La2NiO4+δ with have been characterized previously by neutron diffraction.Tranquada et al. (1994, 1995); Wochner et al. (1998) The first studiesTranquada et al. (1994, 1995) were done on a crystal with a net oxygen excess of , where the interstitial order developed below K. The magnetic order appears abruptly below a first-order transitionTranquada et al. (1994); Wochner et al. (1998) at 110 K. Measurements on a crystal with showed that the charge order survives well above 110 K, but decays very slowly.Wochner et al. (1998) The intensity of a charge-order peak was followed up to 220 K and was found to decay as , similar to a Debye-Waller factor.
A piece of the present sample was studied by X-ray diffraction.Wochner et al. This time it was possible to follow the gradual decay of charge order scattering up to K before it disappeared into the background; the exponential decrease of intensity with temperature makes it difficult to evaluate where the charge-stripe order truly goes to zero. The interstitial order was found to disappear at 317 K.
The interstitial order lowers the symmetry of the lattice, and provides a modulated potential that can pin charge stripes.Wochner et al. (1998) The absence of a clear disordering transition for the charge stripes is consistent with order induced by a symmetry-breaking field, as occurs in the case of a ferromagnet warmed in an applied magnetic field to temperatures above its Curie point. From such an analogy, it appears possible that a finite degree of charge-stripe order appears as soon as the interstitials order.
To pursue this idea further, we have taken a close look at the in-plane resistance. There are two small jumps in the resistance, one at the magnetic ordering temperature of 110 K and the second at 317 K where the interstitials disorder. (Note that the resistance increases on warming through each of these transitions.) To emphasize that these are the only sharply defined transitions, we have plotted the derivative of with respect to temperature in Fig. 1(b), with the derivative multiplied by to make the higher temperature feature clear. The absence of a third transition is consistent with simultaneous disordering of charge stripes and interstitials.
In La2-xSrxNiO4, the highest charge ordering temperature, , is 240 K at . At a Sr concentration of , closer to the hole concentration of our sample, K. Thus, the likely appearance of charge order at 317 K in the oxygen-doped crystal is quite unusual. Pinning of stripes by the interstitial potential suggests that the stripes would exist dynamically in the absence of the potential. Direct evidence of dynamic stripes in a La2-xSrxNiO4 sample was recently obtained in a neutron scattering study.Lee et al. (2002)
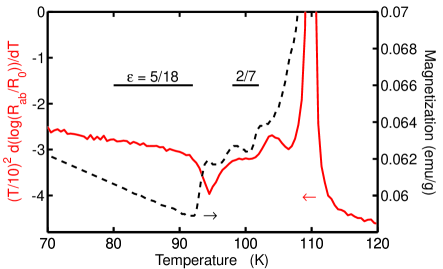
The attentive reader may have noticed the structure that appears in the derivative of the resistivity below the 110 K spike in Fig. 1(b). We have expanded this region in Fig. 4, where we have also plotted the magnetization. The steps in the magnetization, which have previously been shown to correspond to lock-in plateaus of the temperature-dependent inverse stripe spacing,Tranquada et al. (1997) also appear to correlate with changes in the resistivity. The resistivity is clearly sensitive to variations in the stripe order.
IV Expectations for Optical Conductivity due to Charge Stripes
Before continuing on, let us discuss the possible interpretations of the MIR peak. In La2-xSrxNiO4 with , there is a charge-transfer-excitation gapIdo et al. (1991); Pellegrin et al. (1996) of 4 eV. Doping introduces states within that gap. At room temperature, the dopant-induced conductivity peak grows with the Sr concentration but does not shift. Integrating the conductivity from 0 to 2 eV yields an effective carrier concentration equal to the Sr concentration (assuming carriers have the free electron mass).Ido et al. (1991) Attempts to fit the MIR peak with the conductivity expected from a small polaron generally give a poor overall fit to the energy and temperature dependence.Bi and Eklund (1993); Crandles et al. (1993); Katsufuji et al. (1996) Alternatively, Katsufuji et al.Katsufuji et al. (1996) extracted a temperature dependent gap from an analysis of the leading edge of the MIR peak, and compared it with the temperature dependence of a CDW gap. Of course, the MIR peak is still present when the putative gap goes to zero, and the system never becomes a truly metallic conductor, so it is difficult to see how a conventional CDW picture could be applied.
Any self-consistent interpretation of the MIR peak must take into account the fact that the doped holes tend to order as stripes. Furthermore, the stripe solid melts into a stripe liquid above the charge-ordering temperature,Lee et al. (2002) and so should still have observable effects on the charge excitations at higher temperatures. Given the topological nature of the observed charge stripes, one expects the electronic states associated with them to occur within the charge transfer gap,Zaanen and Gunnarsson (1989); Poilblanc and Rice (1989); Schulz (1990); Zaanen and Oleś (1996); Tchernyshyov and Pryadko (2000); Granath et al. (2002); Lorenzana and Seibold (2002) similar to the soliton states observed in doped polyacetylene.Heeger et al. (1988) Consistent with this concept, it has been observed experimentally that the chemical potential is pinned within the Mott-Hubbard gap for a substantial part of the doping range over which stripe order is observed.Satake et al. (2000) In the case of nickelates, the mid-gap stripe states should be empty Zaanen and Littlewood (1994); Fig. 5(a) shows a schematic density of states. In models appropriate to cuprates, the stripe states are quarter-filled with electrons.Granath et al. (2002) Numerical calculations of optical conductivity for cuprate stripe models (without electron-phonon coupling) yield both a Drude component and one or more MIR peaks.Vergés et al. (1991); Salkola et al. (1996); Machida and Ichioka (1999); Shibata et al. (2001); Moraghebi et al. (2002); Lorenzana and Seibold (A related result has been obtained by Caprara et al.Caprara et al. (2002) using a model of charge collective modes close to a charge-ordering instability.) We would attribute the Drude peak to excitations within the partially-filled mid-gap states. In nickelates at higher temperatures it may be possible to thermally excite carriers into the mid-gap states, resulting in a relatively weak Drude peak.
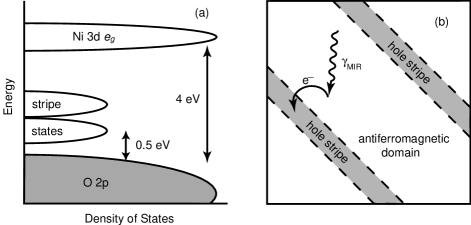
But what about electron-phonon coupling? Static atomic displacements are present in the charge-ordered state,Tranquada et al. (1995) and these presumably occur to lower the energy. An estimate of the energy associated with the lattice displacements is provided by an LDA calculation by Anisimov et al.Anisimov et al. (1992) for a nickelate with a hole concentration of 0.25. Assuming a breathing-mode pattern of in-plane oxygens about the 1/4 of the Ni sites with an extra hole, with a displacement equal to 4% of the bond length, the energy gain is 210 meV. When an electron is excited from the valence band in an antiferromagnetic domain into a mid-gap stripe state [see Fig. 5(b)], the lattice does not have time to relax. As a result, the required excitation energy must be increased beyond the minimum electronic energy by twice the lattice-relaxation energy: once in removing the electron from the antiferromagnetic region and again in adding the electron to a charge stripe. This increase in the excitation energy is known as the Franck-Condon effect. We would expect this “polaronic” energy to appear as a shift of the excitations in the ordered state relative to that in the stripe-liquid state.
If the theoretical estimate of a 4% bond-length relaxation were correct, then we might expect to see a temperature-dependent shift of 0.42 eV. However, the bond-length modulation determined by a fit to superlattice intensitiesTranquada et al. (1995) is approximately 2%. Since the relaxation energy is proportional to the square of the displacement, a better estimate of the shift is 0.1 eV. As we will see below, the latter value is roughly consistent with experiment.
V Optical Conductivity Results and Analysis
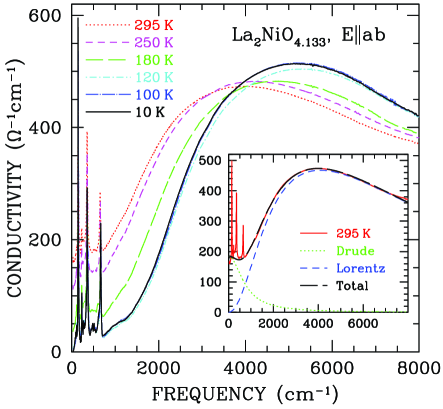
Figure 6 shows the real part of the in-plane optical conductivity. Beyond the sharp phonon peaks that appear below 700 cm-1, one can see that the electronic conductivity is dominated by the MIR peak at eV. The peak shifts to higher energy on cooling from 295 K to 120 K, with no significant change below the latter temperature. The results are qualitatively consistent with previous results,Katsufuji et al. (1996); Pashkevich et al. (2000); Poirot-Reveau et al. (2002) although the size of the shift is closer to that found in La2-xSrxNiO4 with (Ref. Pashkevich et al., 2000) than that with (Ref. Katsufuji et al., 1996).
To quantitatively analyze the data, we have fit the conductivity using a Drude-Lorentz model for the dielectric function:
| (1) |
where and are the classical plasma frequency and damping of the Drude (zero-frequency) component, and , and are the frequency, width and effective plasma frequency of the vibration or electronic component; is the core contribution to the dielectric function. (A similar decomposition was used by Bi and Eklund at room temperature.Bi and Eklund (1993)) The real part of the conductivity is given by . The conductivity amplitude of the contribution is . Four strong phonon modes were included in the model.
An example of fitted Drude and MIR components is presented in the inset of Fig. 6 for K; here cm-1 and cm-1. We find that the electronic conductivity is well described by these two contributions at all temperatures. Now, the MIR peak should involve a convolution of densities of states, and there is no particular reason to expect it to be fitted well by a single Lorentz oscillator. The fact that a single oscillator provides a good fit is a convenient coincidence that simplifies the following analysis. We interpret the width as a measure of the convolved densities of occupied and unoccupied states expected for an interband transition.
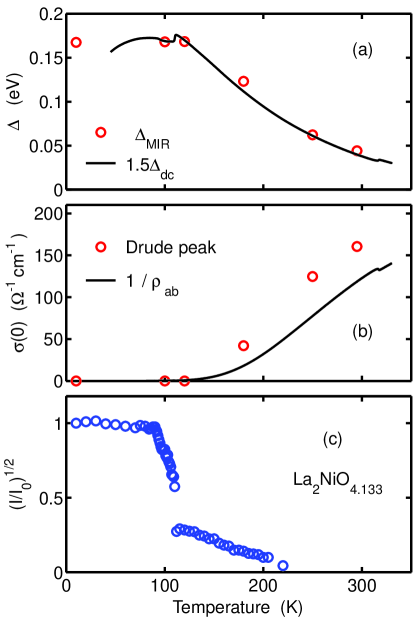
The temperature dependence of the MIR peak energy is plotted in Fig. 7(a) in the form , with eV. The size of the MIR peak shift, 0.1–0.15 eV, is quite comparable to our estimate of the Franck-Condon shift, 0.1 eV, based on the lattice relaxation energy calculated by Anisimov et al.Anisimov et al. (1992) One might expect such a shift to create an optical gap , with . Thermal excitations of charge carriers into the mid-gap states would be limited by this minimum gap; excitations at the MIR peak frequency are not relevant for thermal processes. If a gap of order is present at low temperature in , it is masked by the phonon conductivity; nevertheless, the Drude conductivity and the dc resistivity should be sensitive to such a gap.
The Drude conductivity is shown in Fig. 7(b). On warming, it rises from zero as the MIR peak shifts to lower energy. The solid line in Fig. 7(b) represents the inverse of . The temperature dependence of the dc conductivity (inverse resistivity) is consistent with the fitted Drude component. Assuming that the Drude conductivity arises from thermal excitation of carriers across , we expect the dc resistivity to behave roughly as
| (2) |
so that
| (3) |
The solid line in Fig. 7(a) shows the temperature dependence of obtained from , where we have set m cm, a value somewhat lower than the minimum observed resistivity (see Fig. 1). When scaled by a factor of 1.5, agrees well with .
By choosing a plausible , we have extracted from the resistivity a gap that is comparable to . This is consistent with our argument that the shift results from the Franck-Condon effect. But how does the temperature dependence of the energy shift compare with the actual lattice displacements?
The intensity of a charge-order superlattice peak measured by neutron diffraction is proportional to the square of the lattice displacement. In Fig. 7(c) we have plotted the square-root of such an intensity measurement.Wochner et al. (1998) (The choice of taking the square-root was made to enhance the signal at higher temperatures.) The gradual decrease in the shift energy above the 110-K transition is qualitatively consistent with the decay in magnitude of the lattice displacements. The contrasting behavior observed by Katsufuji et al.Katsufuji et al. (1996) in La1.67Sr0.33NiO4, where the energy-shift was found to exhibit a BCS-like temperature dependence, corresponds with the critical behavior observed in the superlattice intensities by diffraction studies on that compound.Lee and Cheong (1997); Du et al. (2000)
The feature in Fig. 7 that, on first glance, seems inconsistent is the jump in superlattice intensity at the 110-K spin ordering transition—it is certainly not reflected in the optical energy shift. The discrepancy becomes less significant when one realizes that local lattice displacements are not the only factor involved in stabilizing the charge stripes. At the first-order 110-K transition, there is a jump in the ordering wave vector at the transition; the charge stripes are commensurate with the interstitial lattice above the transition, but become effectively incommensurate below.Wochner et al. (1998) In the commensurate phase, the stripes are stabilized by alignment with the Coulomb potential of the interstitials, in addition to the local lattice relaxation. In the incommensurate phase at lower temperatures, the Coulomb stabilization is lost, but the incommensurate phase is favored by the reduction in energy from the ordering of the magnetic moments. In terms of screening the charge stripes, the loss of the interstitial Coulomb energy is balanced by the increase in lattice displacements. Thus, it seems reasonable that the energy shift of the MIR peak is insensitive to the transition at 110 K.
The magnitude of the MIR peak shift we observe is comparable to that found in La2-xSrxNiO4 with (Ref. Pashkevich et al., 2000) and (Ref. Jung et al., 2001), where the stripe order is incommensurate.Tranquada et al. (1996); Kajimoto et al. In contrast, the shift is larger (0.26 eV) for the composition, where the order is commensurate.Katsufuji et al. (1996) In the commensurate case, it seems likely that the lattice displacements and the Coulomb energy work together, resulting in an enhanced Franck-Condon energy.
Finally, we note that the electronic dynamical conductivity along the axis (see inset of Fig. 3) remains negligible at all temperatures. This result provides credibility to our assumption that the electronic excitations probed with are confined within the two-dimensional NiO2 planes. The insulating behavior along the -axis together with finite conductivity within the planes is reminiscent of cuprate superconductors in the pseudogap regime.Homes et al. (1993b)
VI Summary and Discussion
We have presented a study of the optical conductivity in La2NiO4.133. While the data are qualitatively similar to those reported for La2-xSrxNiO4, we have introduced a new interpretation of the electronic conductivity. In particular, we have shown that can be decomposed into the MIR peak, a contribution that is always gapped, and a Drude component that appears at higher temperatures. The two components are consistent with theoretical expectations for the electronic structures associated wiht a stripe-ordered system. Associated with the charge stripes are mid-gap states that, in the case of nickelates, are empty at low temperature. Transitions from the filled valence band to the empty mid-gap states yield the MIR peak. Thermal excitation of carriers into the mid-gap states at higher temperature results in the Drude peak. The temperature-dependent frequency shift of the MIR peak is consistent with a Franck-Condon effect that is dependent on the degree of stripe order.
The electronic structure associated with stripes is inhomogeneous in real space. Thus, the MIR excitation is likely to involve moving an electron from an antiferromagnetic region into a hole stripe, as indicated in Fig. 5(b). Thinking in terms of holes, the transition involves a hole hopping off of a stripe, forming a local fluctuation of that stripe. The connection between stripe fluctuations and conductivity (or hole motion) has been explored in a number of theoretical studies of stripe models relevant to the cuprates.Tchernyshyov and Pryadko (2000); Zaanen et al. (2001); Chernyshev et al. (2000); Lorenzana and Seibold For the insulating stripes in the nickelates, finite conductivity correlates with disordering of the stripes.
The charge stripes in cuprates are partially filled with electrons, so that Drude-like conduction should be possible even when the stripes are ordered. This appears to be the case in La2-x-yNdySrxCuO4 based on transportNoda et al. (1999) and IRTajima et al. (1999); Dumm et al. (2002) studies. Comparisons of the MIR conductivity in the nickelates with that in cuprates have been made previously.Bi et al. (1990); Ido et al. (1991); Bi and Eklund (1993) A two-component analysis (DrudeMIR), though controversial, has been applied to measurements on cuprates where stripes have not been directly detected, such as Bi2Sr2CaCu2O8 and Bi2Sr2CuO6 (Ref. Romero et al., 1992; Lupi et al., 2000). We note that the values of at room temperature for those samples, 480 cm-1 and 690 cm-1 respectively, are not greatly different from the value of 800 cm-1 for our nickelate sample. On a related point, Ando et al.Ando et al. (2001) have shown that in La2-xSrxCuO4, where stripes are believed to be relevant, the charge mobility at a given temperature changes by only a very modest amount from the underdoped to optimally doped regimes, and that it is quite similar in YBa2Cu3O6+x. The stripe-based interpretation is certainly not the only one that one can imagine applying to the cuprates, but the similarities between measurements on cuprates and on the stripe-ordered nickelates lend considerable support to this interpretation.
Acknowledgements
We would like to thank S. A. Kivelson, V. Perebeinos, D. N. Basov, M. Strongin, S. Brazovskii, A. L. Chernyshev, R. Werner, T. M. Rice, S. Uchida, and J. Zaanen for helpful discussions. Research at Brookhaven is supported by the Department of Energy’s (DOE) Office of Science under Contract No. DE-AC02-98CH10886. DJB acknowledges support from DOE under Contract No. DE-FG02-00ER45800.
References
- Bi et al. (1990) X.-X. Bi, P. C. Eklund, E. McRae, J.-G. Zhang, P. Metcalf, J. Spalek, and J. M. Honig, Phys. Rev. B 42, 4756 (1990).
- Ido et al. (1991) T. Ido, K. Magoshi, H. Eisaki, and S. Uchida, Phys. Rev. B 44, 12094 (1991).
- Katsufuji et al. (1996) T. Katsufuji, T. Tanabe, T. Ishikawa, Y. Fukuda, T. Arima, and Y. Tokura, Phys. Rev. B 54, R14230 (1996).
- Bi and Eklund (1993) X.-X. Bi and P. C. Eklund, Phys. Rev. Lett. 70, 2625 (1993).
- Eagles et al. (1995) D. M. Eagles, R. P. S. M. Lobo, and F. Gervais, Phys. Rev. B 52, 6440 (1995).
- Calvani et al. (1996) P. Calvani, A. Paolone, P. Dore, S. Lupi, P. Maselli, P. G. Medaglia, and S.-W. Cheong, Phys. Rev. B 54, R9592 (1996).
- Bäuml et al. (1998) B. Bäuml, G. Wellein, and H. Fehske, Phys. Rev. B 58, 3663 (1998).
- Jung et al. (2001) J. H. Jung, D.-W. Kim, T. W. Noh, H. C. Kim, H.-C. Ri, S. J. Levett, M. R. Lees, D. M. Paul, and G. Balakrishnan, Phys. Rev. B 64, 165106 (2001).
- Tsutsui et al. (1999) K. Tsutsui, W. Koshibae, and S. Maekawa, Phys. Rev. B 59, 9729 (1999).
- Crandles et al. (1993) D. A. Crandles, T. Timusk, J. D. Garret, and J. E. Greedan, Physica C 216, 94 (1993).
- Pashkevich et al. (2000) Y. G. Pashkevich, V. A. Blinkin, V. P. Gnezdilov, V. V. Tsapenko, V. V. Eremenko, P. Lemmens, M. Fischer, M. Grove, G. Günderodt, L. Degiorgi, et al., Phys. Rev. Lett. 84, 3919 (2000).
- Katsufuji et al. (1999) T. Katsufuji, T. Tanabe, T. Ishikawa, S. Yamanouchi, Y. Tokura, T. Kakeshita, R. Kajimoto, and H. Yoshizawa, Phys. Rev. B 60, R5097 (1999).
- Lee and Cheong (1997) S.-H. Lee and S.-W. Cheong, Phys. Rev. Lett. 79, 2514 (1997).
- Tranquada et al. (1994) J. M. Tranquada, D. J. Buttrey, V. Sachan, and J. E. Lorenzo, Phys. Rev. Lett. 73, 1003 (1994).
- Tranquada (1998) J. M. Tranquada, in Neutron Scattering in Layered Copper-Oxide Superconductors, edited by A. Furrer (Kluwer, Dordrecht, The Netherlands, 1998), p. 225.
- Yoshizawa et al. (2000) H. Yoshizawa, T. Kakeshita, R. Kajimoto, T. Tanabe, T. Katsufuji, and Y. Tokura, Phys. Rev. B 61, R854 (2000).
- Lee et al. (2002) S.-H. Lee, J. M. Tranquada, K. Yamada, D. J. Buttrey, Q. Li, and S.-W. Cheong, Phys. Rev. Lett. 88, 126401 (2002).
- Wochner et al. (1998) P. Wochner, J. M. Tranquada, D. J. Buttrey, and V. Sachan, Phys. Rev. B 57, 1066 (1998).
- Tranquada et al. (1995) J. M. Tranquada, J. E. Lorenzo, D. J. Buttrey, and V. Sachan, Phys. Rev. B 52, 3581 (1995).
- Granath et al. (2002) M. Granath, V. Oganesyan, D. Orgad, and S. A. Kivelson, Phys. Rev. B 65, 184501 (2002).
- Heeger et al. (1988) A. J. Heeger, S. Kivelson, J. R. Schrieffer, and W.-P. Su, Rev. Mod. Phys. 60, 781 (1988).
- Tchernyshyov and Pryadko (2000) O. Tchernyshyov and L. P. Pryadko, Phys. Rev. B 61, 12503 (2000).
- Zaanen and Gunnarsson (1989) J. Zaanen and O. Gunnarsson, Phys. Rev. B 40, 7391 (1989).
- Zaanen and Oleś (1996) J. Zaanen and A. M. Oleś, Ann. Phys. (Leipzig) 5, 224 (1996).
- Poilblanc and Rice (1989) D. Poilblanc and T. M. Rice, Phys. Rev. B 39, 9749 (1989).
- Schulz (1990) H. J. Schulz, Phys. Rev. Lett. 64, 1445 (1990).
- Lorenzana and Seibold (2002) J. Lorenzana and G. Seibold, Phys. Rev. Lett. 89, 136401 (2002).
- Ichikawa et al. (2000) N. Ichikawa, S. Uchida, J. M. Tranquada, T. Niemöller, P. M. Gehring, S.-H. Lee, and J. R. Schneider, Phys. Rev. Lett. 85, 1738 (2000).
- Tajima et al. (1999) S. Tajima, N. L. Wang, N. Ichikawa, H. Eisaki, S. Uchida, H. Kitano, T. Hanaguri, and A. Maeda, Europhys. Lett. 47, 715 (1999).
- Noda et al. (1999) T. Noda, H. Eisaki, and S. Uchida, Science 286, 265 (1999).
- Dumm et al. (2002) M. Dumm, D. N. Basov, S. Komiya, Y. Abe, and Y. Ando, Phys. Rev. Lett. 88, 147003 (2002).
- Rice and Buttrey (1993) D. E. Rice and D. J. Buttrey, J. Solid State Chem. 105, 197 (1993).
- Buttrey et al. (1995) D. J. Buttrey, R. R. Schartman, and J. M. Honig, Inorg. Synth. 30, 130 (1995).
- Tranquada et al. (1997) J. M. Tranquada, P. Wochner, A. R. Moodenbaugh, and D. J. Buttrey, Phys. Rev. B 55, R6113 (1997).
- Homes et al. (1993a) C. C. Homes, M. Reedyk, D. Crandles, and T. Timusk, Appl. Opt. 32, 2972 (1993a).
- (36) P. Wochner, J. M. Tranquada, C. S. Nelson, J. P. Hill, D. Gibbs, and D. J. Buttrey, (unpublished).
- Pellegrin et al. (1996) E. Pellegrin, J. Zaanen, H.-J. Lin, G. Meigs, C. T. Chen, G. H. Ho, H. Eisaki, and S. Uchida, Phys. Rev. B 53, 10667 (1996).
- Satake et al. (2000) M. Satake, K. Kobayashi, T. Mizokawa, A. Fujimori, T. Tanabe, T. Katsufuji, and Y. Tokura, Phys. Rev. B 61, 15515 (2000).
- Zaanen and Littlewood (1994) J. Zaanen and P. B. Littlewood, Phys. Rev. B 50, 7222 (1994).
- Salkola et al. (1996) M. Salkola, V. J. Emery, and S. A. Kivelson, Phys. Rev. Lett. 77, 155 (1996).
- Vergés et al. (1991) J. A. Vergés, E. Louis, P. S. Lomdahl, F. Guinea, and A. R. Bishop, Phys. Rev. B 43, 6099 (1991).
- Machida and Ichioka (1999) K. Machida and M. Ichioka, J. Phys. Soc. Japan 68, 2168 (1999).
- Shibata et al. (2001) Y. Shibata, T. Tohyama, and S. Maekawa, Phys. Rev. B 64, 054519 (2001).
- Moraghebi et al. (2002) M. Moraghebi, S. Yunoki, and A. Moreo, Phys. Rev. B 66, 214522 (2002).
- (45) J. Lorenzana and G. Seibold, Phys. Rev. Lett. 90, 066404 (2003).
- Caprara et al. (2002) S. Caprara, C. Di Castro, S. Fratini, and M. Grilli, Phys. Rev. Lett. 88, 147001 (2002).
- Anisimov et al. (1992) V. I. Anisimov, M. A. Korotin, J. Zaanen, and O. K. Andersen, Phys. Rev. Lett. 68, 345 (1992).
- Poirot-Reveau et al. (2002) N. Poirot-Reveau, P. Odier, P. Simon, and F. Gervais, Phys. Rev. B 65, 094503 (2002).
- Du et al. (2000) C.-H. Du, M. E. Ghazi, Y. Su, I. Pape, P. D. Hatton, S. D. Brown, W. G. Stirling, M. J. Cooper, and S.-W. Cheong, Phys. Rev. Lett. 84, 3911 (2000).
- Tranquada et al. (1996) J. M. Tranquada, D. J. Buttrey, and V. Sachan, Phys. Rev. B 54, 12318 (1996).
- (51) R. Kajimoto, K. Ishizaka, H. Yoshizawa, and Y. Tokura, Phys. Rev. B 67, 014511 (2003).
- Homes et al. (1993b) C. C. Homes, T. Timusk, R. Liang, D. A. Bonn, and W. N. Hardy, Phys. Rev. Lett. 71, 1645 (1993b).
- Zaanen et al. (2001) J. Zaanen, O. Y. Osman, H. V. Kruis, Z. Nussinov, and J. Tworzydło, Phil. Mag. B 81, 1485 (2001).
- Chernyshev et al. (2000) A. L. Chernyshev, A. H. Castro Neto, and A. R. Bishop, Phys. Rev. Lett. 84, 4922 (2000).
- Romero et al. (1992) D. B. Romero, C. D. Porter, D. B. Tanner, L. Forro, D. Mandrus, L. Mihaly, G. L. Carr, and G. P. Williams, Phys. Rev. Lett. 68, 1590 (1992).
- Lupi et al. (2000) S. Lupi, P. Calvani, M. Capizzi, and P. Roy, Phys. Rev. B 62, 12418 (2000).
- Ando et al. (2001) Y. Ando, A. N. Lavrov, S. Komiya, K. Segawa, and X. F. Sun, Phys. Rev. Lett. 87, 017001 (2001).