ESR Study of (C5H12N)2CuBr4
Abstract
ESR studies at 9.27, 95.4, and 289.7 GHz have been performed on (C5H12N)2CuBr4 down to 3.7 K. The 9.27 GHz data were acquired with a single crystal and do not indicate the presence of any structural transitions. The high frequency data were collected with a polycrystalline sample and resolved two absorbances, consistent with two crystallographic orientations of the magnetic sites and with earlier ESR studies performed at 300 K. Below T, our data confirm the presence of a spin singlet ground state.
keywords:
(C5H12N)2CuBr4, ESR, spin ladder, , , , , ,
Recently, a considerable amount of attention has been focused on the properties of quantum spin liquids [1, 2]. Herein, we report the results of ESR studies of (C5H12N)2CuBr4, hereafter BPCB, which has been identified as a magnetic two-leg ladder in the strong coupling limit [3]. The crystal structure of BPCB has been determined at 300 K to be monoclinic, and the Cu2+ ions are stacked in pairs that form a ladder-like structure [4]. The magnetization possesses two critical fields, T and T, that were calculated from exchange interactions along the legs ( K) and along the rungs ( K). Our motivation was to investigate the excitation spectrum of BPCB in different regions of its phase diagram.
The 9.27 GHz ESR work utilized standard X-band techniques [3]. The high frequency measurements used a transmission-probe equipped with a millimeter and sub-millimeter wavelength band spectrometer with oversized waveguides [5] and operated in a Faraday configuration down to 3.7 K.
For the 9.27 GHz work, a powder sample and a 18.6 mg single crystal specimen were measured at 300 K and between K, respectively. For the single crystal, was oriented along the c-axis. Two different samples were used for the high frequency studies, and both yielded similar results. Each of the samples consisted of a polycrystalline plate-like piece. Neutron studies on similar pieces showed that the constituent crystallites are generally oriented with the b-axis perpendicular to the plane of the larger plate. For the high frequency studies, was oriented perpendicular to the plates, or generally parallel to the crystallographic b-axis. All of the samples were taken from the same batch as used previously [3].
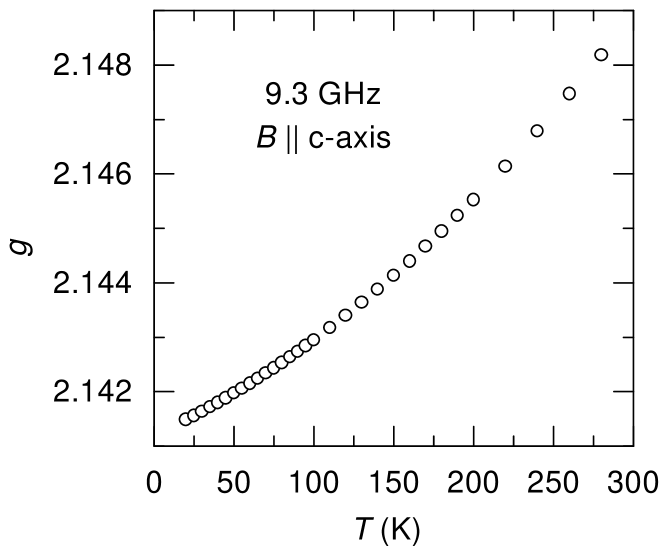
At 9.27 GHz, the 300 K results were consistent with the previously reported work [4], i.e. (powder) = 2.13 and (c-axis) = 2.148. For the single crystal study, a single ESR line was observed at all temperatures, and the temperature dependence of the value is shown in Fig. 1. These data do not suggest the presence of a structural transition, and this result is consistent with neutron scattering studies [3].

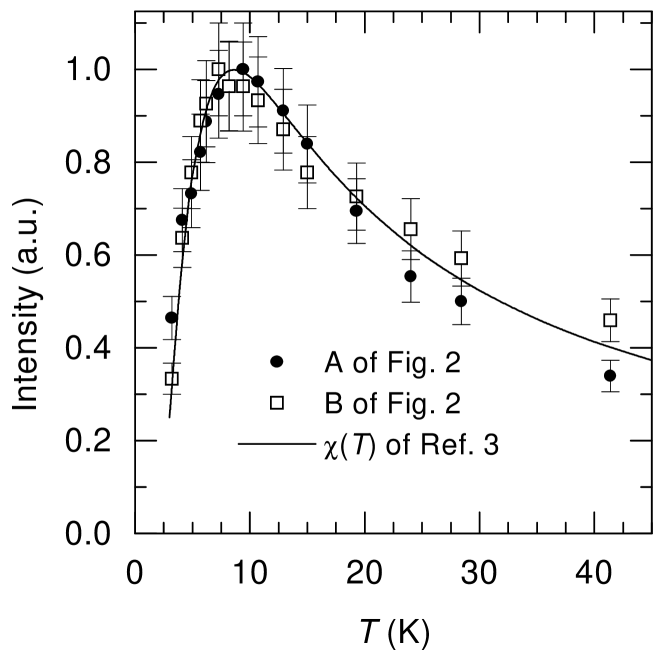
Typical results obtained at 95.4 GHz are shown in Fig. 2, where two absorption lines are observed. Assuming that these ESR spectra are predominantly probing the b-c∗ plane, then these results can be extrapolated to low fields, i.e. 0.3 T, where the lines merge and reproduce the previously reported spectra [4]. The integrated intensities of these absorption lines were obtained by using a Lorentzian lineshape to fit the data, and the temperature dependences of these intensities are shown in Fig. 3. Within the uncertainties, the temperature dependences of both lines are the same and similar to the results obtained from T). The data are consistent with a spin singlet ground state that is separated from the first excited triplet by an energy gap of K. It is important to note that these spectra were collected below the first critical field, T [3]. It is noteworthy that one absorption line, A, corresponding to , does not change its position over the temperature range K, while line B shifts from at 3.7 K to at 42 K.
The ESR spectra at 289.7 GHz, where are shown in Fig. 4. In this regime, the intensities of the lines increase with decreasing temperature, and this behavior is consistent with the magnetic field closing of the energy gap.
A detailed interpretation of the high frequency results is difficult because the specimens were not single crystals. Since Patyal et al. [4] worked only at 300 K, a comparison to the temperature dependences of the values is not available. In summary, our results are consistent with earlier work [3, 4], and a complete analysis of the ESR spectra requires data from single crystals cooled to below the lowest exchange interaction, K.
This work was supported, in part, by NSF DMR-0084173 for the NHFML and the ACS-PRF 36163-AC5. We have benefited from conversations with K.A. Abboud, J. C̆ernák, and G.E. Granroth.
References
- [1] E. Dagotto, Rep. Prog. Phys. 62 (1999) 1525.
- [2] S. Wessel et al., Phys. Rev. Lett. 87 (2001) 206407.
-
[3]
B. C. Watson et al., Phys. Rev. Lett.
86 (2001) 5168.
B. C. Watson, Ph.D. thesis, University of Florida (2000). - [4] B. R. Patyal et al., Phys. Rev. B 41 (1990) 1657.
- [5] A. K. Hassan et al., J. Magn. Reson. 142 (2000) 300.