Optimization potential of a real highway network: an empirical study
Abstract
Empirical observations and theoretical studies indicate that the overall travel-time of vehicles in a traffic network can be optimized by means of ramp metering control systems. Here, we present an analysis of traffic data of the highway network of North-Rhine-Westfalia in order to identify and characterize the sections of the network which limit the performance, i.e., the bottlenecks. It is clarified whether the bottlenecks are of topological nature or if they are constituted by on-ramps. This allows to judge possible optimization mechanisms and reveals in which areas of the network they have to be applied.
pacs:
45.70, 05.60, 02.501 Introduction
In the last few years, the increasing amount of vehicular traffic has led to a more and more oversaturated freeway network. In contrast to the past, it is no longer possible to react on this additional amount of traffic by construction of new highways. Therefore, in order to use the existing network more efficiently, several control strategies like signal control, variable message signs, route guidance, motorway-to-motorway control and ramp metering (Papageorgiou, 1995) have been proposed for the optimization of the highway’s performance and for the amelioration of the system’s traffic state.
Empirical studies of parts of a highway network (Salem, 1995) have revealed the benefits of ramp metering strategies for the total mean speed and the total travel-time for both, the vehicles on the highway and the queuing vehicles on the on-ramp. These empirical findings are underscored by several theoretical investigations of simplified (Kolomeisky, 1998; Appert, 2001) as well as well as of more realistic (Popkov, 2001; Huberman, 1999; Barlovic, submitted) traffic models. In particular, studies of the asymmetric simple exclusion process reveal the existence of a maximal current phase which obviously is the most desirable state. It can be obtained for large input and small output rates and allows to operate a highway in the optimal regime. The possible capacity gain is even higher in more realistic models which reproduce the empirically observed meta-stable high-flow states. In finite systems these states are temporally quite stable and, therefore, it seems to be possible to optimize at least short highway sections in this manner.
Moreover, in (Huberman, 1999), a simple simulation setup consisting of a two-lane highway segment with an on-ramp is presented. It has been shown that the travel-time of all vehicles can be optimized at a finite injection rate of the on-ramp in the sense that its variance is minimized.
This improvement of the system’s throughput can be explained by considering fluctuations of the traffic flow. Obviously, free flow is the most desirable traffic state since large flows can be obtained. However, at increasing traffic demand, synchronized traffic forms in the vicinity of on-ramps, which enables a large amount of vehicles to drive with a velocity considerably larger than in a jam but smaller than in free flow, and leads to a flow comparable to free flow (Kerner, 2001). Synchronized states are not very stable, i.e., already small perturbations can cause wide jams. The importance of synchronized traffic for an optimized usage of the network capacity is due to its role as a precursor of traffic jams: If synchronized traffic is observed at a bottleneck control mechanisms will help to stabilize this phase and, thus, ensure large throughputs of the highway at large densities. In particular, by means of ramp metering, it is possible to tune the injection rate of the on-ramp in order to affect the vehicle-vehicle interactions. Increasing the interactions will improve the vehicle coupling and help to synchronize them (Ariaratnam, 2001), however, strong interactions lead to perturbations of the flow and, thus, to wide jams. The variation of the on-ramp flow therefore helps to adjust the interactions and to stabilize the synchronized state. As a result, the perturbations are minimized, and the performance of the highway is optimized.
In this study we present an extensive analysis of a highway network which gives insight about the spreading of jams in the network. In contrast to former analyses which are restricted to only small parts of a highway system, here, the coverage of the network with inductive loops allows to analyse the overall traffic state on a global scale. This enables us to identify and characterize its bottlenecks. In particular, the question is raised whether bottlenecks are of topological nature or if they are constituted by on-ramps with a large inflow. Topological bottlenecks are static whereas dynamical bottlenecks (like ramps) in principle can be influenced externally, e.g., by controlling their strength. Moreover, the properties of the bottlenecks may give evidence if the network’s state can be optimized by local control devices only or whether global traffic management strategies are necessary (Brockfeld, 2001).
2 Network characteristics
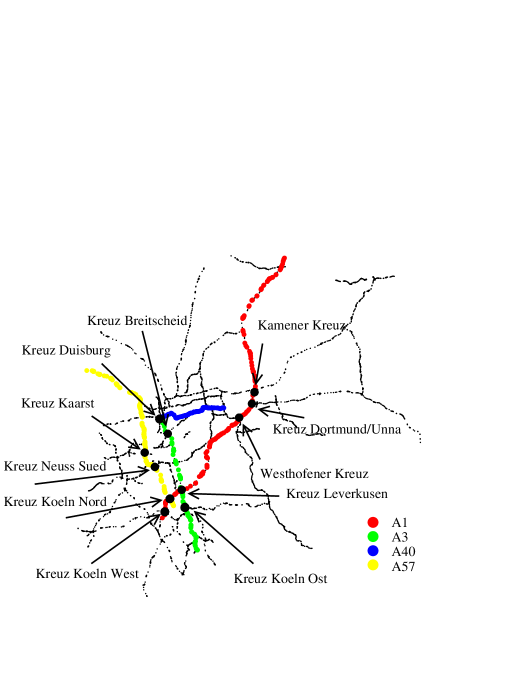
We examine the highway network of North Rhine-Westfalia (see Fig. 1 for a sketch of the network) which has a total length of about and includes highway intersections and on- and off-ramps. The data set is provided by about inductive loops which send minute aggregated data of the flow, the occupancy and the velocity online (that is every minute) via permanent lines from the traffic control centers in Recklinghausen and in Leverkusen. For the sake of simple data handling, the driving directions are classified into south/west and north/east.
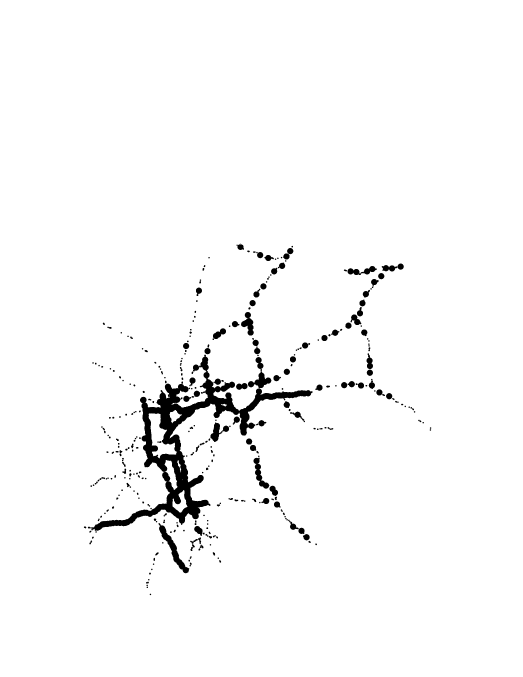
As one can see in Fig. 2, most of the detectors are concentrated on the inner network. This is justified by the distribution of the traffic volume, as we will show later. The recording of the data started on 10-10-2000. For the analysis of the network, a period of days from 10-10-2000 to 07-01-2001 was considered.
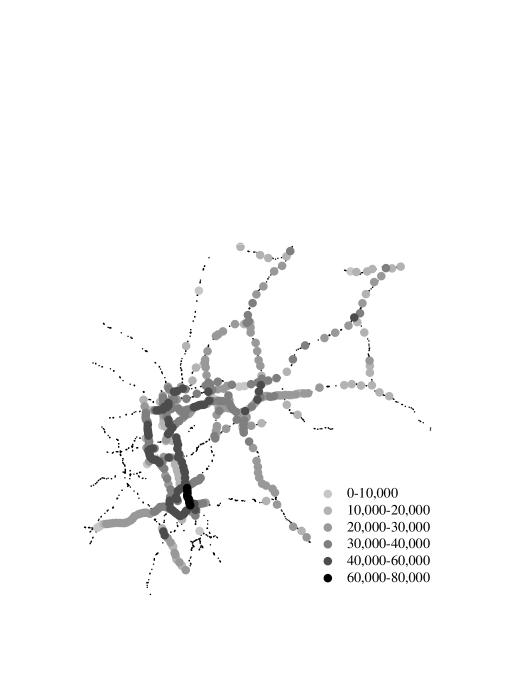
The highway network of North Rhine-Westfalia has an average traffic load of about veh/24h per measurement section for one driving direction. Note that the traffic volume is calculated per measurement section and thus sums the flow of two or three lanes. However, there are large differences between the highways (Fig. 3). Obviously, only a few sections with very large traffic volumes exist which concentrate on the main urban areas. In detail, the Kölner Ring, especially the section between the highway intersections Kreuz Leverkusen and Kreuz Köln Ost, large parts of the A3 and the A40, the A57 near Neuss and the A2 near the highway intersection Kreuz Duisburg have an average load of veh/24h. The more the highways leave these conurbations, the less is the traffic volume which can be measured. In addition, nearly the same values of the traffic volumes can be found for both, the driving directions south/west and north/east.
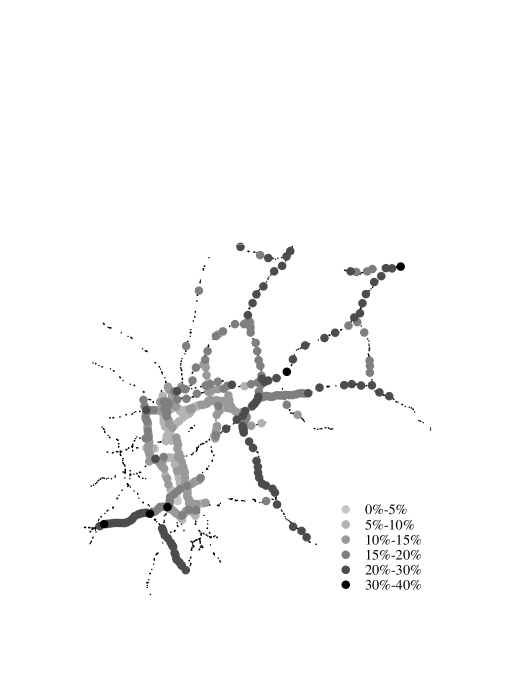
About of the vehicles are trucks. Fig. 4 shows the distribution of the relative number of trucks per measurement section. Obviously, the share of trucks on the traffic volume increases with the distance to the conurbations, while the absolute number of trucks does not change significantly on the main highways. Thus, the long-distance traffic is mainly dominated by trucks, while at short distances commuter traffic leads to large traffic loads of the network.
3 Bottleneck localization
Since the traffic volumes are simple integrated quantities, it is possible that a large traffic volume can indicate that a two-lane road is often jammed, while the capacity of a three-lane road is still not reached. Therefore, in order to allow an evaluation of the traffic load, the probability to find a jam is calculated. This has the advantage that traffic volumes which are larger than the highway capacity can be related directly to a large jam probability, and thus bottlenecks of the highway network can clearly be identified. Due to the size of the analysed data set it is necessary to introduce a simple criterion to identify jams. Our criterion is the following: If the density of at least one minute is larger than (the density is given as occupancy which is the percentage of time a detector is covered by a vehicle), a jam is supposed. This criterion was motivated by former empirical studies (Knospe, 2002) that indicated that densities higher than are typically neither observed in free-flow nor in synchronized traffic. The threshold value as well as the chosen time interval are, of course, somehow arbitrary. Our results are, however, rather insensitive upon an increase of the density threshold. By contrast, longer time intervals may lead to problems, because jams are often not compact but include regions of free flow traffic. This implies that the density threshold has to be lowered if longer time intervals are used, but lower density threshold lead to problems in discriminating between jams and synchronized traffic.
The usage of the density as an indicator for a jam has some advantages compared to the mean velocity and the flow. First, the flow as well as the velocity depend on speed limits which vary in the network. Therefore, it is not possible to distinguish whether a small velocity is due to a large density or a speed limit. Second, a small flow can refer to both a jam or just free flow with only a few cars. The jam probability is therefore calculated as the relation of the number of days a jam was found to the total number of days of the observation period ( days).
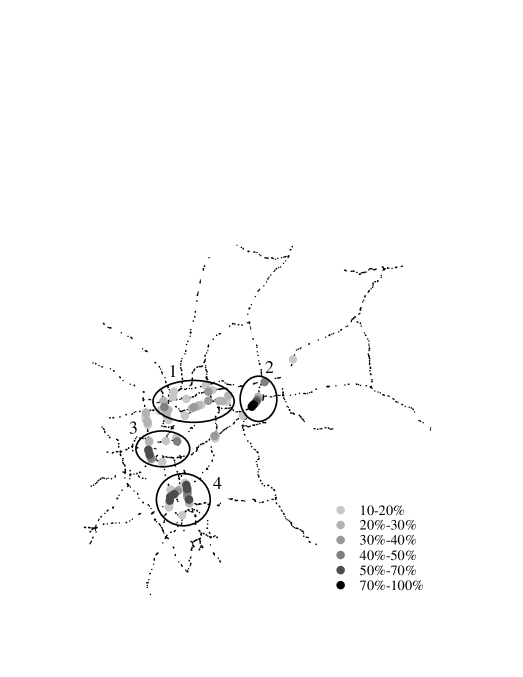
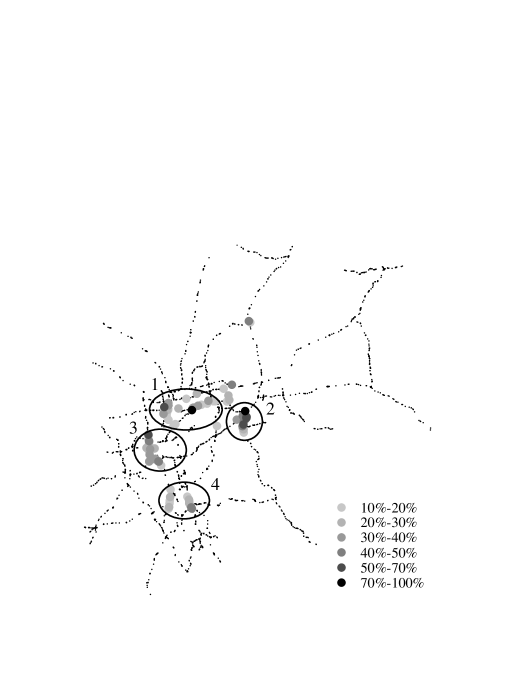
Fig. 5 represents the jam probability of the network for the driving direction south/west. Obviously, large jam probabilities can be found in a region of the inner network, where the conurbations of the Ruhrgebiet (region 1), the areas of Dortmund (region 2), Düsseldorf and Krefeld (region 3) and Köln (region 4) are located. As one can see in Fig. 2, most of the inductive loops are concentrated in this regions, which are indeed the most crowded sectors of the network. In contrast, in regions which are less equipped with counting devices, only few jams can be found.
Large differences of the jam probability between the areas can be observed. Only of the observation days were jammed in the area of the Ruhrgebiet (region 1), that is every third day a jam occurred. In contrast, in the areas of Dortmund (region 2), Krefeld and Düsseldorf (region 3) and Köln (region 4), more than of the days showed jams. Especially in the area of Dortmund, between the Westhofener Kreuz and the Kreuz Dortmund/Unna, nearly days a weak jams can be measured.
Next, we analyse when the jams typically occur. First, we expect significant differences between the weekend and working days.
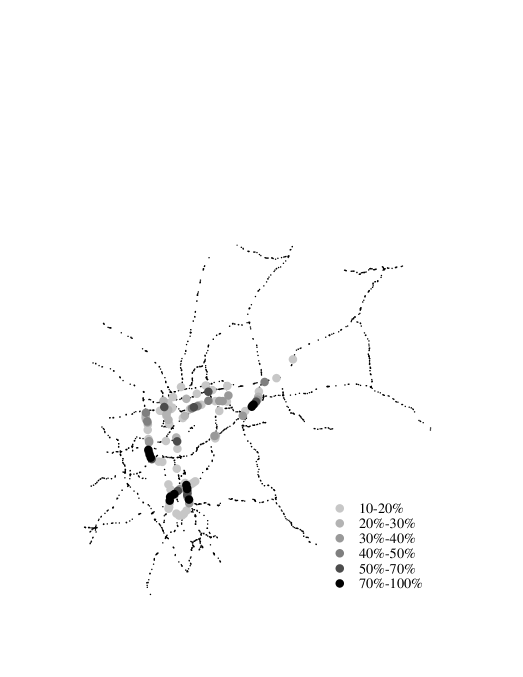
Indeed, the exclusion of weekends leads to an increased jam probability on weekdays compared to the probability averaged over the whole observation period. Second, we regarded the daily variations of the jam probabilities. During the week from monday to friday only minor differences in the jam probability exist, but one has to distinguish the period from monday to thursday and the friday as we will show below. The jam probabilities we obtained are qualitatively the same as in case of an average over the whole data set (see Fig. 6), the same four regions show a large jam probability that is the Ruhrgebiet and the areas of Dortmund, Krefeld and Düsseldorf and Köln. The actual value of the jam probability, however, is increased and the difference to the remainder of the network is now more pronounced. During the weekend the jam probability is considerably reduced. Nevertheless, there are a few locations in the network where high jam probabilities can be observed on sundays, i.e., between the Westhofener Kreuz and the Kreuz Dortmund/Unna. Remarkably the same classification scheme was found to be appropriate for city data as discussed in (Chrobok, 2000; Chrobok, 2001).
Next, we analyse the intraday variations of the data set. We further divided the time-series into five time intervals, in order to capture the main rush-hours. The first interval covers the time from to a.m., the second interval from to a.m., the third interval from a.m. to p.m., the fourth interval from to p.m. and the fifth interval from to p.m. Indeed, the division of a day is somehow arbitrary, but a finer discretization of a day will not change the results significantly. Moreover, analyses of city data revealed the existence of basically two rush-hour peaks in the time-series of the traffic volume at about a.m. and p.m. (Chrobok, 2000; Chrobok, 2001).
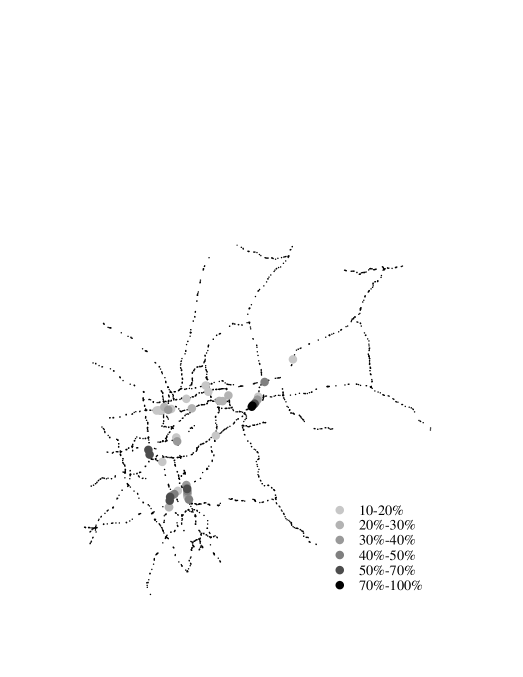
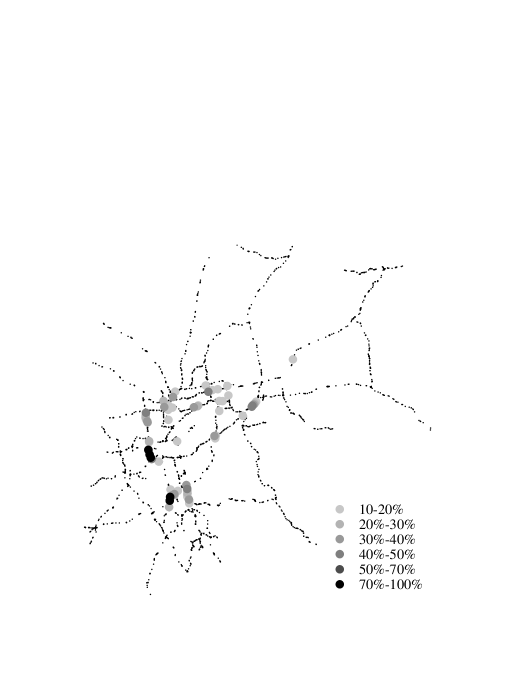
Figures 7 and 8 show the jam probability of the whole data set in the driving direction south/west for two time intervals. During the first time interval, that is to a.m., no jams could be measured. The main traffic volume occurs in the second and in the fourth interval, which include the rush-hours. From a.m. to p.m. only a few jams are visible, while from p.m. to p.m. just one region shows jams, namely the region between the Westhofener Kreuz and the Kreuz Dortmund/Unna. The jams therefore occur mainly in the morning and afternoon rush-hours. There are, however, parts of the network where the load is so large, that the probability to find a jam is high throughout the whole day.
The same picture can be drawn from the analysis of the data set classified in single days which are divided into the five time intervals. Due to the exclusion of the weekends, the values of the jam probability increase significantly. The main disturbances of the network can be measured in the rush-hours, while the regions and show continuously a large traffic load. Again, there are only small differences between the weekdays. On fridays on the one hand, the load of the network in the time between and a.m. is smaller, but, on the other hand, is increased significantly between and p.m. compared to monday to thursday. Moreover, on sundays, the large jam probability in the area of Dortmund can be traced back to congestions between to p.m.
Analogously to the analysis of the data of the driving direction south/west, the jam probability is calculated for the direction north/east (Fig. 9). Like for the driving direction south/west, the same regions with large jam probabilities occur which can be identified as the conurbations of the Ruhrgebiet (region 1), the areas of Dortmund (region 2), Krefeld and Düsseldorf (region 3) and Köln (region 4). In contrast, the region of the Ruhrgebiet (region 1) and the area Krefeld and Düsseldorf (region 3) have a larger jam probability in the direction north/east, while in the direction south/west the area of Köln (region 4) shows a larger traffic volume. In the area of Dortmund (region 2), a large jam probability can be found in the south of the Westhofener Kreuz. Because north of the Westhofener Kreuz in the driving direction south a large jam probability was measured, too, one can clearly identify the Westhofener Kreuz as a dominant bottleneck.
Again, the distinction between the days shows no difference to the analysis of the whole observation period with the exception of a larger jam probability in the single regions. In addition, the main traffic volume can be measured in the morning and afternoon rush-hours.
4 Spatial extension of jams
Calculating the jam probability in the four regions, one can observe that consecutive measurement sections are often jammed even at the same time, which may be a consequence of jams that have a large spatial extension. However, as one can see further, a sequence of jammed detectors is always restricted by highway intersections, not by on- and offramps. But more importantly a jam which branches from one highway to another highway via an intersection has been observed only in one case (see below).
In order to determine the spatial extension of a jam, it is necessary to consider its temporal occurrence: If for a given day a jam was detected at a detector, the detector is considered to be active (1) if not as being passive (0). In this way we generated a binary time-series which allows the calculation of the spatial correlation between different measurement locations. The explicit calculation of the correlation of the density time-series, in contrast, has the disadvantage that the duration of jams decreases in upstream direction, which leads to vanishing correlations.
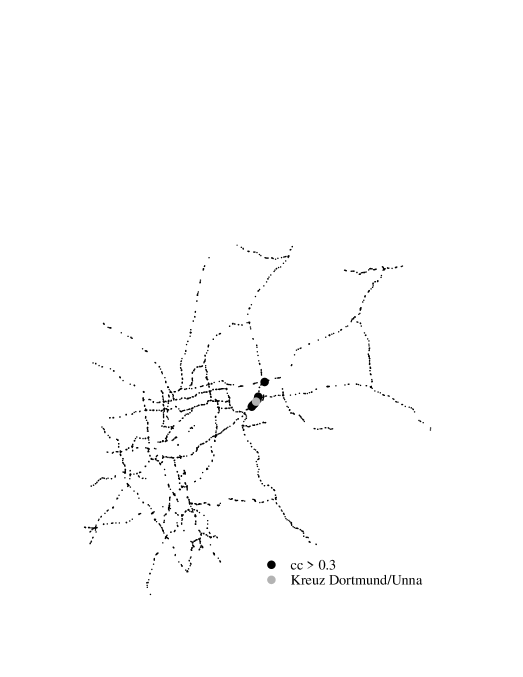
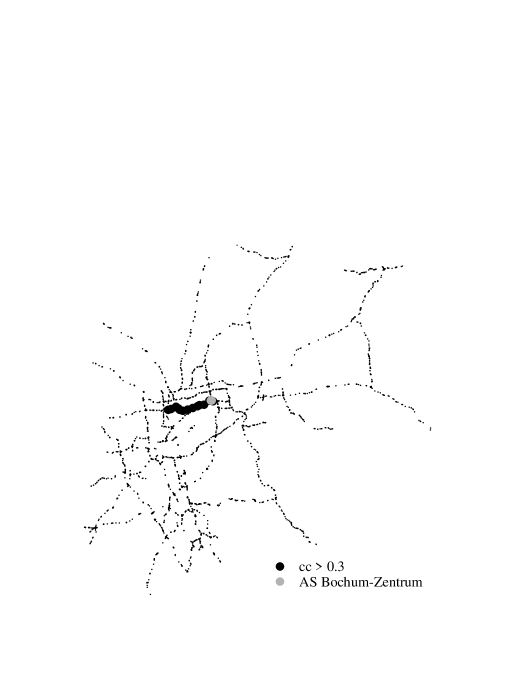
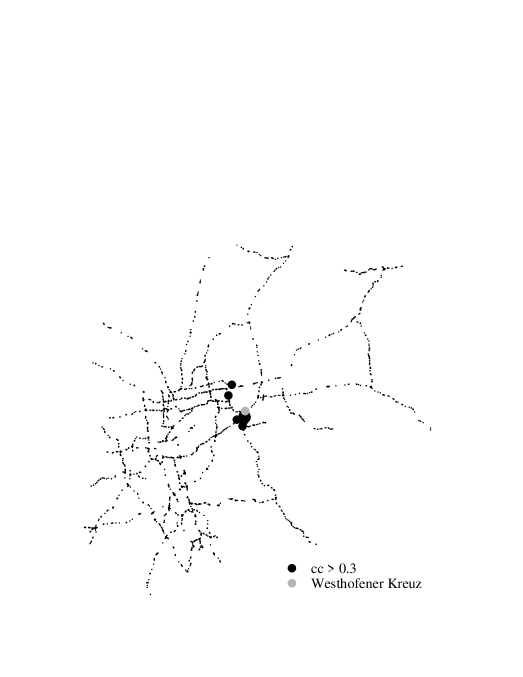
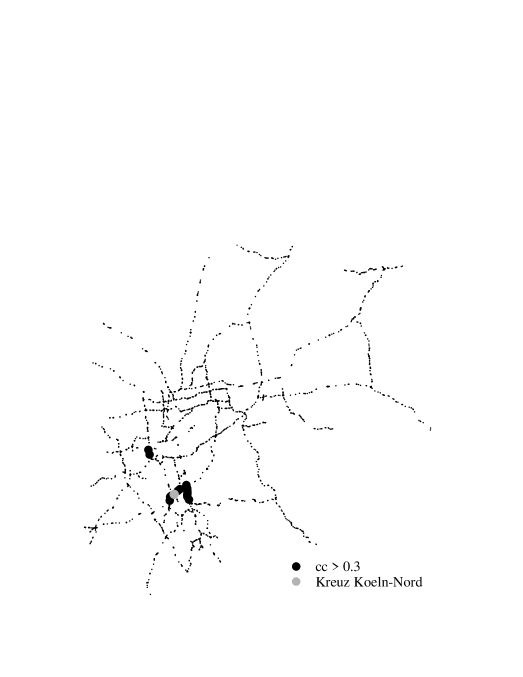
Although the activity gives only a rough estimate of the jamming state at an inductive loop, the typical spatial extension of jams can clearly be seen. The large jam probability in region 2 in the driving direction south/west can be related to a jamming of large parts of the A1 between the Westhofener Kreuz and the Kreuz Dortmund/Unna (Fig. 10) since the correlation shows large values. The same picture can be drawn in the area of Köln (region 4) where a jam may cover a distance from the Kreuz Köln West and from the Kreuz Köln Ost to the Kreuz Leverkusen. The largest extension of a jam can be found on the A40 (region 1) where strong correlations between the Kreuz Duisburg and the Kreuz Bochum are measured. Obviously, there are also correlations with highways that are very far away from the reference detector, but which are not connected by a sequence of succeeding inductive loops with a large jam probability. The correlations are simply a consequence of a large traffic load of the network which leads to many jams on various highway sections. Since the number of jams counted at the reference detector is large, correlations of a free flow signal can be excluded.
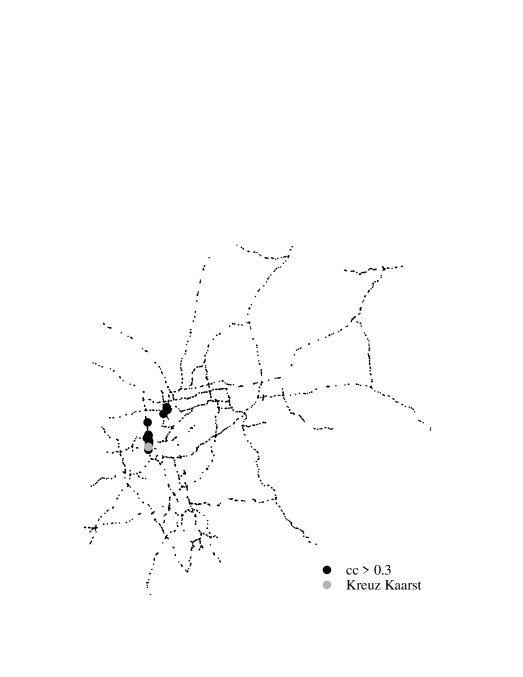
The correlation analysis of the driving direction north/east reveals strong values on the A57 near the Kreuz Kaarst (Fig. 11) and again on the A40 between the Kreuz Bochum and the Kreuz Duisburg (Fig.12). A jam measured at the Westhofener Kreuz (Fig.13) can branch due to the highways intersection on both, the highway A45 and the highway A1.
The analysis of the activity allows for the daily occurrence of jams, but temporal differences due to the morning or afternoon rush-hours are omitted. Therefore, the activity is classified into the five periods used for the jam probability calculation. This additional consideration of the temporal occurrence of the activity allows a better determination of the spatial correlation of the measurement locations.
The picture of large congested areas on the highways can be confirmed by the classified activity correlation analysis. Especially the A40 between the Kreuz Bochum and the Kreuz Duisburg in the directions east and west, the A57 in the vicinity of the Kreuz Kaarst in the direction north and the area of Köln in the direction south/west (Fig. 14) show strong correlations of consecutive measurement locations. Since the finer discretization of the activity time-series does not change the results significantly, the classification of the activity into five intervals is sufficient for the proper recording of the temporal occurrence of jams. Thus, although the classified activity is only a rough estimate for the density time-series of a detector, the correlation analysis nevertheless allows the determination of the spatial extension of jams.
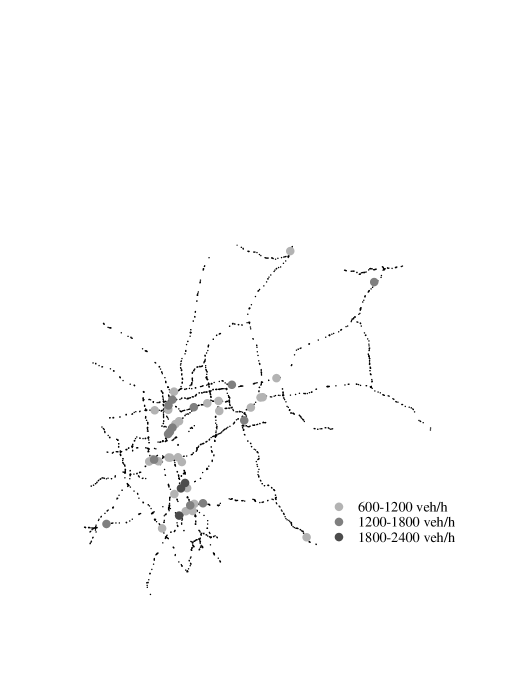
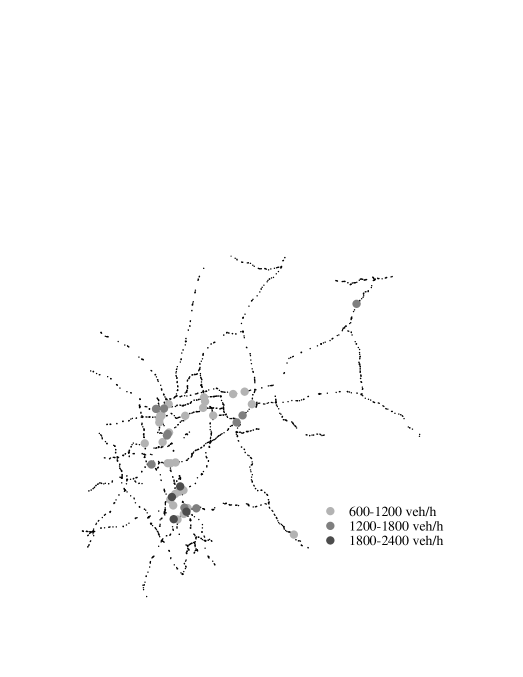
The correlation analysis supports the results drawn from the jam probability calculation. Although jams can have a large spatial extension, branching of a jam via a highway intersection is rarely observed. As a consequence one can conclude that the bottlenecks are, apart from the Westhofener Kreuz, a result of perturbations due to on- and offramps rather then local capacity restrictions. As one can see in Fig. 15 and Fig. 16, most of the sources of the network with a large injection rate are concentrated in the four regions. In addition, most of the sinks can be found there 111The source and sink rate is calculated by summing up the flow of all lanes at a measurement section. The difference of the total flow between two succeeding sections gives the loss or gain of the number of vehicles.. Therefore, traffic in these four regions is determined by strong fluctuations of the traffic demand and, thus, the flow, resulting in jams with a large spatial extension. However, these jams are restricted to single highways and do not affect traffic in other parts of the network.
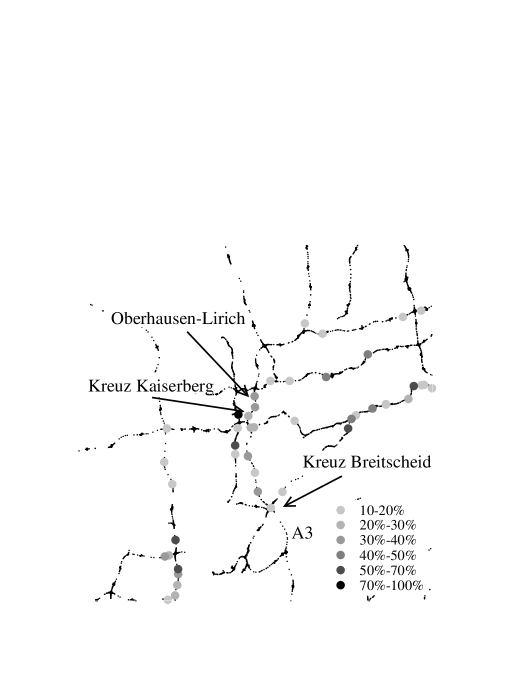
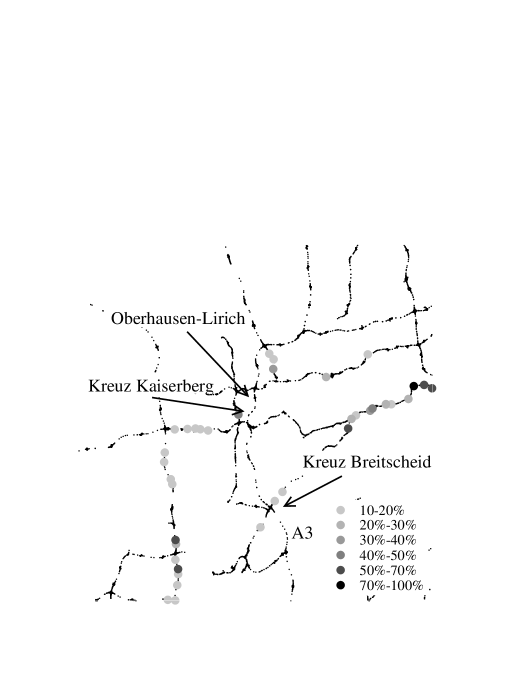
Nevertheless, an example of a topological bottleneck is given in Fig. 17. The bottleneck is located north of the junction Oberhausen-Lirich on the A3 and is generated by a reduction from three to two lanes in each driving direction. In September 2001 this bottleneck was eliminated by the extension to three lanes. Due to the road works, jams regularly emerged in the south of the bottleneck. These jams could have an extension up to the Kreuz Breitscheid, passing the Kreuz Kaiserberg undisturbed. For comparison, Fig. 18 shows the same part of the network after the road constructions have been finished. Obviously, the probability to find a jam on the A3 south of the junction Oberhausen-Lirich is reduced drastically. A systematical impact on other parts of the highway network, however, cannot be observed.
5 Conclusion
The analysis of the highway network of North Rhine-Westfalia leads to the following results: The main traffic load concentrates on the inner network where the conurbations of the Ruhrgebiet (region 1), the areas of Dortmund (region 2), Düsseldorf and Krefeld (region 3) and Köln (region 4) are located. In these regions, traffic is predominantly determined by commuter or local traffic. In contrast, the outer regions of the network are dominated by long-distance traffic, indicated by a large truck share on the total traffic volume. Jams can be measured very often in the central part of the network i.e., jam probabilities of more than have been measured. This picture can be confirmed by a more detailed analysis of the traffic data which takes the daily occurrence of jams into account. Like in (Chrobok, 2000; Chrobok, 2000), the days can be classified into monday to thursday, friday, saturday and sunday. However, the time a jam emerges is considered by the subdivision of one day into five intervals. As a result, most of the jams can be traced back on the morning and afternoon rush-hours, but for the areas of Köln (region 4) and Dortmund (region 2), the probability to find a jam is large during the whole day. In addition, on fridays, the main traffic load is shifted from the morning to the afternoon rush-hour.
The correlation analysis of the activity takes the temporal occurrence of a jam at consecutive measurement locations into account. Large correlations between succeeding detectors in the four regions can be measured. Nevertheless, the jams are mainly restricted to single highways and do not branch on other highways via intersections. The only bottleneck which can be identified is the highway intersection Westhofener Kreuz. A more detailed calculation of the correlation by means of a classified activity confirms these results.
The bottlenecks of the network are therefore predominantly on- and offramps rather than topological peculiarities of the highway system. It is the large in- or outflow at ramps that perturbes the stream of vehicles on the main highway. As proposed in (Salem, 1995; Huberman, 1999), it has to be expected that ramp metering systems are able to counteract these destabilization of the flow and reduce the formation of jams. In this way a restricted flow on the ramps may lead to a significant increase of the capacity of the main highways. Of special interest for a capacity optimization is the existence of some “hot spots” in the network: The highest jam probabilities are spatially and temporally well localized. These are the parts of the network, where the flow has to be optimized. Presently these sections self-organize in a congested state, leading fluxes that are far below their capacity. The situation can be improved a lot by controling the number of entering cars and by optimizing the traffic stream at the on- and off-ramps at this section. The small number of bottlenecks that are present in the network shows that it is possible to improve the capacity of the network with a reasonable technical effort. Of particular interest are sections where the main input is from other, less crowded, highways. In these cases a restricted input does not lead to a collapse of the urban traffic.
There is of course another way to avoid congestion in conurbations. Our analysis shows that the jams are caused mainly by commuters. This means that a better usage of public transport in the urban areas would indeed reduce significantly the congestion at the conurbations.
Summarizing our analysis has shown that the bottlenecks of a highway network can be found by means of a simple statistical analysis. The distribution of the bottlenecks in the network indicates that optimization strategies can be successfully applied in order to increase the capacity of the network.
Acknowledgments: The authors are grateful to the Landesbetrieb Straßenbau NRW for the data support and to the Ministry of Economics and Midsize Businesses, Technology and Transport as well as to the Federal Ministry of Education and Research of Germany for the financial support (the latter within the BMBF project “DAISY”).
References
- Appert, C.,
-
and L. Santen. (2001). ”Boundary Induced Phase Transitions in Driven Lattice Gases with Metastable States.” Physical Review Letters 86, 2498–2501.
- Ariaratnam J. T.,
-
and S. H. Strogatz (2001). ”Phase Diagram for the Winfree Model of Coupled Nonlinear Oscillators.” Physical Review Letters 86, 4278–4281.
- Barlovic, R.,
-
T. Huisinga, A. Schadschneider, and M. Schreckenberg. (submitted). ”Open boundaries in a cellular automaton model for traffic flow with metastable states.”
- Brockfeld E.,
-
R. Barlovic, A. Schadschneider, and M. Schreckenberg. (2001). ”Optimizing Traffic Lights in a Cellular Automaton Model for City Traffic.” Physical Review E 64, article number: 056132.
- Chrobok R.,
-
O. Kaumann, J. Wahle, and M. Schreckenberg. (2000). ”Three Categories of Traffic Data: Historical, Current, and Predictive.” In E. Schnieder, and U. Becker (eds.), 9th IFAC Symposium Control in Transportation Systems. Braunschweig: IFAC, pp. 250–255.
- Chrobok R.,
-
J. Wahle, and M. Schreckenberg. (2001). ”Traffic Forecast Using Simulations of Large Scale Networks.” In B. Stone, P. Conroy, and A. Broggi (eds.), 4th International IEEE Conference on Intelligent Transportation Systems., Oakland: IEEE, pp. 434–439.
- Huberman B.A.,
-
and D. Helbing. (1999). ”Economics-based optimization of unstable flows.” Europhysics Letters 47, 196–202.
- Kerner B.S.
-
(2001). ”Complexity of Synchronized Flow and Related Problems for Basic Assumptions of Traffic Flow Theories.” Networks and Spatial Economics 1, 35–76.
- Knospe W.,
-
L. Santen, A. Schadschneider, and M. Schreckenberg. (2002). ”Single-vehicle data of highway traffic: microscopic description of traffic phases.” Phys. Rev. E, in press.
- Kolomeisky A. B.,
-
G. M. Schütz, E. B. Kolomeisky, and J. P. Straley. (1998). ”Phase diagram of one-dimensional driven lattice gases with open boundaries.” Journal of Physics A 31, 6911–6919.
- Papageorgiou M.
-
(1995). ”An Integrated Control Approach for Traffic Corridors.” Transportation Research C 3, 19–30.
- Popkov V.,
-
L. Santen, A. Schadschneider, G. M. Schütz. (2001). ”Empirical evidence for a boundary-induced nonequilibrium phase transition.” Journal of Physics A 34, L45–L52.
- Salem H. H.,
-
and M. Papageorgiou. (1995). ”Ramp Metring Impact on Urban Corridor Traffic: Field Results.” Transportation Research A 29, 303–319.