Correlation lengths of Wigner crystal order in two dimensional electron system at high magnetic field
Abstract
The insulator terminating the fractional quantum Hall series at low Landau level filling is generally taken to be a pinned Wigner crystal (WC), and exhibits a microwave resonance that is interpreted as a WC pinning mode. Systematically studying the resonance in a high quality sample for carrier densities, , between 1.8 and 5.7 cm-2, we find maxima in resonance peak frequency, , vs magnetic field, . , the domain size, or correlation length of Wigner crystalline order, is calculated from . For each , vs tends at low toward a straight line with intercept; the linear fit is accurate over as much as a factor of 5 range of . We interpret the striking linear behavior as due to compressing the electron wavefunctions, to alter the effective electron-impurity interaction.
pacs:
73.43.Lp, 73.50Mx, 75.40GbThe nature of a two dimensional electron system (2DES) in high magnetic field () depends on the interactions of electrons with each other and with impurities, and on the overlap of individual electron wavefunctions. The size of an electron wavefunction, as measured by the magnetic length, , controls this overlap, and can also affect the electron-impurity interaction if the effective size or spacing of the impurities is comparable to . In the high limit, vanishes, and electrons look like classical point particles. Without disorder, they are expected to form a Wigner crystal (WC), which is a triangular lattice stabilized by interelectron repulsion. Introduction of small amounts of disorder pins the WC, making it an insulator, and causing the crystalline order to have a finite correlation length or domain size. The wavefunction overlap increases as is decreased from the high limit; its importance is characterized by , where is the WC lattice constant, or equivalently by the Landau filling factor . At sufficiently high , calculated wcpredict ; kunwc for disorder free systems to be around 1/7, the WC ground state is predicted to undergo a transition to the fractional quantum Hall effect (FQHE)fqheorig liquids.
Experimentally, 2DES are insulators from the maximum accessed down at least to the high edge of the 1/5 FQHE plateaumsreview ; reentrant . Samples of sufficient quality to exhibit the 1/3 FQHE have a well-defined resonancewilliams ; m124 ; clibdep ; clidensity in the microwave spectrum of the high insulating phase. The natural interpretation of the resonance is as a pinning mode of the WC, in which regions of WC oscillate within the impurity potential that pins them. The average (per electron) restoring force constant, , on static displacement away from equilbrium positions determines the frequency of the resonance peak. This force constant is , which defines , the pinning frequencyflr ; nlm , with the carrier effective mass. In the magnetic field, cyclotron motion mixes with the oscillation in the pinning potential for the resonating 2DES, resultingflr in the observed resonance peak frequency , as long as the cyclotron frequency , which must be the case for resonances in the frequency range of interest. In the classical, high limit, in which is much smaller than any feature of the disorder, and also small enough that wavefunction overlap of neighboring electrons can be neglected, is constant in , and .
Correlation lengths of crystalline order, or domain sizes, can be calculated directly from and the elastic constants of the WC. Recent theoriesfertig ; chitra ; fogler identify the length directly relevant to as the Larkin length, , over which displacements of equilibrium positions of electrons from perfect crystalline order reach the characteristic length of the electon-impurity interaction. In the classical, high limit, the dependence of on has saturated, and is a constant. Earlier theoryflr ; nlm considered the particular case of a sinusoidal charge density wave in magnetic field, and so obtained in terms of a correlation length that we denote , over which displacements of equilibrium positions of electrons from perfect crystalline order reaches the lattice constant .
This paper presents data on the microwave resonance for a high quality 2DES, surveyed over a wide range of up to 20 T, and density, between 5.7 and 1.8 cm-2 , to cover from 0.2 to 0.038. For all the ’s we looked at, the resonance peak frequency, , vs exhibits a maximum. Most likely because of higher quality in the present sample, such a maximum was not found in previous studieswilliams ; m124 ; clibdep ; clidensity , in which vs was increasing monotonically. We calculate from and the theoretical shear modulus of a WC of classical point particles, and find in the range of 0.23 to 0.71 m. Plots of vs (with fixed) tend toward a straight line with intercept, , at low , with upward curvature developing at most ’s as is approached from below. The linear form for the vs data is quantitatively convincing for the lowest few densities surveyed; at the lowest there is a precise fit to the data over a factor of 5 in . The large ranges of linear fit for low , extending to such low , suggest the linear behavior is an effect of the interplay of and impurity correlation lengths. We interpret the upward curvature that sets in at higher as an effect of the correlations responsible for the FQHE.
The microwave measurement methods used here are similar to those described in earlier publications clibdep ; clidensity . The inset to Fig. 1 shows a sketch of the sample. Metal film, shown as black in the figure, was patterned onto the top of the sample to form a coplanar transmission line consisting of a 45 m wide center strip separated from side planes by slots of width m. The narrow center conductor was driven and the two side conductors were grounded, and the line coupled capacitively to the 2DES. The geometry confines the microwave field mainly to the regions of 2DES under the slots.
The transmitted microwave power was measured and normalized to unity for the case of vanishing , obtained by depleting the 2DES with backgate voltage. The experiment is sensitive to with wavevector ; we regard the 2DES as in the limit in calculating the real part of diagonal conductivity, Re, from the microwave absorption. We used Re, where is the normalized transmitted power, , the characteristic impedance, and mm is the total length of the transmission line. This formula is valid in the high , low loss limit, in the absence of reflections. Detailed simulation of the transmission line with 2DES in the quasi-TEM approximation indicates this formula is correct to about 15% under experimental conditions. The apparatus is typically 20 times more sensitive to Re than it is to Im. The temperature of all measurements presented here was 50 mK. Microwave power was varied to ensure that the measurement was in a linear regime at the operating temperature.
The data were taken on a AlGaAs/GaAs heterojunction sample with as-cooled density () of cm-2 and 0.3 K mobility of cm2/V s. The sample was not illuminated, and its density was varied down to cm-2 by application of a voltage between a backgate and an ohmic contact, placed outside the transmission line film.
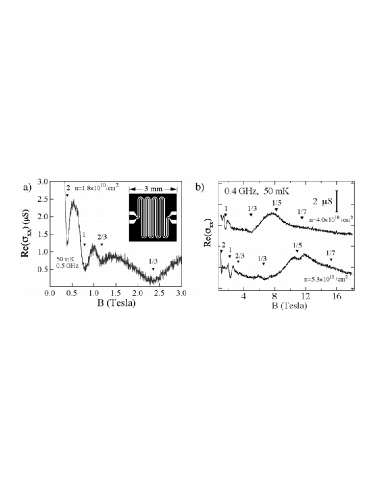
Figure 1 shows traces of Re vs in the quantum Hall regime for three different ’s, for or 0.5 GHz. The 1/3 FQHE is present for all we survey; even the lowest , cm-2, in Figure 1a, exhibits well defined FQH features, indicating the 2DES remains reasonably homogenous even at the large backgate bias required to produce that . The 1/5 FQHE, however, is only present for larger , as seen in Figure 1b, where a 1/5 FQHE minimum in Re vs is present for cm-2 but absent for cm-2. The traces of Figure 1b show broad peaks beginning just above the 1/3 FQHE. These peaks are the manifestations in Re of the rapidly rising dc vs reentrant ; sajoto , observed on increasing beyond the 1/3 FQHE. The 1/5 FQHE minimum for cm-2 is superimposed on that peak.
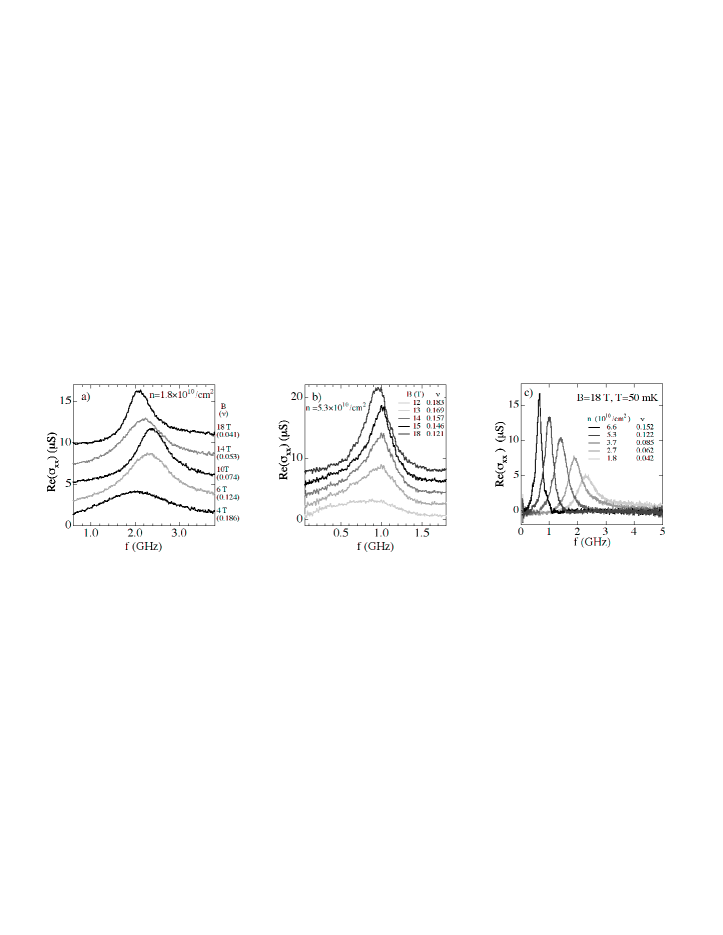
Figure 2 shows typical resonance spectra, Re vs , taken at various and . Spectra for several are shown in Figure 2a for cm-2 and in Figure 2b for cm-2. For just below 1/5, the resonance is present but comparatively broad; increasing initially sharpens the peak and shifts it to higher . At some -dependent magnetic field, the resonance peak frequency, , goes through a maximum and begins to shift downward as is increased further. The reduction of continues, and the resonance remains well-developed, out to the maximum measured. The maximum occurs around 10 T () for the cm-2and around 15 T () for cm-2.
Figure 2c shows resonance spectra for fixed T as is varied. The resonances shift to higher and broaden as is decreased. Upward shift and broadening as is decreased at fixed is seen for all where the resonance is observed, and has been observed in other samplesclidensity ; williams as well.
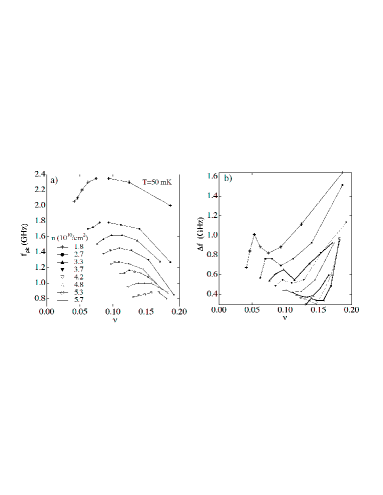
Figure 3a shows vs for the various ’s we studied. Each curve exhibits a maximum in , and the maxima shift generally to lower as decreases. Full width at half maximum linewidths, , are plotted against the same axis in Figure 3b. These increase rapidly as the transition to the FQH liquid is approached. Around the where is maximal, the corresponding curve for the same shows a local minimum.
The increasing vs curves (for fixed ) on the low side of the maxima may be viewed only as the approach to the classical regime in which is expected. The observed increase is sublinear, and while the increase of with is a hint toward the classical behavior, the fully classical, point particle picture is not applicable. The decreasing vs (increasing vs ), seen in the present data set on the high side of the maxima, and throughout previous data setsm124 ; clibdep , has been interpreted in theoriesfertig ; chitra ; fogler based on an interplay of and some disorder correlation length, , whose definition depends on the model of disorder. The calculations, taken for weak disorder with small , givefertig , orchitra ; fogler .
To more simply interpret the behavior of vs we recast the data into domain size, , using the elastic coefficients of the classical WC. is the localization length of transverse phonons in the crystalfogler ; bzeronote . The angular pinning frequency, , where is the transverse phonon progagation velocity, . is the shear modulus. A WC of classical point particlesbm has shear modulus , where we take the GaAs host dielectric constant. is gotten from data using the well-known formulaflr for to take care of the effect of the Lorentz force on the dynamics, . With the classical shear modulus we then get .
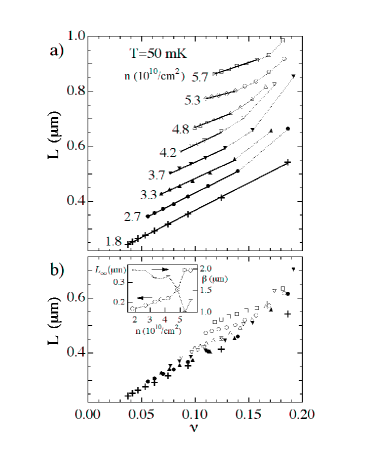
Figure 4 shows plots of the calculated vs for all the ’s we measured. Panels a and b of the figure show the same data, with successive curves offset for clarity only in panel a. Most striking are the data for the smallest , cm -2, which fit a straight line over the entire range of measurement of the resonance, over a factor of 5 in . The fit is accurate to within the instrumental errors in , which we estimate as about m, propagating mainly from error in . The plots for all the other tend to curve upwards for larger , as 1/5 is approached. For the lower ’s, the linear behavior holds over substantial ranges of and is quantitatively demonstrated.
The straight line regions of the vs plots extend out to extremely low , so it is natural to interpret the linear behavior as an effect of electron-disorder interaction rather than interelectron wavefunction overlap. Particularly if it is due to interface roughnessfertig , the disorder potential can vary on extremely small length scales, down to about the lattice constant of GaAs. The small lengthscales associated with the disorder would make the effects of electron-disorder interaction saturate less easily at high than interelectron wavefunction overlap effects.
Because of the clear linear behavior for the lowest few ’s, we fit the low tails of all the vs plots to , where and are the fit parameters, and is the domain size extrapolated to infinite . The least squares fits are shown as heavy lines in Figure 4a, and extend over the points that were included in the fits. The inset to Figure 4b shows the parameters of the least squares fits. The curves appear irregular for larger , and are more reliable for small , where the linear ranges of vs are substantial. For cm-2, .elasticok
In the weak pinning energy limit, random pinning modelsfertig -fogler predict , so that increases when the WC is stiffer. may explain why the low , low data of Figure 4b group so closely when plotted against the Landau filling, which contains the density as well as the magnetic length, . vs may give some insight into the nature of the pinning in the limit where electrons look like point particles. In the inset to Figure 4b, vs clearly increases, as expected for weak pinning. For cm-2, vs in the inset to that figure is roughly linear, with a fit resulting in a slope of m3, and intercept of 0.13 m.
We interpret the upward curvature of the vs data as 1/5 is approached (except for cm-2) as effects of correlations related to the FQHE, which require interelectron overlap. One possibility is that is decreasing as 1/5 is approached due to these correlations, as predicted in a recent theorynarevich of a WC made up of composite fermions. presented in Figure 4 is calculated using the classical shear modulus, , and would overestimate the true domain size, , if the true shear modulus is less than . This overestimation in the data would result in upward curvature of the plots, even if the underlying vs were straight lines, like the cm-2 plot in Figure 4. We interpret the reduction in the curvature at low as due to the suppression of the FQH type correlations, owing to the increased importance of disorder relative to electron-electron interaction at lower . This is consistent with Figure 1b, in which the 1/5 feature is suppressed at lower .
In summary, systematic studies of the microwave resonance for many ’s show maxima in vs ; these curves are greatly simplified on converting into a domain size . vs fits a straight line for low and low , but curves upward as is approached. The straight line behavior is interpreted as an effect of interplay between electron wavefunctions and disorder features; the upward curvature is interpreted as an effect of FQH-type correlations, possibly associated with softening of the WC.
The authors wish to thank R. Chitra, H. Fertig, M. Fogler and D. Huse for valuable discussions. This work is supported by the Air Force Office of Scientific Research, and the National Science Foundation.
References
- (1) Y. E. Lozovik and V. I. Yudson, JETP Lett., 22, 11 (1975); P. K. Lam and S. M. Girvin,Phys. Rev. B 30, 473 (1984); D. Levesque, J. J. Weis and A. H. McDonald, Phys. Rev. B 30, 1056 (1984); X. Zhu and S. G. Louie, Phys Rev. B 52, 5863 (1995).
- (2) Kun Yang, F. D. M. Haldane, and E. H. Rezayi Phys. Rev. B 64, 081301 (2001).
- (3) D. C. Tsui, H. L. Stormer, and A. C. Gossard, Phys. Rev. Lett. 48, 1559 (1982).
- (4) M. Shayegan, in Perspectives in quantum Hall effects, edited by S. Das Sarma and A. Pinczuk (Wiley, New York, 1996), 34.
- (5) H. W. Jiang et al. ,Phys. Rev. B 44, 8107 (1991); H. W. Jiang et al. , Phys. Rev. Lett. 65, 633 (1990).
- (6) D. C. Glattli et al. , Surf. Sci 229, 344 (1990).
- (7) L. W. Engel et al. , Solid State Commun., 104 167-171 (1997).
- (8) C.-C. Li et al. ,Phys. Rev. Lett. 79 1353 (1997).
- (9) C.-C. Li et al. , Phys. Rev. B 61, 10905 (2000).
- (10) H. Fukuyama and P. A. Lee, Phys. Rev. B 17, 535 (1978); ibid. 18, 6245 (1978).
- (11) B. G. A. Normand, P. B. Littlewood and A. J. Millis, Phys. Rev. B 46, 3920 (1992); A. J. Millis and P. B. Littlewood, ibid. 50, 17632 (1994).
- (12) H. A. Fertig, Phys. Rev. B 59, 2120 (1999).
- (13) R. Chitra, T. Giamarchi and P. Le Doussal, Phys. Rev. Lett. 80, 3827 (1998); Phys. Rev. B 65, 035312 (2001).
- (14) Michael M. Fogler and David A. Huse, Phys. Rev. B 62, 7553 (2000).
- (15) T. Sajoto et al. ,Phys. Rev. B 41, 8449-8460 (1990).
- (16) In the equivalent, the high shear modulus and electron-impurity interactions are retained: only the Lorentz force that mixes the elastic and cyclotron response is turned off.
- (17) L. Bonsall and A. A. Maradudin, Phys. Rev. B 15, 1959 (1977).
- (18) If , then is possible and obtained here does not conflict with the use of an elastic model to obtain .
- (19) R. Narevich, Ganpathy Murthy and H. A. Fertig, cond-mat/ 0104579 (2001).